
The Headline View
If the press banners generated by AEMO’s annual Electricity Statement of Opportunities (ESOO) were a reliable guide to its content – and I’m not necessarily claiming they are – then there’s clearly been a shift in the message between 2019 …
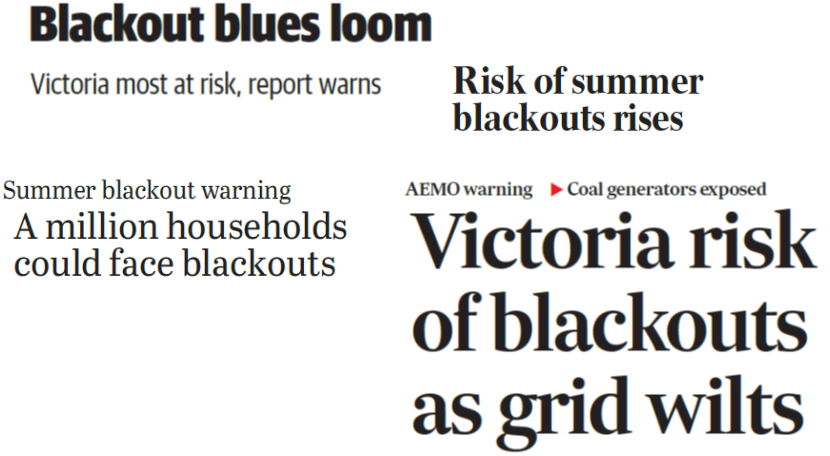
… and 2020 …
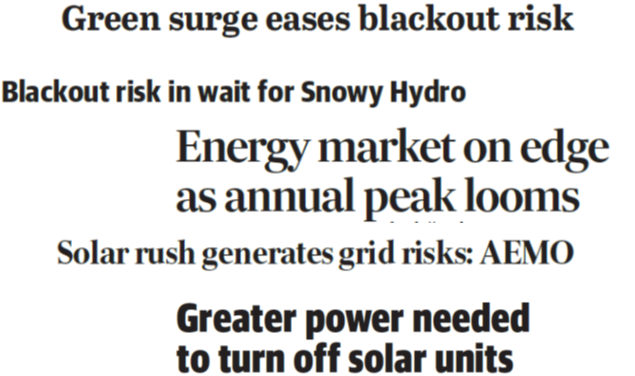
Only two of this year’s headline writers managed to work in the dreaded “blackout” word, and even one of those used it in a positive sense, as in the risk of blackouts has decreased. And if you bothered to read the article under the headline referencing Snowy Hydro, it was referring to blackout risks sometime after 2023/24. Whilst the last two headlines refer to a very different set of risks highlighted by AEMO in this year’s report, which I’ll come to later.
Reliability and its drivers
So what does the AEMO document itself say about reliability levels in comparison to last year’s supposedly apocalyptic projections? A comparison of the key chart from 2019 and 2020 helps explain this year’s lack of red meat for one stream of journalistic appetite:
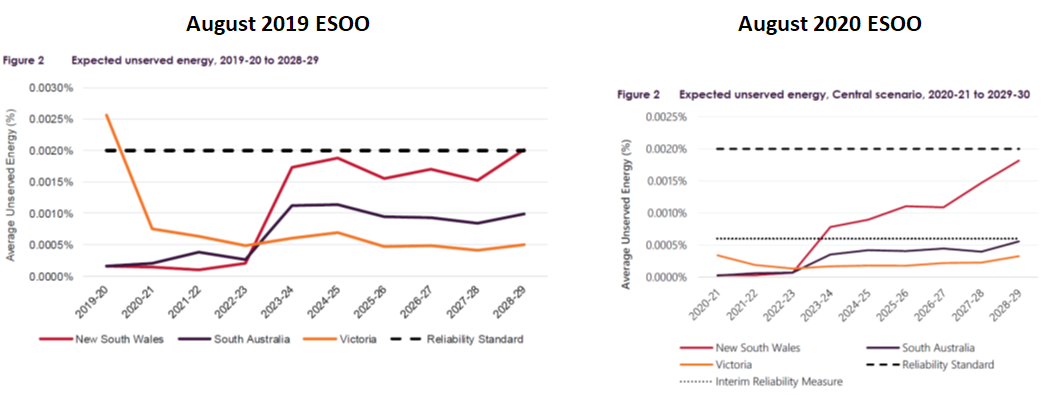
As I pointed out a year ago, all those headlines generated by the 2019 ESOO in a sense related to the single data point on last year’s chart showing projected Unserved Energy (USE) in Victoria for summer 2019-20 exceeding the NEM Reliability Standard of 0.002%. Even last year, for all other future years and regions reliability remained within that Standard, as do all of this year’s projections (except for 2029-30, not shown, when Vales Point in NSW nominally retires). So this year’s absence of fevered commentary about blackouts is perhaps something we could have expected.
In past analyses of the ESOO and its methodology, with links helpfully collated in Paul’s post yesterday, I’ve gone into a lot of detail about what these projections mean and how AEMO produces them. I won’t repeat any of that here. What’s obvious from the charts is that projected reliability has improved in each of the regions shown, with Queensland and Tasmania not shown at all since AEMO projects no material USE in either of those regions over the decade analysed. In terms of the USE metric, the improvement is by a factor of between two and five times in most years (that is, projected USE is about one half to one fifth what it was in last year’s ESOO).
To get a sense of what’s driving year on year changes in projected USE, it’s helpful to look at another chart in this year’s ESOO:
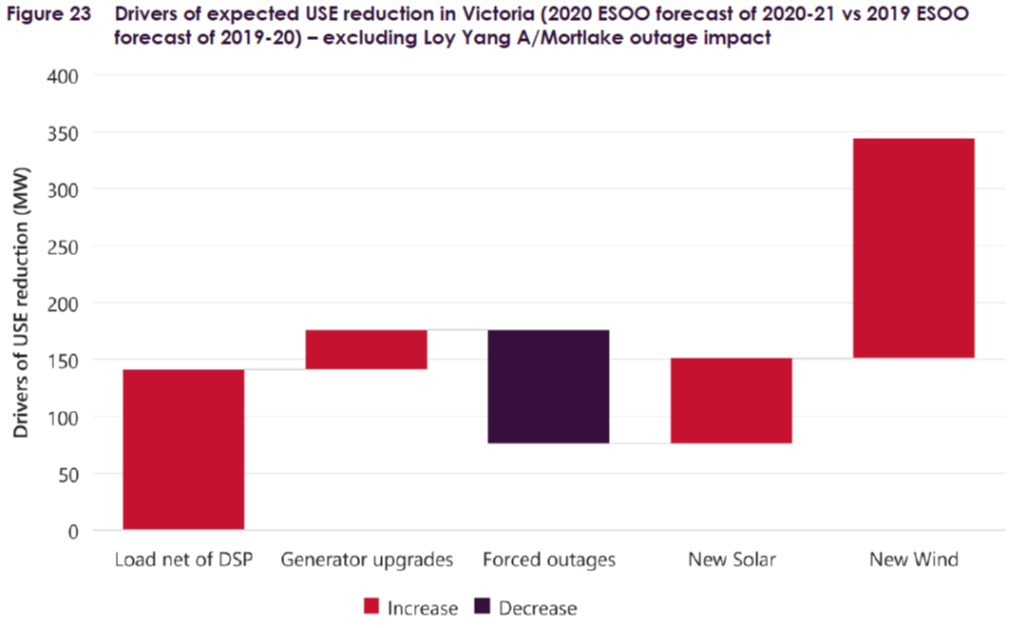
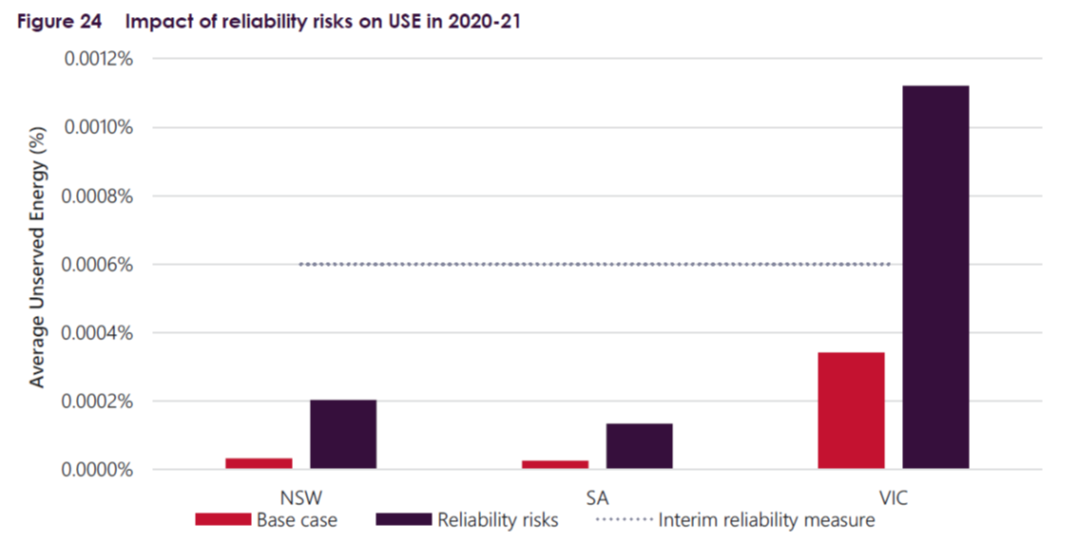
The chart is breakdown of demand and supply factors driving the improvement in projected reliability in Victoria for the forthcoming summer, ie 2019-20 (2019 ESOO projection) vs 2020-21 (2020 ESOO).
On the demand side we see an “improvement” of about 150 MW – meaning a reduction in peak demand levels. Lots of analysis and commentary in the ESOO about how this has been forecast but suffice to say that the economic and behavioural impacts of COVID-19 are important here. That said, it’s really only a small change in the context of a peak demand level of around 10,000 MW.
On the supply side, the largest contributors to lower USE / better reliability are the contributions from new Victorian wind and utility scale solar generation. These contributions are MUCH smaller than the nameplate capacity of the plants commissioned since last summer and others expected to be commissioned in advance of this summer, totalling something like 4,300 MW, because as we are used to being helpfully reminded “the sun doesn’t always shine and the wind doesn’t always blow“. But in the statistical methodology and modelling used by AEMO to evaluate supply-demand balance, the impact of new large scale renewables is not zero and the values charted represent indicative or effective contributions from these new sources averaged across many different scenarios and incidences of tight supply-demand balance.
The only drag on reliability in the above chart is an increase in projected “forced outage” risks, primarily at older coal plants, which translates to a reduction in their average available supply. More on this further below.
To understand why relatively small changes in supply and demand side contributions (in the context of Victoria’s 10 GW peak demand) can reduce projected USE by factors of 2, 5 or even 10 (2019-20 vs 2020-21), it might help if I illustrate in a highly simplified way what in essence USE is measuring:
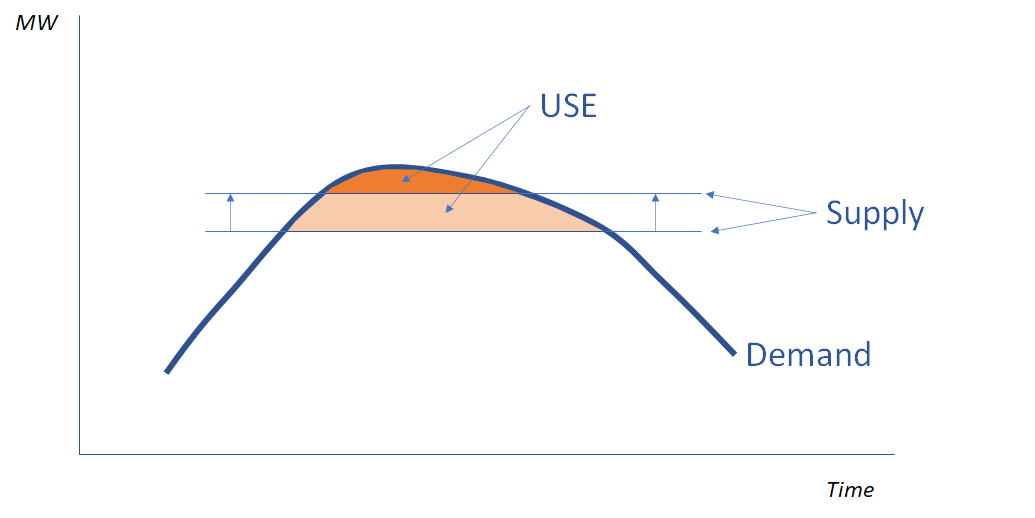
Think of this as charting potential demand (the curved thick line) and available supply (the thin horizontal levels) on a day of very high demand. USE or “unserved energy” is just the coloured area under that demand curve which can’t be met from available supply. Notionally, to keep the lights on in this situation, AEMO would have to ration available supply by interrupting customers using just the quantity and profile indicated by the coloured area over the period of supply shortfall. The chart illustrates that relatively small improvements in available supply, lifting the supply line, make a big difference to the size of the coloured USE area, because less demand would have to be interrupted for a shorter period of shortfall.
Actual reliability modelling may be a million times more sophisticated than this simple illustration, but the underlying principles do carry through.
Sensitivities
A couple of other charts in the ESOO are helpful in assessing how sensitive the projections are to changes in key assumptions like whether all the 1,900 MW of new wind and solar in Victoria that is not yet in operation but due to be commissioned before this summer actually meets schedule, or whether coal plant forced outage levels are worse than projected:
The chart shows – not unexpectedly – that assuming that only half of the yet-to-be commissioned large scale renewable projects are operating in time for summer and that forced outage durations at conventional plant increase by 50%, would most impact reliability in Victoria, which has by far the biggest slate of projects due for completion. But in no region would USE push past the 0.002% Reliability Standard. (I’ll come back later to what the 0.0006% “Interim Reliability Measure” shown here is all about)
The second sensitivity chart highlights the impact of obscurely-titled “Actionable ISP Projects” on projected reliability further out in the decade:
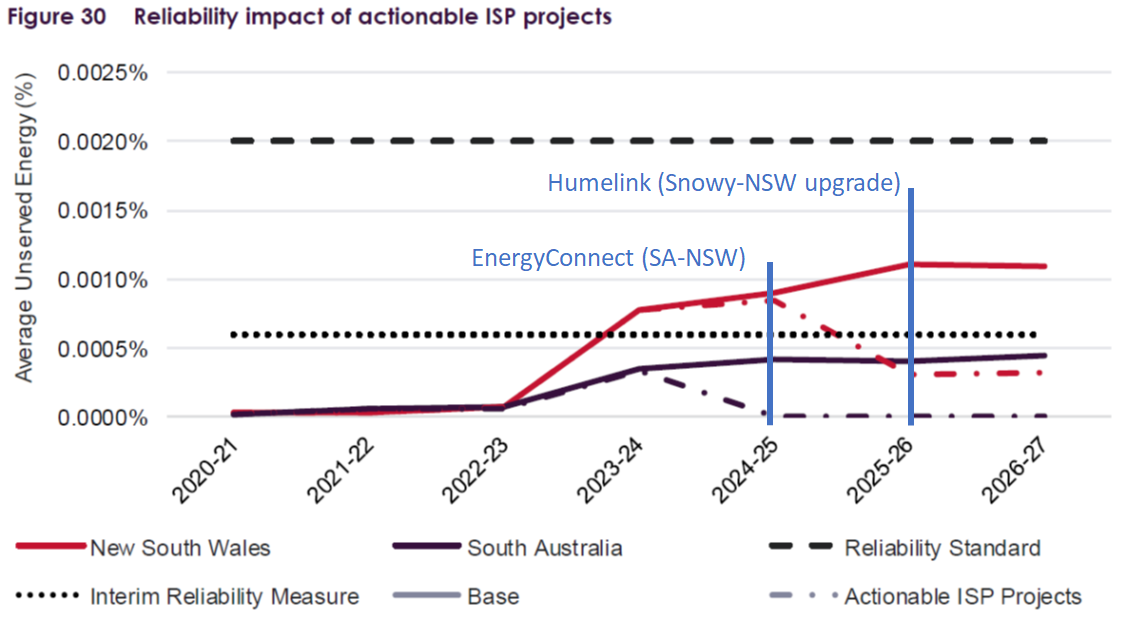
The truly awful term “Actionable ISP Projects” is NEM-speak for major transmission augmentations that have been identified as likely to be economically justified in AEMO’s Integrated System Plan (ISP), and which have progressed a certain way down the regulatory path to reality. The two highlighted in the above chart as improving reliability in South Australia and NSW are Project EnergyConnect, a new high voltage interconnection between South Australia and NSW, and Humelink which is essentially upgrading transmission capacity in southern NSW to enable the increased generation capacity of the Snowy 2.0 project to actually reach the key demand centres in the rest of NSW. At present neither of these transmission augmentations is included in the ESOO base case modelling because they have yet to clear all the regulatory and investment commitment hurdles required under AEMO’s methodology.
But what’s this Interim Reliability Measure thing?
If you’ve been following closely, you’ll have noticed the new line on this year’s charts at 0.0006% USE (that’s 6 parts per million for any scientists out there), labelled “Interim Reliability Measure”. Previously, all actions proceeding from the ESOO reliability assessment, such as AEMO procuring out-of-market reserve supply or demand reduction capability under the Reliability and Emergency Reserve Trader (RERT) provisions of the NEM Rules, were linked to exceedances of the 0.002% USE Reliability Standard.
In some recent changes prompted by the COAG Energy Council requesting the Energy Security Board to review NEM reliability (the umpteenth such review in recent years), certain key aspects of the NEM reliability framework, in particular trigger levels for the Retailer Reliability Obligation, and AEMO’s ability to procure short, medium and long term RERT reserves, will shortly be linked (following necessary regulatory / legislative amendments) to exceedances of this new “Interim Reliability Measure”, not the formal 0.002% Reliability Standard (which numerous other reviews have found to remain appropriate).
If you’re wondering whether all this amounts to a de-facto change in the Reliability Standard itself, that’s largely correct although a change in that Standard ought to be accompanied by changes to other reliability-related settings in the NEM, including the level of the Market Price Cap (currently $15,000/MWh). The way these things work, increasing the stringency of the Reliability Standard’s USE threshold by a factor of 3.3 (from 0.002% to 0.0006%) would be expected to lead to a substantial increase in the Market Price Cap in order to provide sufficient investment incentive for additional but very very rarely dispatched in-market generation needed to lift market reliability to these levels. I doubt that COAG Energy Ministers wanted to see an outcome involving explicit price increases though.
A useful article summarising some of the the debate around these changes appeared yesterday on The Conversation site. You can also find a lot more detail on the ESB review and forthcoming changes here.
And what else is worrying AEMO?
In recent editions of the ESOO, particularly last year’s, AEMO has been far more explicit – vocal, activist even – about reliability and security-related issues in the NEM that are not captured directly, or at least not fully, in the ESOO’s formal reliability assessment.
Last year’s focus was on whether the calculation, form and level of the NEM’s reliability measure and Standard themselves were adequate to capture all the dimensions of risks to reliability that AEMO foresaw as the electricity system transitions, thermal plant ages, and weather-related volatility increases. AEMO went as far as proposing a change to the reliability metric which would have explicitly incorporated “loss of load probability” in addition to USE. To some extent, introduction of the Interim Reliability Measure addresses these concerns as resulting reliability levels would align more closely with the measures suggested by AEMO in last year’s ESOO.
This year, two areas that are clearly exercising AEMO’s collective mind are thermal plant reliability, and especially the issue of falling minimum grid demand levels driven by continued installation of small-scale rooftop solar PV. The longest single chapter in this year’s ESOO deals with the minimum demand issue and what to do about it.
On thermal plant reliability, AEMO highlights the historically increasing levels of full and partial forced outages affecting coal plant in particular, and projects these to continue except for a short term improvement as Liddell in NSW retires (my apologies for the change in colour scheme between these two charts, its an AEMO thing):
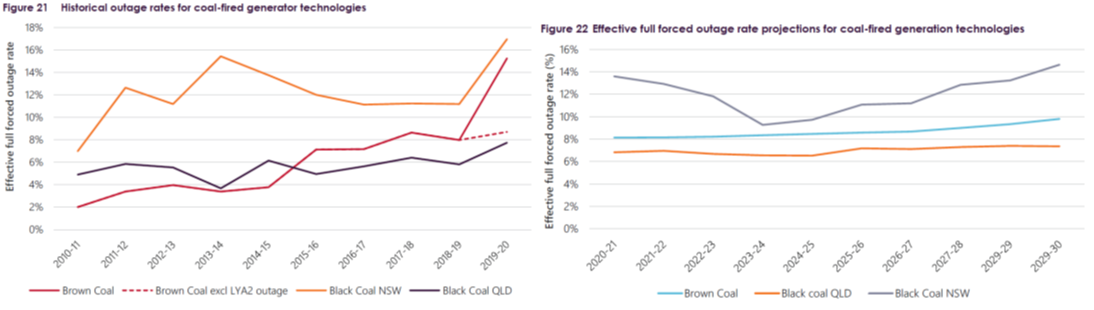
My only other comment on this is that the NSW black coal rates, both historically and forecast, seem out(r)ageously bad. The underlying technologies for Queensland and NSW black coal generation are similar and it is very hard to explain why the performance of NSW plants has been and is projected to remain so much worse than those in Queensland, and worse even than that of brown coal generation in Victoria. AEMO has gathered input from the generators themselves in producing these projections and it’s surprising that the expectations of owners in NSW are so different from those in other states.
The bigger issue flagged by AEMO, that of minimum grid demands and the impact of continued increases in rooftop solar PV capacity, is multifaceted and certainly worthy of a whole article, or series of articles, in its own right. Two of the headline writers highlighted at the top of this post picked this one as the key issue to focus on in this year’s ESOO, rather than the old saw of summer blackouts.
It certainly seems that AEMO sees too much (solar) generation and not enough demand as a bigger near-term risk to keeping the lights on in the South Australian region (at least in certain scenarios such as “islanding” of the region from the rest of the NEM) than the usual combination of high demand and not enough generation. I’m out of time and space to cover the detail here, but it’s well worth reading chapter 7 of the ESOO to understand the issues. And I’m sure there will be plenty of interest in and debate about AEMO’s proposed solutions.
About our Guest Author
 |
Allan O’Neil has worked in Australia’s wholesale energy markets since their creation in the mid-1990’s, in trading, risk management, forecasting and analytical roles with major NEM electricity and gas retail and generation companies.
He is now an independent energy markets consultant, working with clients on projects across a spectrum of wholesale, retail, electricity and gas issues. You can view Allan’s LinkedIn profile here. Allan will be sporadically reviewing market events here on WattClarity Allan has also begun providing an on-site educational service covering how spot prices are set in the NEM, and other important aspects of the physical electricity market – further details here. |
Leave a comment