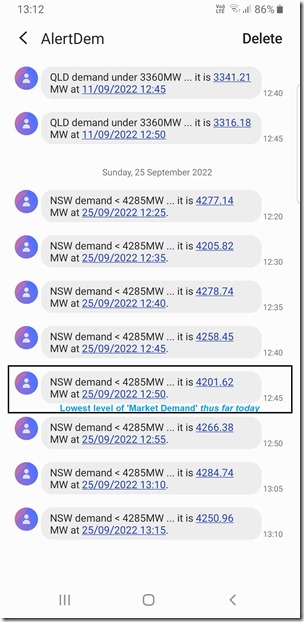
The ‘low demand’ SMS alerts have started again during the middle of the day – today it’s for the NSW region as we see here at 13:12 NEM time:
The prior minimum point for ‘Market Demand’ in NSW was down at 4,286MW … as we see above the lowest point at the point the image was taken was 4,201MW target ‘Total Demand’ for the 12:50 dispatch interval …
… though it has dropped further still today
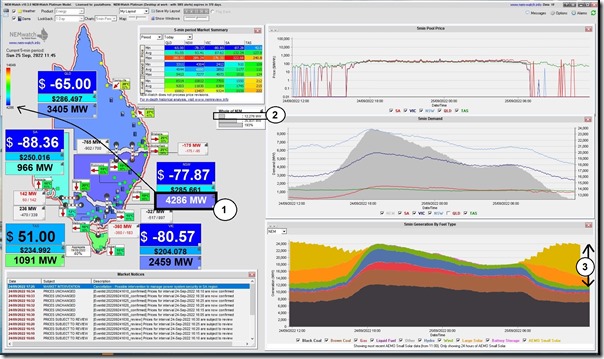
Here’s a snapshot from the NEMwatch display at 11:45 showing the broader situation:
With reference to the numbering on the chart:
1) The NSW ‘Market Demand’ at this point is down at 4,286MW:
(a) which coincided with the prior low point (but not yet dropping below it);
(b) the prior low point was set on Sunday 17th October 2021.
(c) As I hit ‘publish’ the lowest level thus far is 4,197MW at 13:30.
2) The NEM-wide ‘Market Demand’ at this point is down at 12,276MW…
(a) which is below the previously set low point…
(b) … with that prior low point (12,536MW) having been also set on 17th October 2021 (i.e. same day as the prior low point record for NSW).
(c) As I hit ‘publish’ the lowest level thus far is 12,113MW at 12:25.
3) With respect to the ‘Generation by Fuel Type’ chart, there’s three things to note:
(a) Firstly, that the level of ‘Underlying Demand’ peaked at around 09:00 and has been declining since that time;
(b) Subtracting off a solid block of Rooftop PV (estimates from AEMO lag the dispatch interval, but it was above 9,000MW), we see that the level of NEM-wide ‘Grid Demand’ is dropping through the morning
(c) In aggregate at 11:45, there’s around 11,800MW of solar production from Small Solar and Large Solar:
i. which is an impressive yield.
ii. remembering the invisibility of Medium Solar and opacity of Small Solar.
It’s worth reminding readers that the AEMO talks increasingly about ‘Grid Demand’ (using the measure ‘Operational Demand’ to reflect this) whereas we talk about ‘Market Demand’ (using the MMS data field ‘Total Demand’ here to represent).
Expect to see these records continue to tumble in the shoulder months ahead.
—
We’ll come back later (as time permits) to add more…
—
PS1 end-of-day recap
The sun’s setting on Sunday evening so worth noting, in my quick recap of numbers for the day:
1) The low points of ‘Market Demand’ were indeed as follows:
(a) For the NSW region it was (as noted above) 4,197MW at 13:30.
(b) On a NEMwide basis, it was (as noted above) 12,113MW at 12:25.
2) Looking at what AEMO published for ‘Operational Demand’ the numbers were:
(a) For the NSW region the low point was 4,398MW in the half-hour ending 13:00 … which is down from 4,425MW on Sunday 17th October 2021.
(b) On a NEMwide basis, the low point was 12,583MW in the half-hour ending 12:30 … which is down from 12,936MW also set on 17th October 2021.
So next step will be to wait for AEMO confirmation …
PS2 AEMO Confirmation
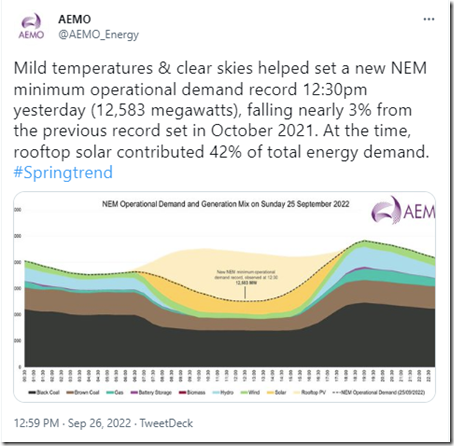
On Monday 26th September 2022 the AEMO provided this confirmation of the new low point for NEM-wide ‘Operational Demand’:
(see the discussion ensuing via their tweet)
… but I did not specifically see anything about NSW demand.
PS3 other discussion
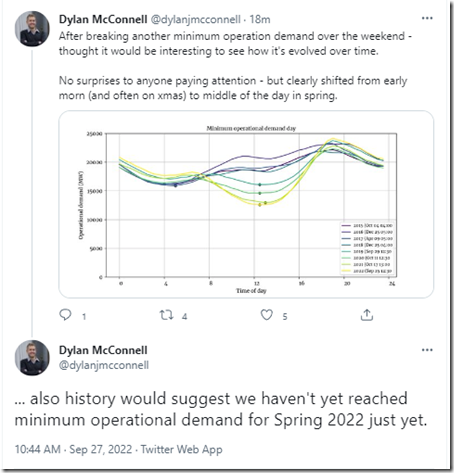
For what it’s worth, I also saw Dylan McConnell note this:


It’s interesting that if we were to include the demand drawn by dispatchable loads (hydro pumps and battery recharging), which are excluded from measures like “Operational Demand” and “Total Demand”, then yesterday’s event wasn’t the lowest demand we’ve seen NEM wide or in New South Wales – in both cases 17th October 2021 would remain the record low day. Shows that large scale storage is playing more of a role.