We’ve noted that ‘Warnings of possible LOR3 (i.e. Load Shedding) for Mon 16th and Mon 17th December 2024 cancelled … at least in (large) part due to delay in Outage on Line 17’ but, in writing that article, noted that forecasts for demand on Monday 16th December 2024 continue to climb.
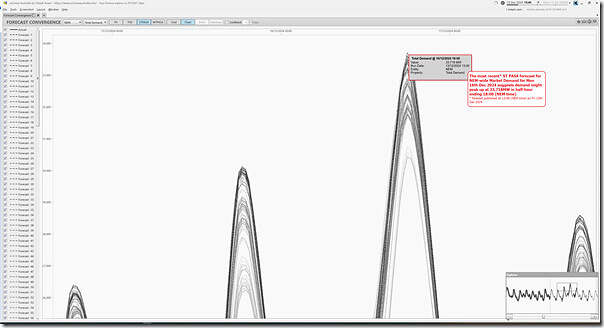
Here’s a snapshot (at 13:45 NEM time on Friday 13th December) of the ‘Forecast Convergence’ widget in ez2view focused on NEM-wide ‘Market Demand’ and zoomed into look at peak demand forecast for Monday 16th December:
As highlighted there, the peak demand (measured as ‘Market Demand’ ) forecast for Monday is 33,718MW in the half-hour ending 18:00 (NEM time).
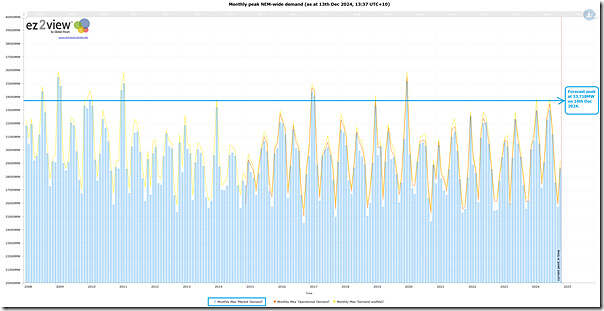
To put this in context, here’s an updated view of the long-term trend of monthly peak demand (several measures, but for comparability focus on ‘Market Demand’) utilising the ‘Trends Engine’ within ez2view :
For those with a licence to the software, click here to open your copy of the above query.
As we can see here, if the level of demand turns out to be as high as forecast, then it would have only been eclipsed in only 9 months over the past 17 years
… with the most recent higher point being almost 4 years ago.
Walking backwards in time we have:
1) January 2020 (almost 4 years ago):
… Many will remember 31st January 2020 as a very stressful day in the NEM, where demand peaked at 35,169MW before storms blew over transmission lines and islanded South Australia.
2) January and February 2017 (almost 10 years ago):
(a) 34,042MW at 16:45 on 10th February 2017; and
(b) 34,396MW at 16:50 on 17th January 2017.
3) Then all the way back in January and February 2011 (almost 16 years ago):
(a) 34,870MW at 13:30 on 1st February and then 35,005MW at 15:50 on 2nd February 2011
(b) 34,480MW at 15:25 on 31st January 2011
4) In January 2010 the peak demand was 33,805MW … so line-ball with what’s forecast for next Monday
5) In summer 2008-09 we saw (what’s still) the highest-ever level level of demand:
(a) 34,124MW at 15:30 on 5th February, then superseded by 34,818MW at 16:00 on 6th February 2009;
(b) 35,879MW at 15:50 on 29th January 2009:
i. A day many will still remember, and which we wrote about
ii. But note that the 28th January and 30th January were also extreme.
6) In July 2008 (the only winter day that high):
… we saw 34,394MW at 18:30 on 28th July 2008.
So, no load shedding (we hope) … but best to still expect some fireworks next week?!


Looking at that chart, there’s no denying that the peaks and general grid utilisation these days is slightly lower, or possibly the same, as when compared to the grid back in its heyday, <=2010.
And that's with an extra 4 million people in Australia since 2010, presumably all using electricity.
Not sure you can infer much from the chart in terms of utilisation of the grid other than peak utilisation. It’s trending monthly peak demand.
One would need to look at average demand to deduce much in terms of utilisation.
@Freddy: Australia’s de-industrialisation has probably outpaced the increase in consumer electricity demand.