It’s now approaching 21/2 years since we released GenInsights21 on 15th December 2021.
At that time, and in the period since, we’ve released some snippets of various pieces of content from this 622-page analytical work – with some of these linked through to either:
1) The 22 x Key Observations in the 1st section; and/or
2) The 28 x deeper-dive Appendices that looked at different aspects of the energy transition.
It’s also noteworthy that we were invited by the Smart Energy Council to share some insights, which we did via a webinar on 5th April 2022. This webinar is embedded in the subsequent article ‘The Energy Transition – Grappling with the Challenges (recording of presentation on GenInsights21 to Smart Energy Council members and others)’, complete with some associated notes.
In the ~28 months since we released that report, there have been times when we’ve wished to have time to share some of what was conveyed across the 28-page Appendix 27 (titled ‘Exploring Wind Diversity’).
1) The recent wind lull of April 2024 has been another of those occasions … a period that others have called ‘the worst week for wind’ (albeit ‘worst’ in only in a relatively short reference time horizon, as revealed below);
2) But to this point it’s only been in the SEC webinar (at the ~0:40:28 mark) that we’ve shared anything of note.
So I thought it would be timely to post this precis as an article. Readers should note, however, that it’s a precis and that they really should read Appendix 27 for the full details …
Background to the analysis in Appendix 27
In June 2017 we were amongst many who were surprised (including a number of wind farmers, we heard since!) by amazingly low levels of wind farm production across all the wind farms that existed at the time.
… a couple articles were written, and are collated here.
Hence when we came to preparation of the GRC2018 (beginning late 2017) this was very much on our minds. Hence in the 180-page analytical component within the GRC2018 we completed a first pass analysis of wind speed diversity across the all Renewable Energy Zones defined in AEMO’s Integrated System Plan 2018 (this was Theme 10).
Following from Theme 10 within Part 2 of the GRC2018, we saw several articles posted on WattClarity, including:
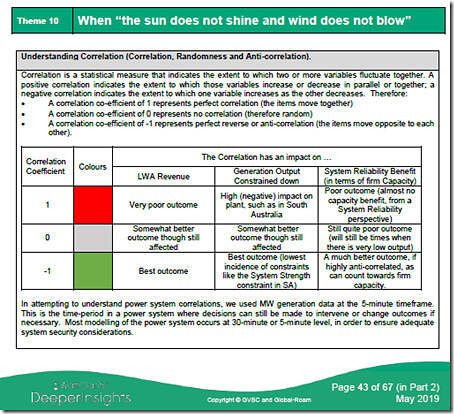
1) For instance, on 26th July 2019 we posted ‘Assessing the diversity of intermittent (wind and solar output)’ highlighting the analytical framework used to interpret the correlation co-efficient. Two key point for readers are that:
(a) there’s three types of outcomes (high correlation, randomness and high anti-correlation) … rather than the two types people typically think of; and
(b) why randomness is not the ideal outcome we would be hoping for.
… Here’s the table we cut out of the GRC2018 again:
2) On Friday 27th September 2019 the Australian Energy Council’s Carl Kitchen posted this article “Integrating Renewables: An Assessment of Generation Correlation” drawing heavily on the analysis contained within this theme.
3) There was also discussion on 20th October 2020
4) … and on other occasions.
In terms of results in GRC2018:
1) It should not really surprise any reasoned analyst to understand that we found at best merely randomness in wind speeds across all the REZ zones across the NEM:
2) As shown in the table above, that means there’s quite modest System Reliability benefit from wind farms being deployed across the NEM.
Of course, this wind speed diversity analysis in the GRC2018 only went so far:
1) Notably it did not take a step further into assessing what it meant in terms of shortfalls (and surpluses) of power (i.e. MW) or energy (i.e. MWh).
2) Indeed, inside GRC2018 we recommended ‘next steps’ any other analyst might take to further develop our collective understanding of the size and significance of these “wind droughts”.
When we began to think about the compilation of GenInsights21 (late in 2020), however, we were disappointed to observe that (to our knowledge) noone had taken up on our recommendation to analyse wind droughts in further detail.
So (as noted here) we took it upon ourselves to work with a couple people from UQ to complete the analysis that became Appendix 27.
Modelling approach
With some words-and-pictures below, we’ll attempt to touch on the highlights of the approach we took … but readers should note the clear caveat that you really should read Appendix 27 itself, as it is explained in some detail there!
Geographical Spread
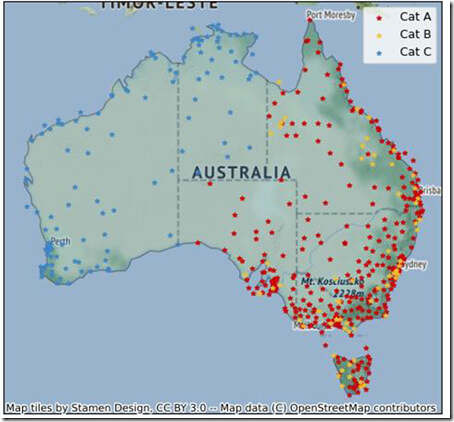
We started with whatever data we had for ~16 years of historical time-series wind speed measurements for these locations across Australia:
There’s approximately 1,000 measurement points across the country – which we allocated to 3 different categories (with a method and reason explained in Appendix 27) and used them in these categories to examine different scenarios.
With these wind speed readings:
1) we prepared time series profiles stretching back up to 16 years based on the BOM measurements (for each measurement points);
2) we mathematically translated these readings upwards to wind speed readings at typical wind farm hub heights;
3) then translated through a power curve to power readings of a 5-minute cadence for all of these measurement points.
Hypothetical Wind + Storage Grid
We then constructed a hypothetical grid to supply actual NEM demand for the year – with the study assumption being that this grid would only be supplied by only Wind Farms and Energy Storage of some sort.
Whilst this is clearly not a ‘real world’ scenario, we selected this in order to gain an understanding of the nature of ‘wind droughts’ over time … using as much historical data as we could lay our hands on.
Simplifying Assumptions
In the Appendix we noted that other studies and analytical pieces we see from time to time (including high profile ones) seem to hide and/or make obscure the simplifying assumptions.
… remember that ‘a model’s just a model – it’s not reality’ … but some models might be actually be useful.
All models must choose from a range of simplifying assumptions they can make. Unfortunately (in our view) by not highlighting the simplifying assumptions (and the effect these will have on the results) some pieces of analysis devalue themselves significantly!
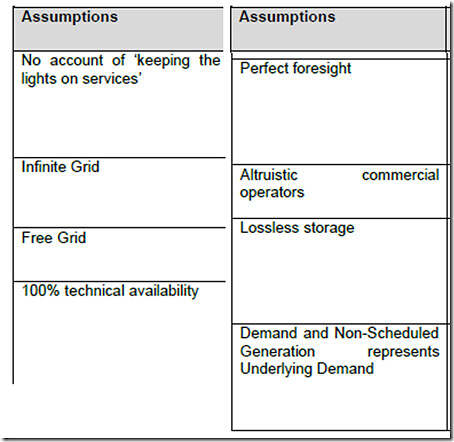
Given our strong view, we were very conscious in explicitly and clearly stating up-front the range of simplifying assumptions ad seen at the time, we were very keen to state clearly up-front the simplifying assumptions – including these ones:
Again, that caveat that you really should read Appendix 27 itself, as it is explained in some detail there!
With these assumptions in hand, we built a grid to supply the actual historical level of demand:
1) By scaling Wind Farms at all locations (depending on the scenario) to supply the required level of energy throughout the study period;
2) And then by scaling the Storage to store the overs and unders caused by the expected mismatch between instantaneous Wind Power Production and demand.
Sharing some results
Let’s briefly walk through some of the results …
Without allowing spillage, it’s a very expensive grid
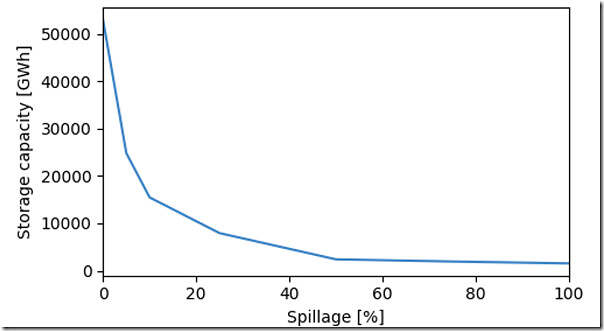
Of course, Spillage was the first item on the agenda to assess. As shown in the results chart here, if we assume the grid can’t spill any surplus wind (an unrealistic option) then we need an astonishingly large volume of storage to store all of the wind:
There’s clearly a trade-off in here with respect to construction cost (i.e. increasing wind and reducing storage with higher spillage) and system risk, but there’s a clear knee-point in the chart at about 20% spillage … below which is clear diminishing returns in terms of savings on overcapitalising storage costs.
Even with 20% spillage, it’s a large volume of storage (i.e. GWh) required
With that established, we then moved forwards on the assumption of 20% spillage. In terms of the level of energy stored in this theoretical reservoir, the trend over the 16 years provides evidence of some significant doldrum periods:
The ’wind drought’ of mid 2017 is clearly visible here … but it’s notable that there were 2 other significant ‘wind droughts’ evident in the (only!) ~15 year time range modelled. A key conclusion was that we’re really need to be analysing many decades of history for such an approach to have real credibility.
Whilst some years were quite small, in terms of ‘wind drought’, there was also visible a clear seasonal pattern.
The above shows GWh storage requirements of approximately ~9,500GWh – that we noted (with reference to topical storage projects):
1) Was the equivalent of ~70,000 units of the (original iteration of the) Hornsdale Power Reserve (at only 129MWh).
2) Was the equivalent of ~25 installations of Snowy 2.0 (which we saw having a reported storage capacity of 350GWh).
Unfortunately since that time we’ve seen these comparisons quoted without the underlying context that this is what would be required in a hypothetical grid that only has Wind Farms and Storage as its supply sources.
1) Hopefully posting this article here today will reduce the risk of that happening in future!
2) It should be clear to most reasoned analysts that both of the following are true:
(a) Incorporating more generation sources (like solar, for instance) will help to reduce the size of the storage required; but at the same time
(b) Notwithstanding the other criticisms of Snowy 2.0 (exploding capital cost, delays in delivery, market power and so on) it’s not credible to think that projects of that scale ‘won’t be required’ in a VRE-dominated grid in future.
3) It’s worth noting that energy stored in the form of gas (and/or liquid fuelled supply) could also help to reduce the volume of energy storage required to store VRE for the proverbial ‘rainy day’.
4) Finally, it’s also worth reiterating the concerns raised in Observation 5/22 in GenInsights21 about the rise of ‘Just in Time’ that are related to these VRE + Storage scenarios.
Wind supply in relation to demand
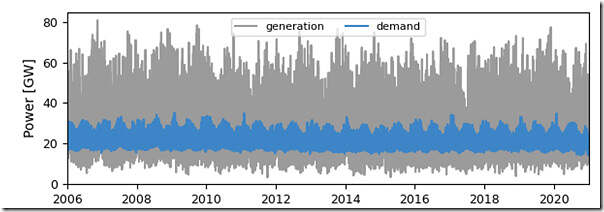
Back to our hypothetical grid, however, a next logical question is to look at the scale (in instantaneous GW terms) of wind production from this hypothetical grid in relation to the size of energy demand:
With this trend it should be clear to see that:
1) Peak production from Wind reaches ~80GW at times
(a) remembering this is in relation to an electricity demand peaking around ~30GW
(b) so a large degree of overbuild required … and that’s even before falling down the ‘hydrogen for export’ and/or ‘cables to Asia’ rabbit holes.
(c) a useful data point for comparison to other modelled scenarios such as in the AEMO’s Integrated System Plan, and models developed by others.
2) Keep in mind that this 80GW peak production is off the back of an installed wind capacity of above 100GW.
3) So that means a high point for capacity factor approaching quite high levels at times (not as high as 80% because the installed capacity base was over 100GW) … but down to well under 10% at other times.
… compare with these long-range stats for actual aggregated wind farm performance.
Unders and overs
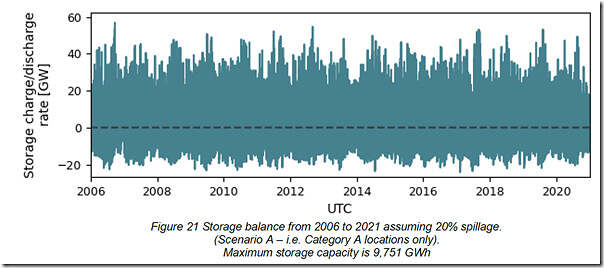
Combining both data series into the following long-range trend, we see the degree to which there would be charging (positive, above the line) and discharging (negative, below the line) from storage:
These data points (i.e. at least 60GW of charging ability) would combine with the storage required (of ~9,500GWh) to help guide the type of storage required in this theoretical grid.
Remember the caveat!
Again, that caveat that you really should read Appendix 27 itself, as it’s explained in much more detail over 28 pages there!



Some interesting analysis.
But worth emphasising that our existing hydro assets can dramatically reduce seasonal storage requirements.
A mostly wind & solar grid will have large deficits in winter (& large surpluses for Sept-Mar).
A lot of this winter deficit can be filled by existing hydro.
An average, NEM hydro discharges 1,500 GWh more in winter than summer. That immediately reduces seasonal storage requirements by that amount. But inflows are even more biased to winter, 6 TWh vs 2 TWh. So by simply restoring hydro discharge to be more seasonally similar to natural inflows, then we can reduce the winter deficit by 4 TWh.
During the years of the carbon tax, hydro discharged 6.5TWh more than inflows to take advantage of the temporary high prices, making it clear that our hydro assets are able to substantially shift generation from month to month & year to year to maximise profits.
Also worth mentioning that the Blowering & Hume reserviours at or near the bottom of the Snowy scheme largely decouple irrigation water requirements from Snowy hydro generation.