
It was the hottest day of the month in NSW on Thursday 29 February 2024. Demand levels stretched the grid and exceeded forecast expectations. Inner Sydney recorded 39.6 °C at Canterbury Racecourse and high dew point temperatures compounded the uncomfortable conditions.
There was a distinct and unusual jump in demand between 14:30 and 15:00. This article delves into the extent to which cloud impacts caused the jump.
Background
Days ahead of Thursday, the demand forecasts were already indicating high demand levels.
Lack of reserve conditions (at level 2) were consistently being projected with each new forecast run.
NSW ‘Market Demand’ peaked at 13,764MW (in the 16:35 dispatch interval). Yet it was 885MW below the all-time record (of 14,649MW – which occurred on 1st February 2011).
Nonetheless, the peak came as somewhat of a surprise as demand forecasts had projected lower demand in the lead-up on the day.
Preceding the peak, a jump in demand occurred in the half-hour to 15:00. To many market watchers in NSW the sight of higher than expected demand might have triggered additional sweating!
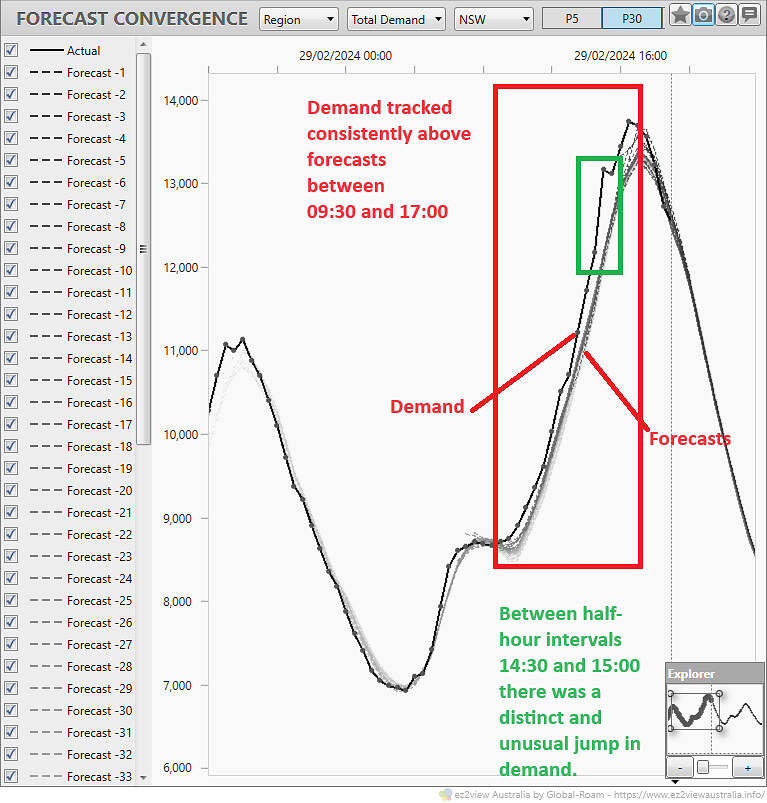
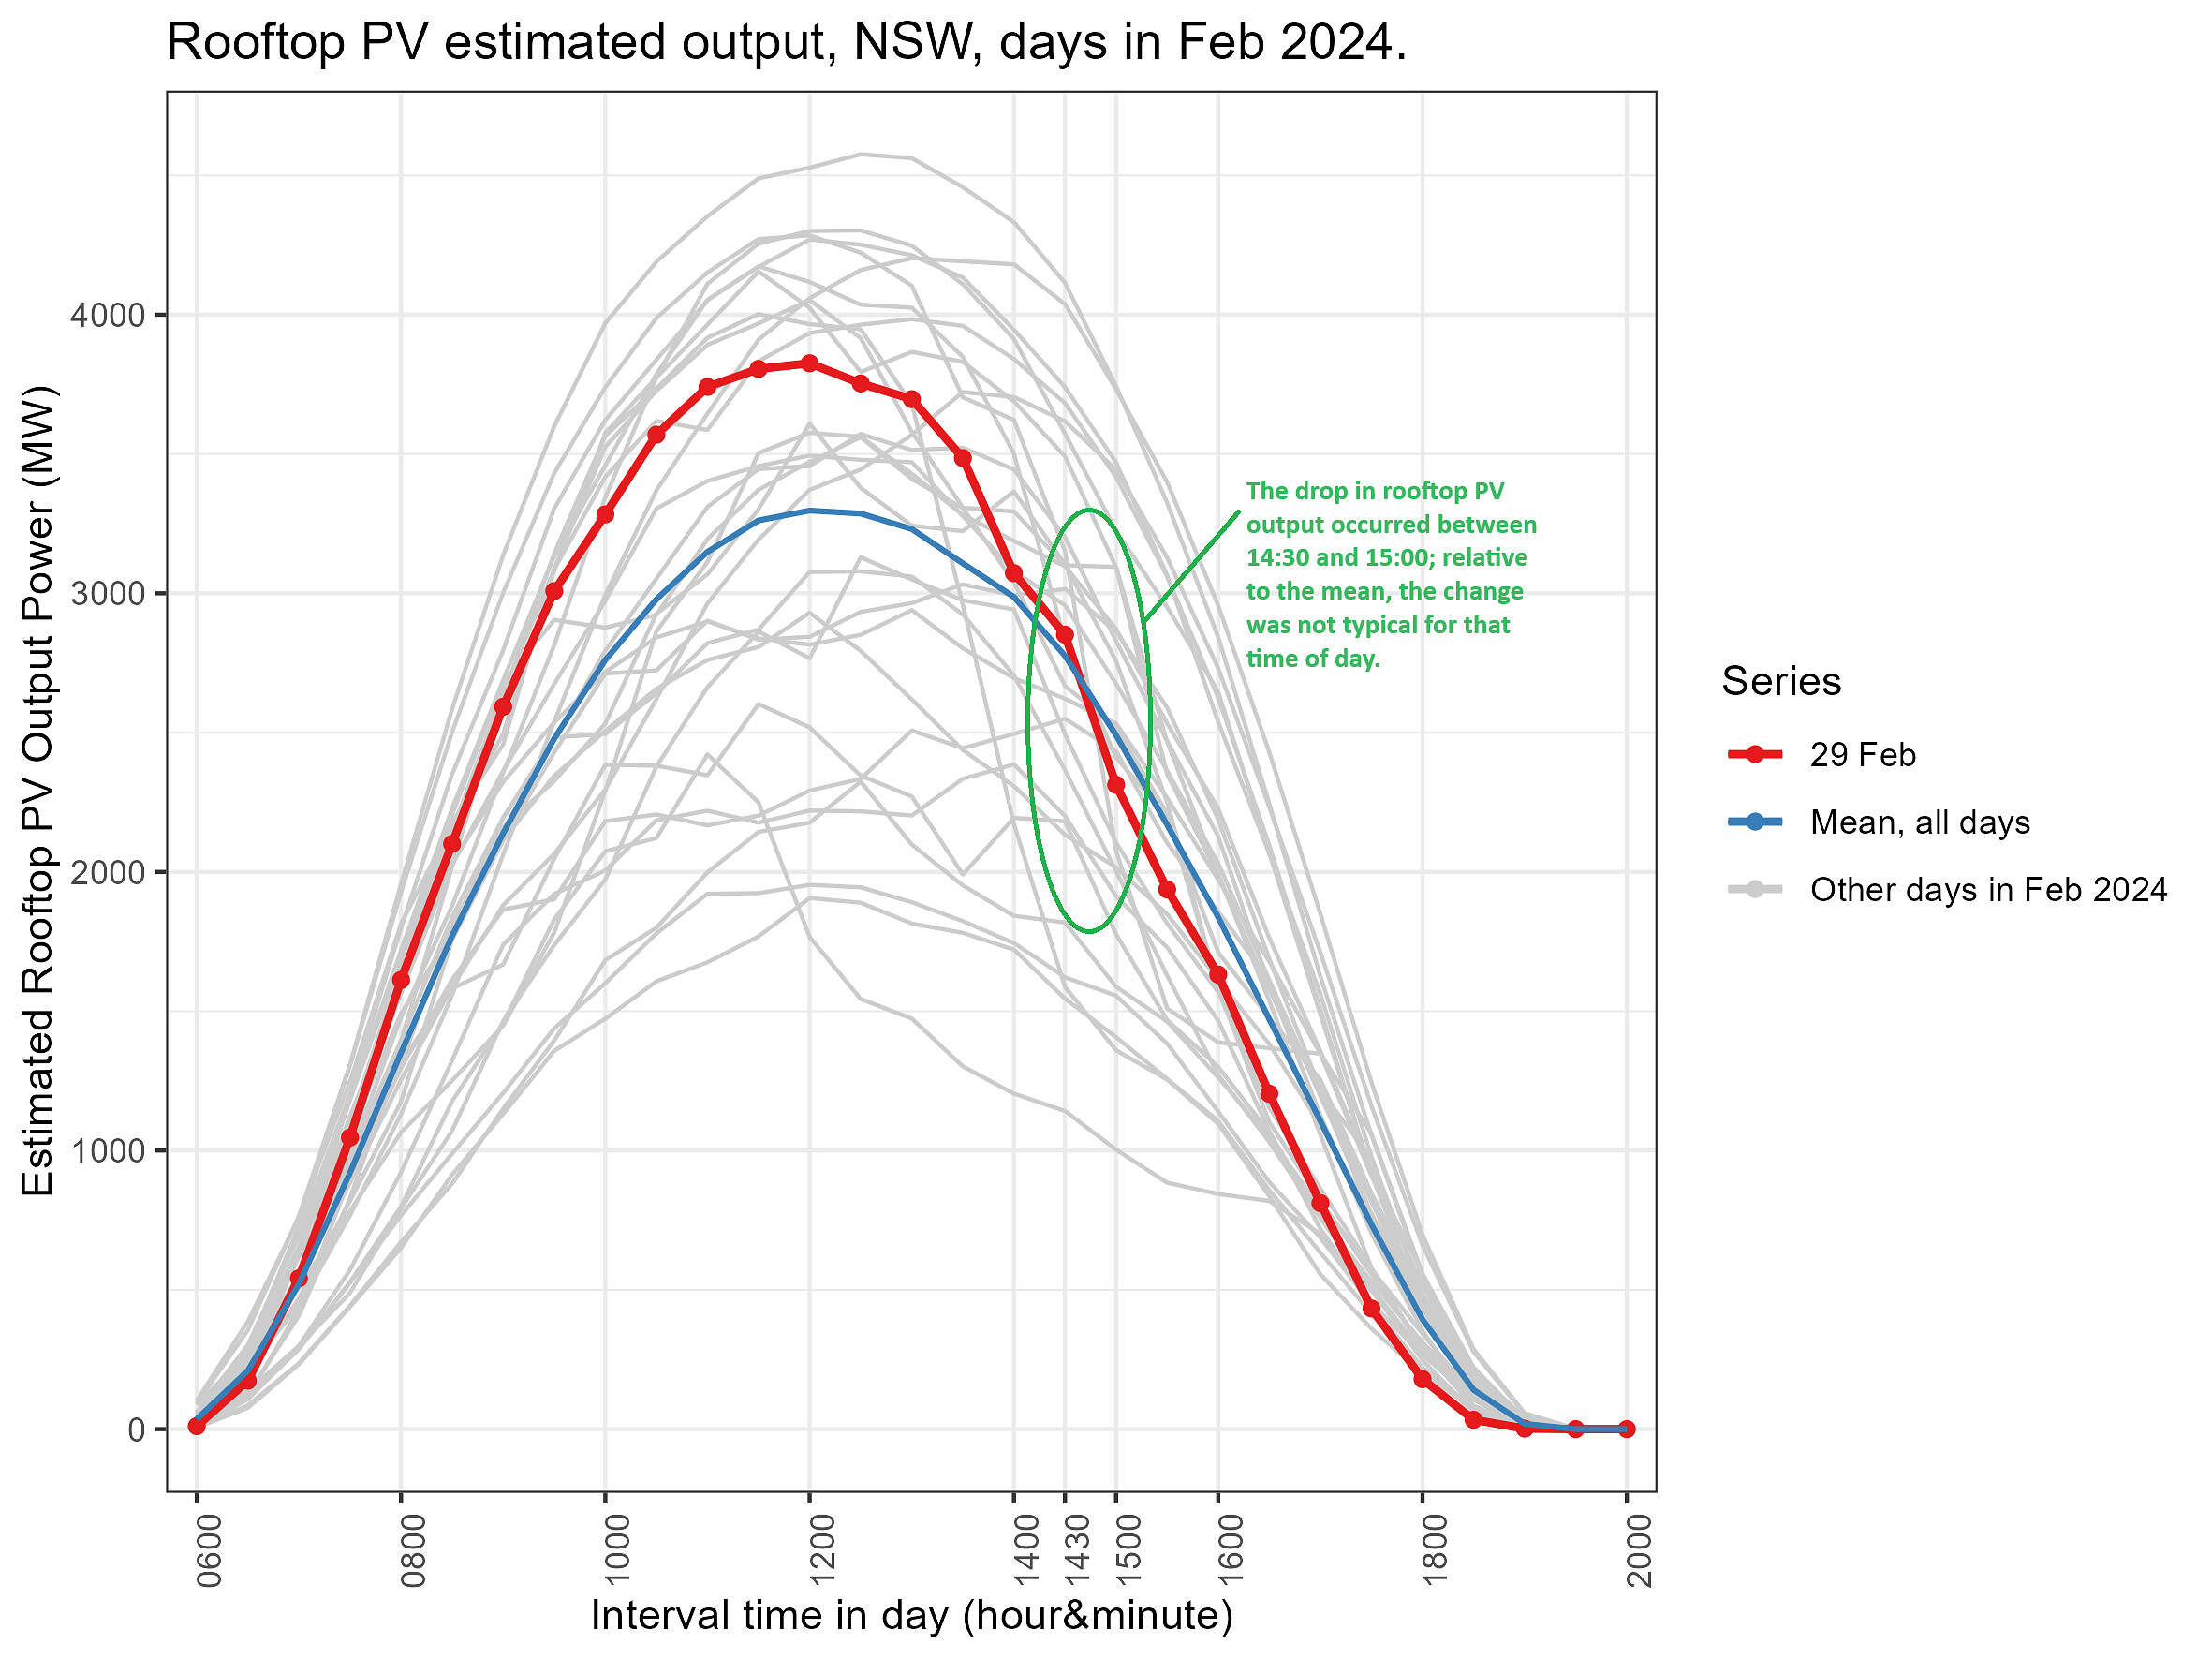
As indicated in the chart above, there was a distinct and unusual jump in demand between 14:30 and 15:00.
Déjà vu, hadn’t we seen this feature earlier?
It was on 22 February in VIC where we saw a similar demand feature.
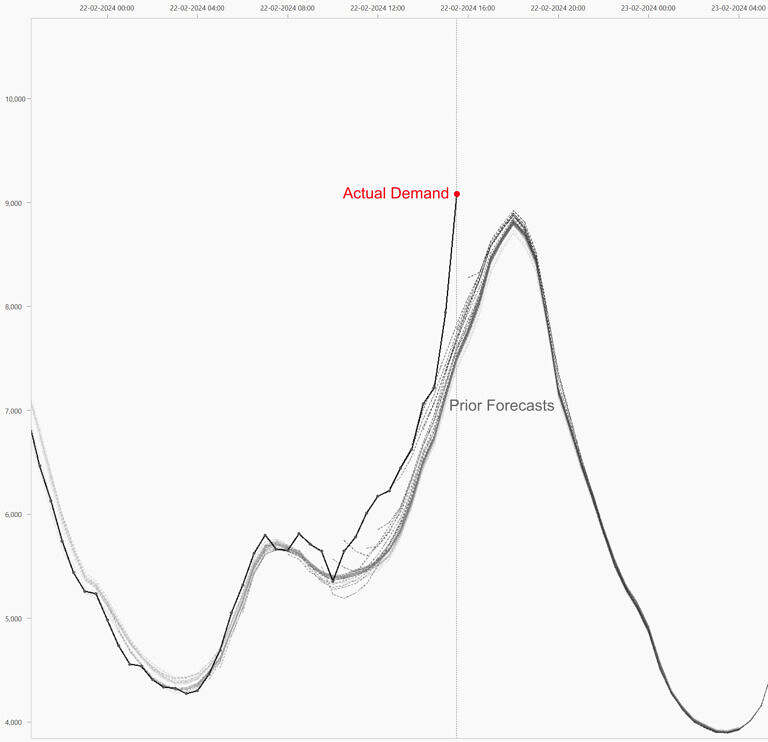
Market demand actuals were landing far above prior P30 forecasts in Victoria on 22nd February 2024 [WattClarity].
In this Victorian case, the jump in demand was attributed to the smoke (mixed with cloud) reducing the sunshine (solar irradiance) hitting solar panels.
The drop in output from rooftop PV (being the predominant style of PV in greater Melbourne) meant more energy needed to come from the grid, from market generators.
But there weren’t any smoke plumes that we are aware of that could have caused reduced rooftop PV in NSW on February 29.
Yet there was cloud cover.
In NSW on the 29th, the observed 30-minute jump in demand is verified in the 5-minute data
With a focus between 14:30 and 15:00. The key 5-minute interval appears to be 14:35.
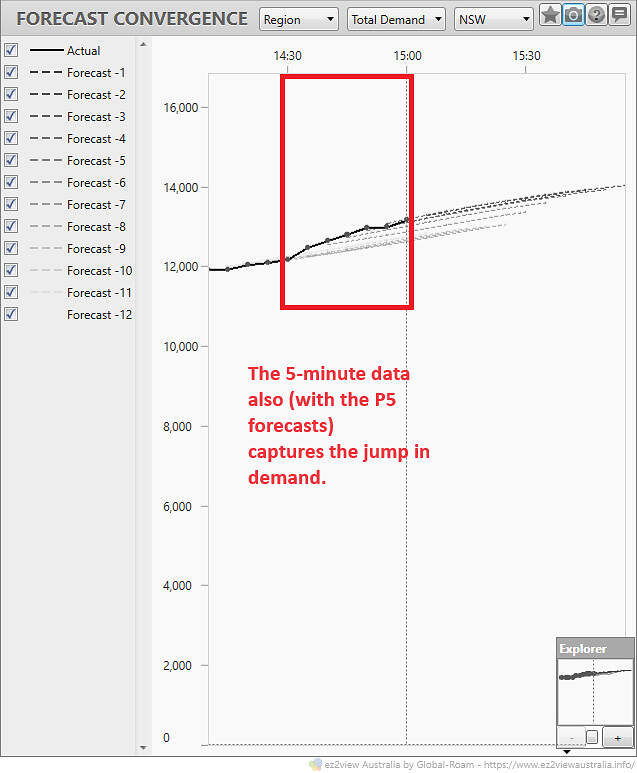
Further, AEMO’s operational forecasting systems make an educated estimate of actual rooftop PV. Although at 30-minute cadence, this dataset shows the dip at the same time period as the spike.
Did the Russ Christ Effect contribute?
The Russ Christ Effect can be described as cloud impacts on rooftop PV arriving before any associated cooling conditions.
It was Professor Paul Simshauser’s (CEO Powerlink Queensland) presentation at the Queensland Energy Club on Wednesday 16th February 2022, where he brought this to our attention and referred to it as the “Russ Christ effect”. We first referred to this in the WattClarity article looking at Queensland’s heatwave week in 2022.
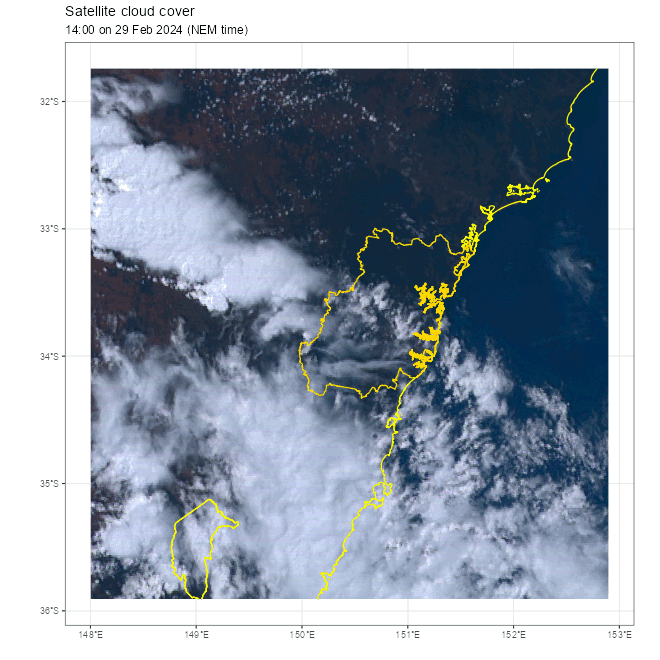
To consider this, we’ve captured a series of satellite images for the period between 14:00 and 14:50. The key period we are interested in is between 14:30 and 14:40 because it was at 14:35 when the jump in 5-minute demand was most pronounced.
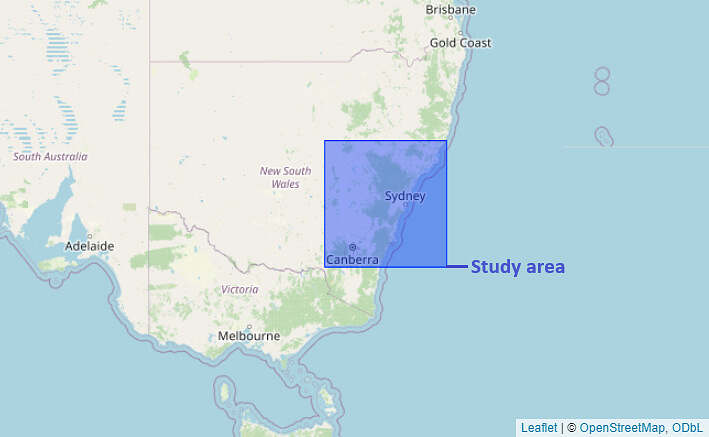
The area captured focuses on Greater Sydney (boundary drawn) and extends:
- To Canberra in the south (boundary drawn),
- Dubbo in the north-west corner,
- Taree in the north along the coastline (coastlines drawn), and
- Includes Greater Sydney in the middle (boundary also drawn).
Observations and Context
Sun position
At this time of day (14:30 UTC+10) in February:
- If you were standing in Penrith (suburb west of Sydney) it would be about 48 degrees (roughly halfway to vertical) above the horizon, and gradually lowering.
- The sun (azimuth) would be positioned towards the west-north-west (30 degrees northwards of west), gradually moving further around to the west as it sets.
- This means shadows would be projected from clouds in the west and northwest.
General weather situation
The title of WeatherZone’s article, from the last day in February in NSW, says it all: A “Sweaty, stormy end to Sydney’s third hottest summer on record”. The article goes on to note that there was a lot more atmospheric moisture than usual in summer 2023-24. This helped produce rain and storms including the storms in and around Sydney on the final day of the season.
Cloud movement
From the satellite sequence (source Himawari) :
- 14:00
- We see a large patch of cloud in the west and north west of Greater Sydney.
- As time progresses this moves towards the north east.
- 14:10
- Within Greater Sydney the northern portion is cloud-free.
- There are some small clusters of cloud and wispy types (cirrus?) in the south.
- 14:30
- The large patch of cloud had moved northward. This would have started to cast shadow on western parts of Greater Sydney.
- Two small but pronounced cloud systems had appeared indicating thunderstorms were emerging.
- The southern one appeared to be over Badgerys Creek.
- The northern one appears to be over Maroota.
- 14:40
- The two thunderstorms had increased in size.
- The large patch of cloud out side Greater Sydney was aligned at 30 degrees (north of west) with Sydney.
- It had broadened in area.
- It’s position meant the cloud had moved directly into the path of sunshine towards Sydney.
It seems the north-west cloud band that had started outside of Greater Sydney in the west, had moved northward into the sun’s path for most of Sydney by 13:40.
Depending on the cloud elevation, its shadow would have extended into Greater Sydney even though the cloud itself hadn’t materially crossed the Greater Sydney boundary.
Two thunderstorms that emerged around the same time would have helped reduce solar irradiances.
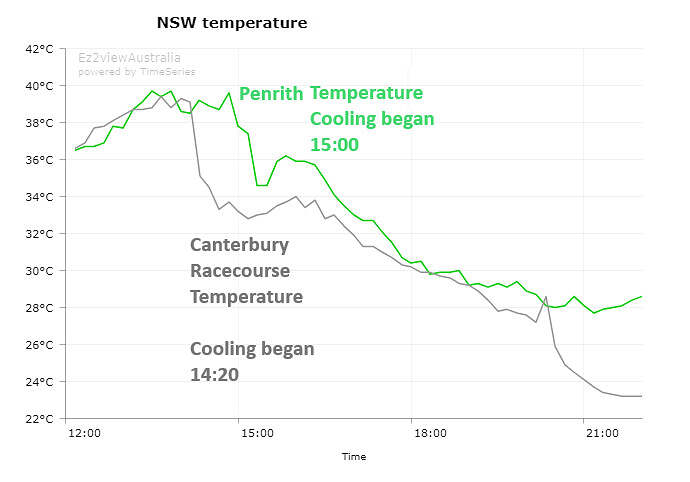
Temperatures
The Russ Christ Effect requires the shadows to emerge before the cooling.
If we inspect temperatures at Penrith (west of Sydney) and Canterbury Racecourse (inner Sydney) we can see how the cool change took longer to reach Penrith.
Conclusions
While we haven’t had time to cover every geographical corner of the region nor the full suite of atmospheric aspects of the day, we have uncovered many indicators pointing towards another example of the Russ Christ Effect.
To recap
- The spike in demand (market demand aka ‘total demand’) is primarily attributed to a drop in rooftop PV.
- There was indeed a drop in rooftop PV over the same time period.
- A large cloud band had moved into the line of the sun, and coincided with the time when rooftop PV output declined.
- At the time of the drop in rooftop PV, cooling effects of the weather system had not yet reached key areas of Greater Sydney that would likely have been shaded by the cloud band.
- Yet, two thunderstorms that emerged around the same time would have contributed to reduced solar irradiances and rooftop PV.
Further
Additional articles about this day are collated under the Watt Clarity topic 2024-02-29 NSW tight supply demand.
Be the first to comment on "Cloud impacts on demand, a review of NSW on 29 February 2024"