Back on Monday 13th November 2023 we wrote about ‘Forecast low System Strength of concern in NSW for Tuesday 14th November 2023 … first time ever?’.
We confirmed with AEMO later that this was indeed the first time ever for this type of concern in NSW … but a sign of what’s to come as coal units continue to exit the NEM (with the potential closure of Eraring in under 18 months the next cab off the rank).
This day was one of 92 days in Q4 2023, and so was covered in some detail in the recently released GenInsights Quarterly Update for 2023 Q4. In particular, in Appendix 1 within this report, along with other Heatbeat Indicators, we track the level of Inertia in all regions of the grid.
… it was on 20th July 2023 that Jon Dyson wrote ‘Let’s talk about inertia’, and this is one way in which we* are helping to facilitate that conversation.
* noting again that this was a collaborative effort between some of us at Global-Roam Pty Ltd (the producers of WattClarity) and the analytical team at Greenview Strategic Consulting.
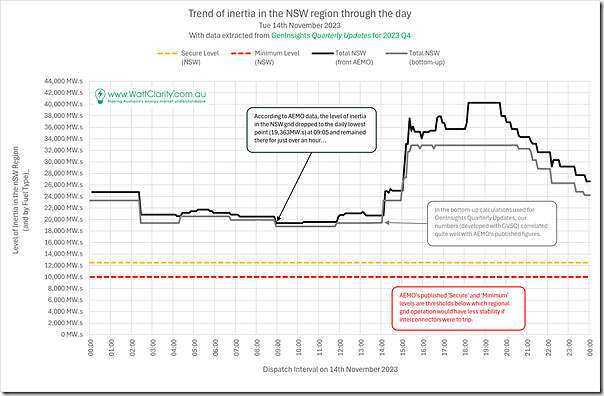
Level of inertia in the NSW grid on Tue 14th November 2023
So with concerns flagged by AEMO about low level of System Strength in the NSW grid leading into that day, let’s take a look at what actually unfolded on the day (with data extracted from the recently released GenInsights 2023 Q4):
Starting simple, on this chart are 4 trends through the day, all to do with Inertia in the NSW region of the NEM:
1) There’s two trends (black and grey) for the ‘actual’ level of inertia:
(a) The black line shows the AEMO’s calculated level, which they have been publishing for a number of months now (Jon’s article spoke about this).
(b) The grey line shows a bottom-up calculation that is performed for the recently released GenInsights 2023 Q4 to calculate based on the units in service, and their inertia parameters.
2) There’s also two alert-colour trends from the AEMO, being their ‘Secure’ and ‘Minimum’ threshold levels that they aim to steer the grid to stay above (because if they fell under, the AEMO and TNSP modelling shows the grid would be much less stable in the event of an interconnector trip or other such disruption).
Hence in this chart through the day, we see that at all points it’s above the AEMO’s ‘Secure’ level (which is what we want to see), and that it drops to its lowest level at 09:05, remaining there for a little over an hour. The timing of minimum inertia is not a surprise in an environment where rooftop PV is eating away at grid demand, and hence supply from large scheduled units that are supplying inertia ‘free’ as a bundled part of the energy they supply.
Lowest point, from 09:05 on Tue 14th November 2024
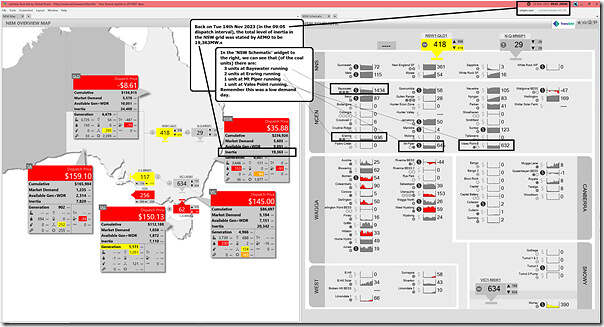
Opening up ez2view at the 09:05 dispatch interval (NEM time) on Tue 14th November 2023, we use the ‘NEM Map’ and ‘NSW Schematic’ widgets to have a look at what was happening across the NEM, and particularly in the NSW region, at this point in time:
We see that:
1) the level of inertia in the NSW region was 13,191 MW.s (remember that inertia is measured in ‘megawatt-seconds’).
2) we also see that, of the coal units:
(a) Bayswater has three units running;
(b) Eraring has two units running;
(c) Mt Piper has one unit running; and
(d) Vales Point has one unit running.
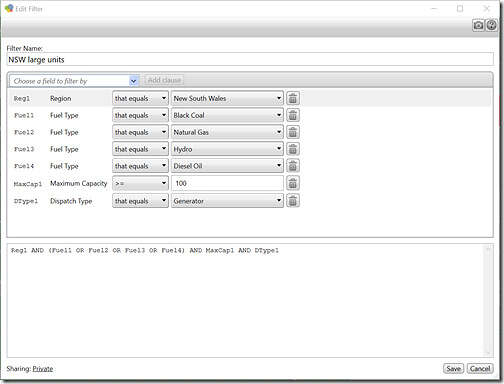
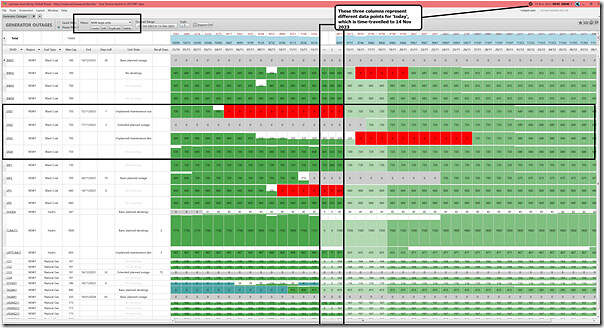
In order to understand more about what was offline and why on the day, I opened the ‘Generator Outages’ widget from ez2view at the same time-travelled point in time (i.e. the 09:05 dispatch interval NEM time on Tue 14th November 2023), and filtered down to ‘big NSW units’ using this filter:
… and here’s the view:
Of the units that are offline, then, we see that:
1) Bayswater 1 was off for a Planned Outage.
2) Eraring 1 was off for a Forced Outage … planned to come back in the next day or so.
3) Eraring 2 was off for a Planned Outage.
4) Mt Piper 2 was off for a Planned Outage.
5) Vales Point 5 was of for a Forced Outage.
With this in mind, let’s move on further…
Contributions from the plant mix in NSW
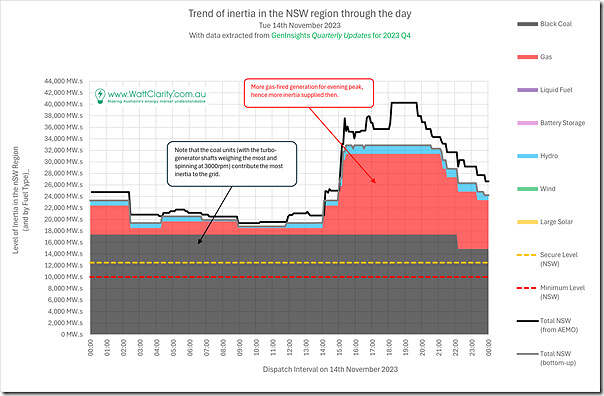
In this chart we’ve added in the calculated level of contribution from all the units operational in NSW through the day:
It’s clear to see that:
1) the coal units (operating through the day, except for one unit coming off around 21:00 that day) were supplying the bulk of the inertia, particularly during the low demand periods in the middle of the day;
2) Gas generators supplied most of the additional inertia required for the evening peak
What would the effect have been, without Eraring on the day?
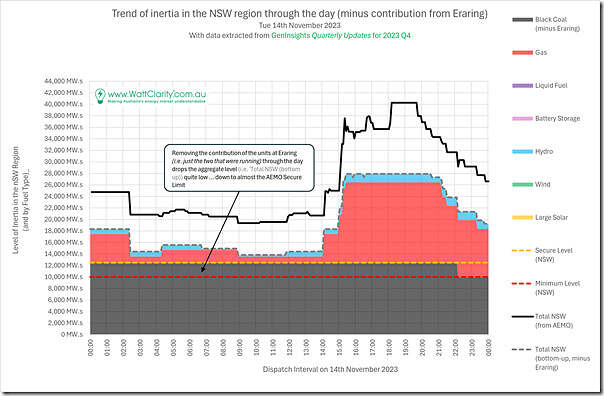
It’s logical to wonder, then, what the effect on inertia would have been had the two Eraring units not been present through the day … so subtracting their contribution, this is what we see:
Clearly the aggregate contribution level (dotted grey line) is now much closer to the AEMO’s ‘Secure’ threshold during the middle of the day.
Keep in mind that the energy not supplied by the two Eraring units would need to be supplied by something else in this hypothetical case study …
Question 1) what if we removed these 2 x Eraring units?
As the second last piece in this article, it’s worth readers thinking through what the inertia contribution would have been from the replacement capacity being touted as the means to allow for the retirement of Eraring in under 18 months time?
How many of these modelling exercises that purport to show that we can safely close Eraring even give some consideration to this ‘keeping the lights on service’?
Question 2) what if we removed all 4 x Eraring units?
Now assume that all four Eraring units were running through this period (and perhaps other coal units at Bayswater, Mt Piper and Vales Point were off on outage). It should be obvious that the Eraring station would be supplying even more (in percentage terms) of the inertia that the NSW grid relies upon to continue being a stable platform to support an essential service, and a highly capital intensive and volatile energy market.
What would the situation have been then if they were to be removed, and where would the replacement inertia be supplied from?
The reason for these questions is not to throw up barriers to the energy transition.
It’s clear to us that one of the biggest threats to the energy transition is simplistic thinking and a ‘she’ll be right mate’ attitude that is likely to come a cropper at that point – leading to a political backlash that will put the transition back a decade or more.
We all* need to do better …
* ourselves at Global-Roam Pty Ltd included … which is why we’re relentlessly trying to be better each day than how we were the day before.


No-one actually knows what the safe level of inertia is, but in an inverter based system with distributed hierarchical control, the safe level may well be 1/10th or less of what traditional systems considered necessary. Inertia is actually an instantaneous but very small energy store. Inertia does nothing unless there is a frequency change. If there is a frequency change of say 0.3Hz, the same as occurred when LYA tripped, the energy available to stabilise the NSW grid is (1-(49.7/50^2)x I = 1.1% of the inertia.
When inertia is 20,000 MW.s, that is 239 MWs available. If the frequency change happened over 3 seconds the available power is about 80 MW. i.e. a 100 MW battery could provide similar fast frequency services as 20,000 MWs of physical inertia.
A key question is how to ensure all batteries don’t inject 80% of their available power at the same time otherwise there would be serious overshoot and potentially cascading instability. This is not a risk with physical inertia, but on the other hand batteries can arrest a far larger frequency excursion than physical inertia can.
In addition there is synthetic or virtual inertia on wind and solar farms which is also potentially significantly larger and more controllable than synchronous inertialarger
Great article! I see batteries are not providing intertia before an event however the FFR would provide a level of effective inertia. The question is how AEMO plans to consider this.