
Twelve months on from a NEM-wide market suspension where prices skyrocketed to an unprecedented level, it’s worth checking back in to see how this year’s Q2 compared. More importantly, it’s worth examining how this year compares to previous years so that we can understand the longer-term trend of price outcomes.
Dating back to 2016, we have been tracking Q2 prices with an almost-annual article here on WattClarity. But with Paul diligently working on our far more detailed GenInsights Quarterly Update for Q2 this week, I thought I would take over the duties this time around.
Region-by-Region Summary Stats and Duration Curves
Below we will look at the summary stats (max, min, and time-weighted average) for each region to demonstrate the long-term trends within regional prices (for ENERGY only, i.e. no examination of FCAS). We will also see duration curves for each region so that we can examine the distribution of price incidences.
Queensland
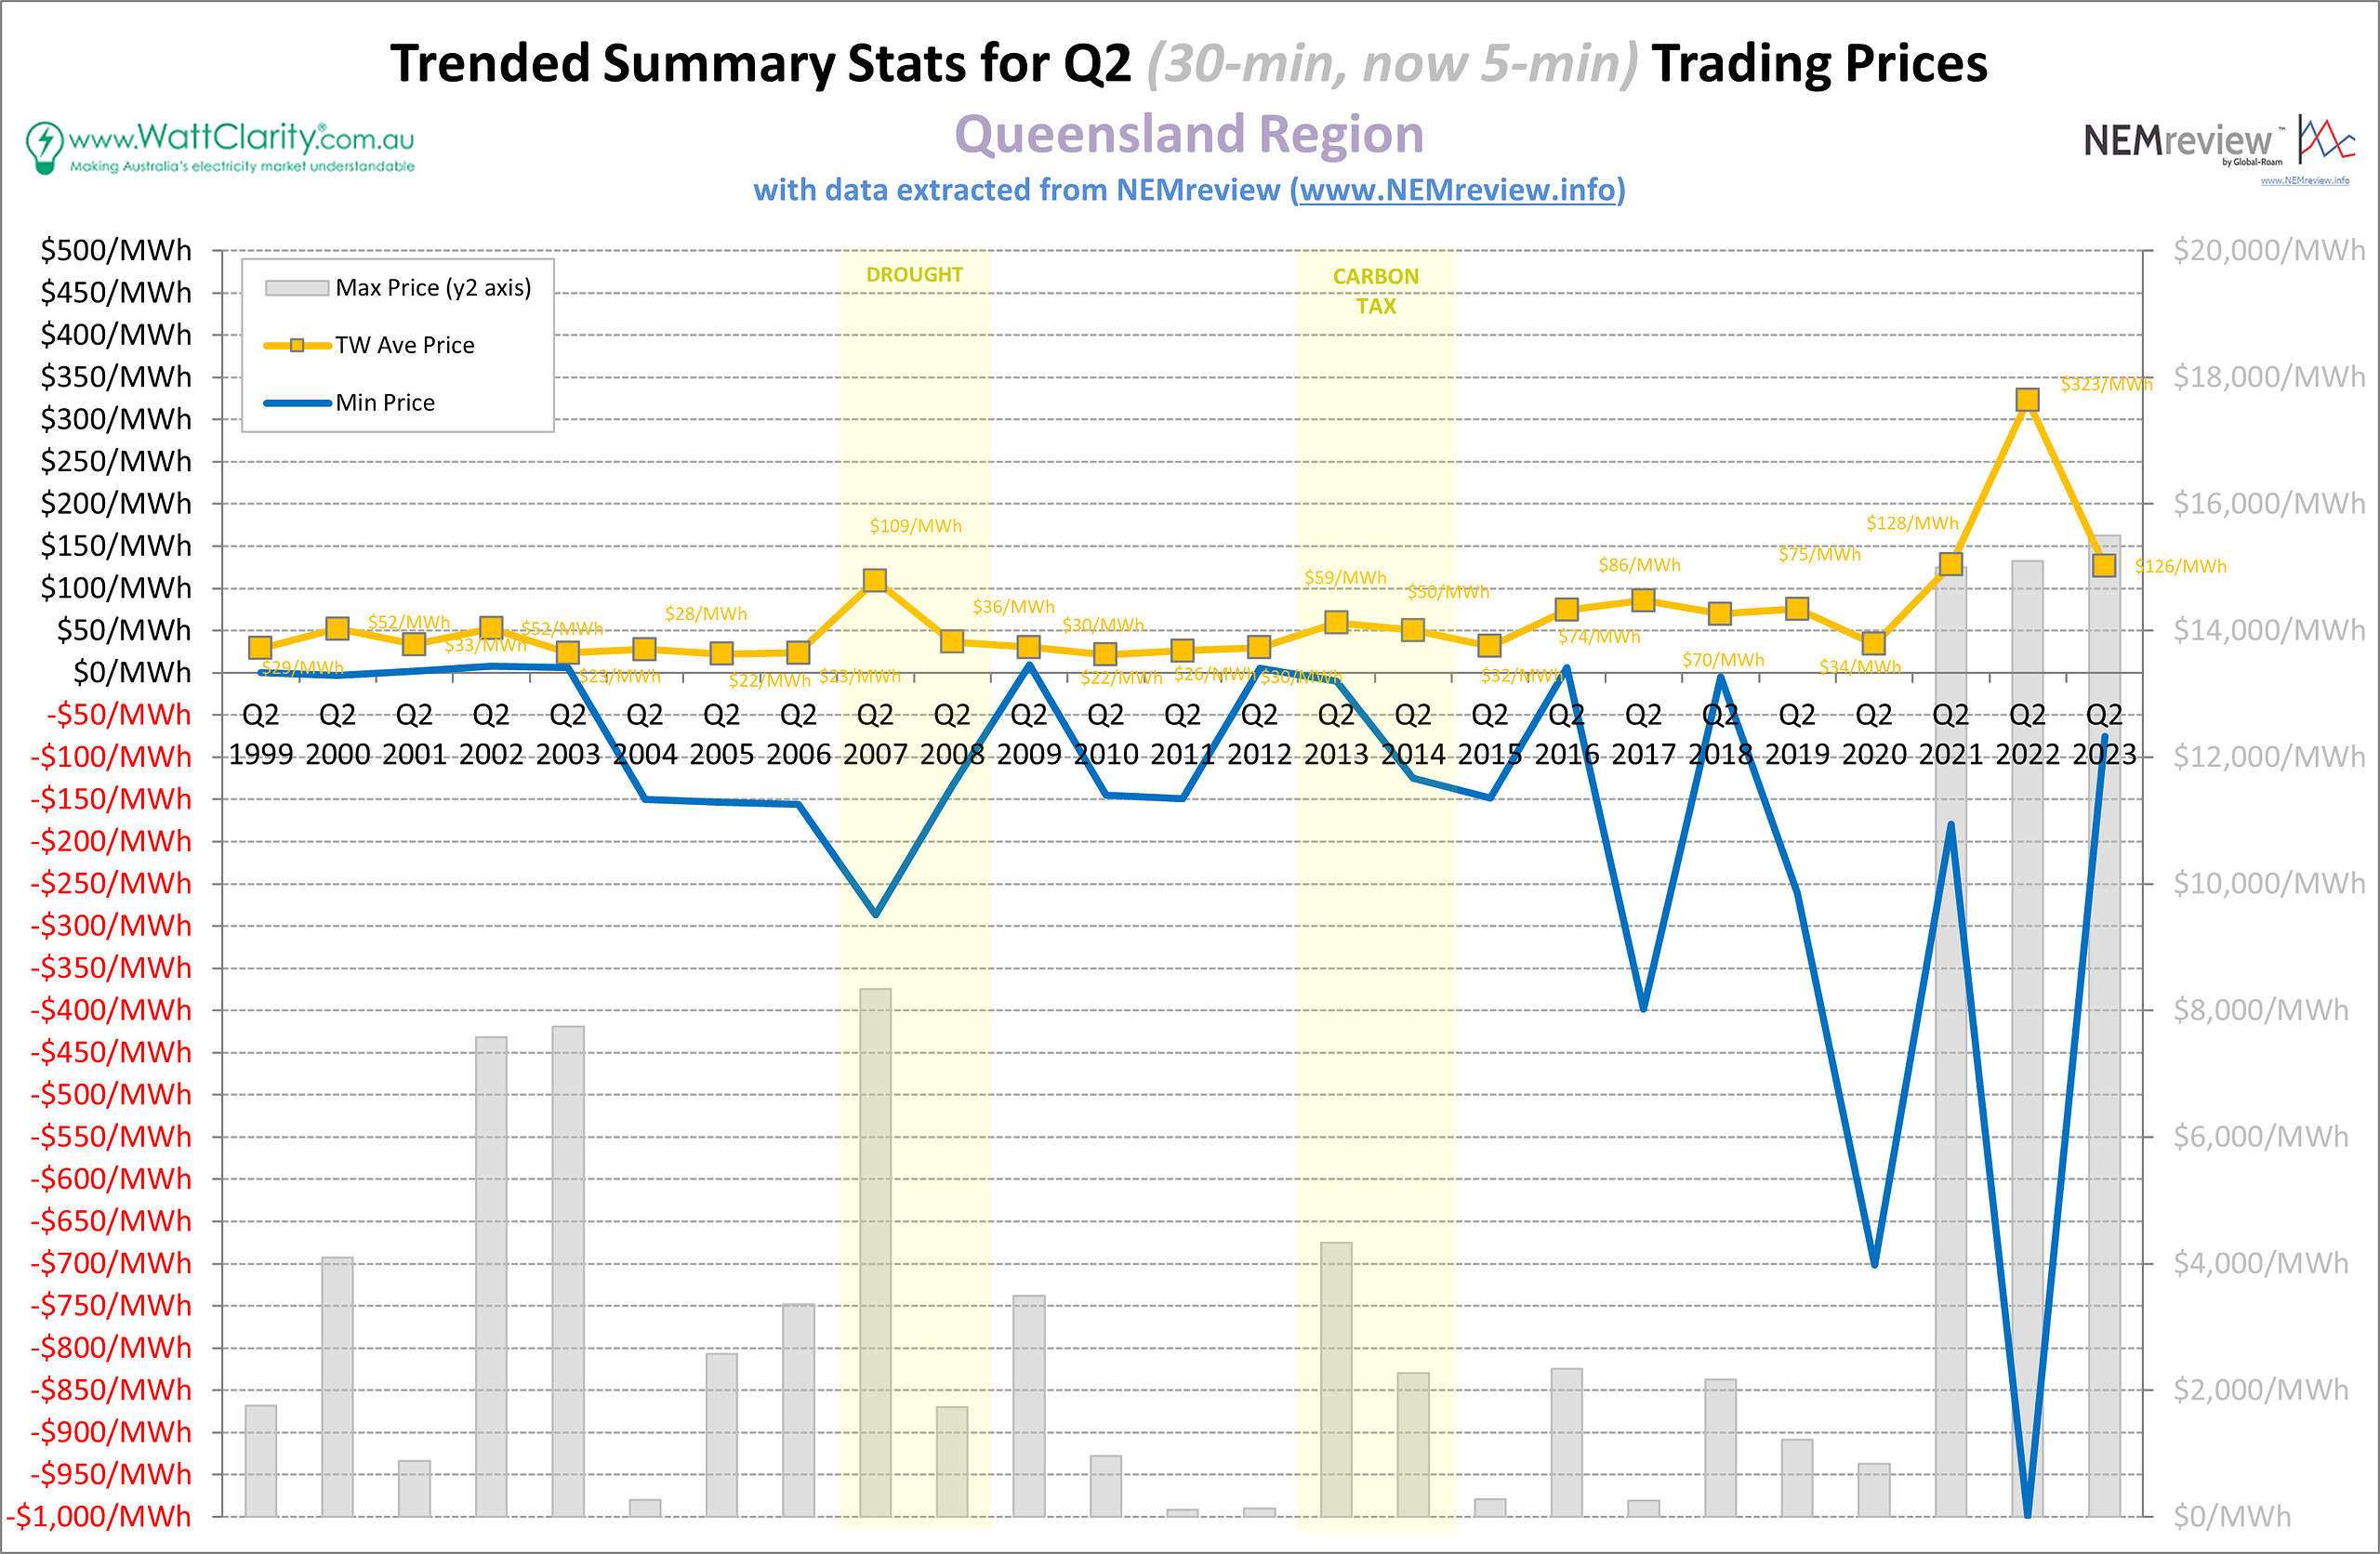
Trended Summary Stats for Q2 Prices in QLD
Source: NEMreview
In QLD, we can see that the average price for the quarter was $126/MWh, a similar level to 2021 – but significantly down from last year’s extreme prices. Whilst 2022 might not be a good reference year, it’s worth noting that Q2 2021 also contained an extreme pricing event in the region when the Callide C explosion affected energy prices in late May of that year.
Even if we ignore last year’s second quarter, the long-term trend for the (time-weighted) average price in the region is increasing. Additionally, we can also see that the price floor was not touched in the region this past quarter. From the duration curve below, we can see a sharp slope in incidences of prices between the $100-$200/MWh mark.
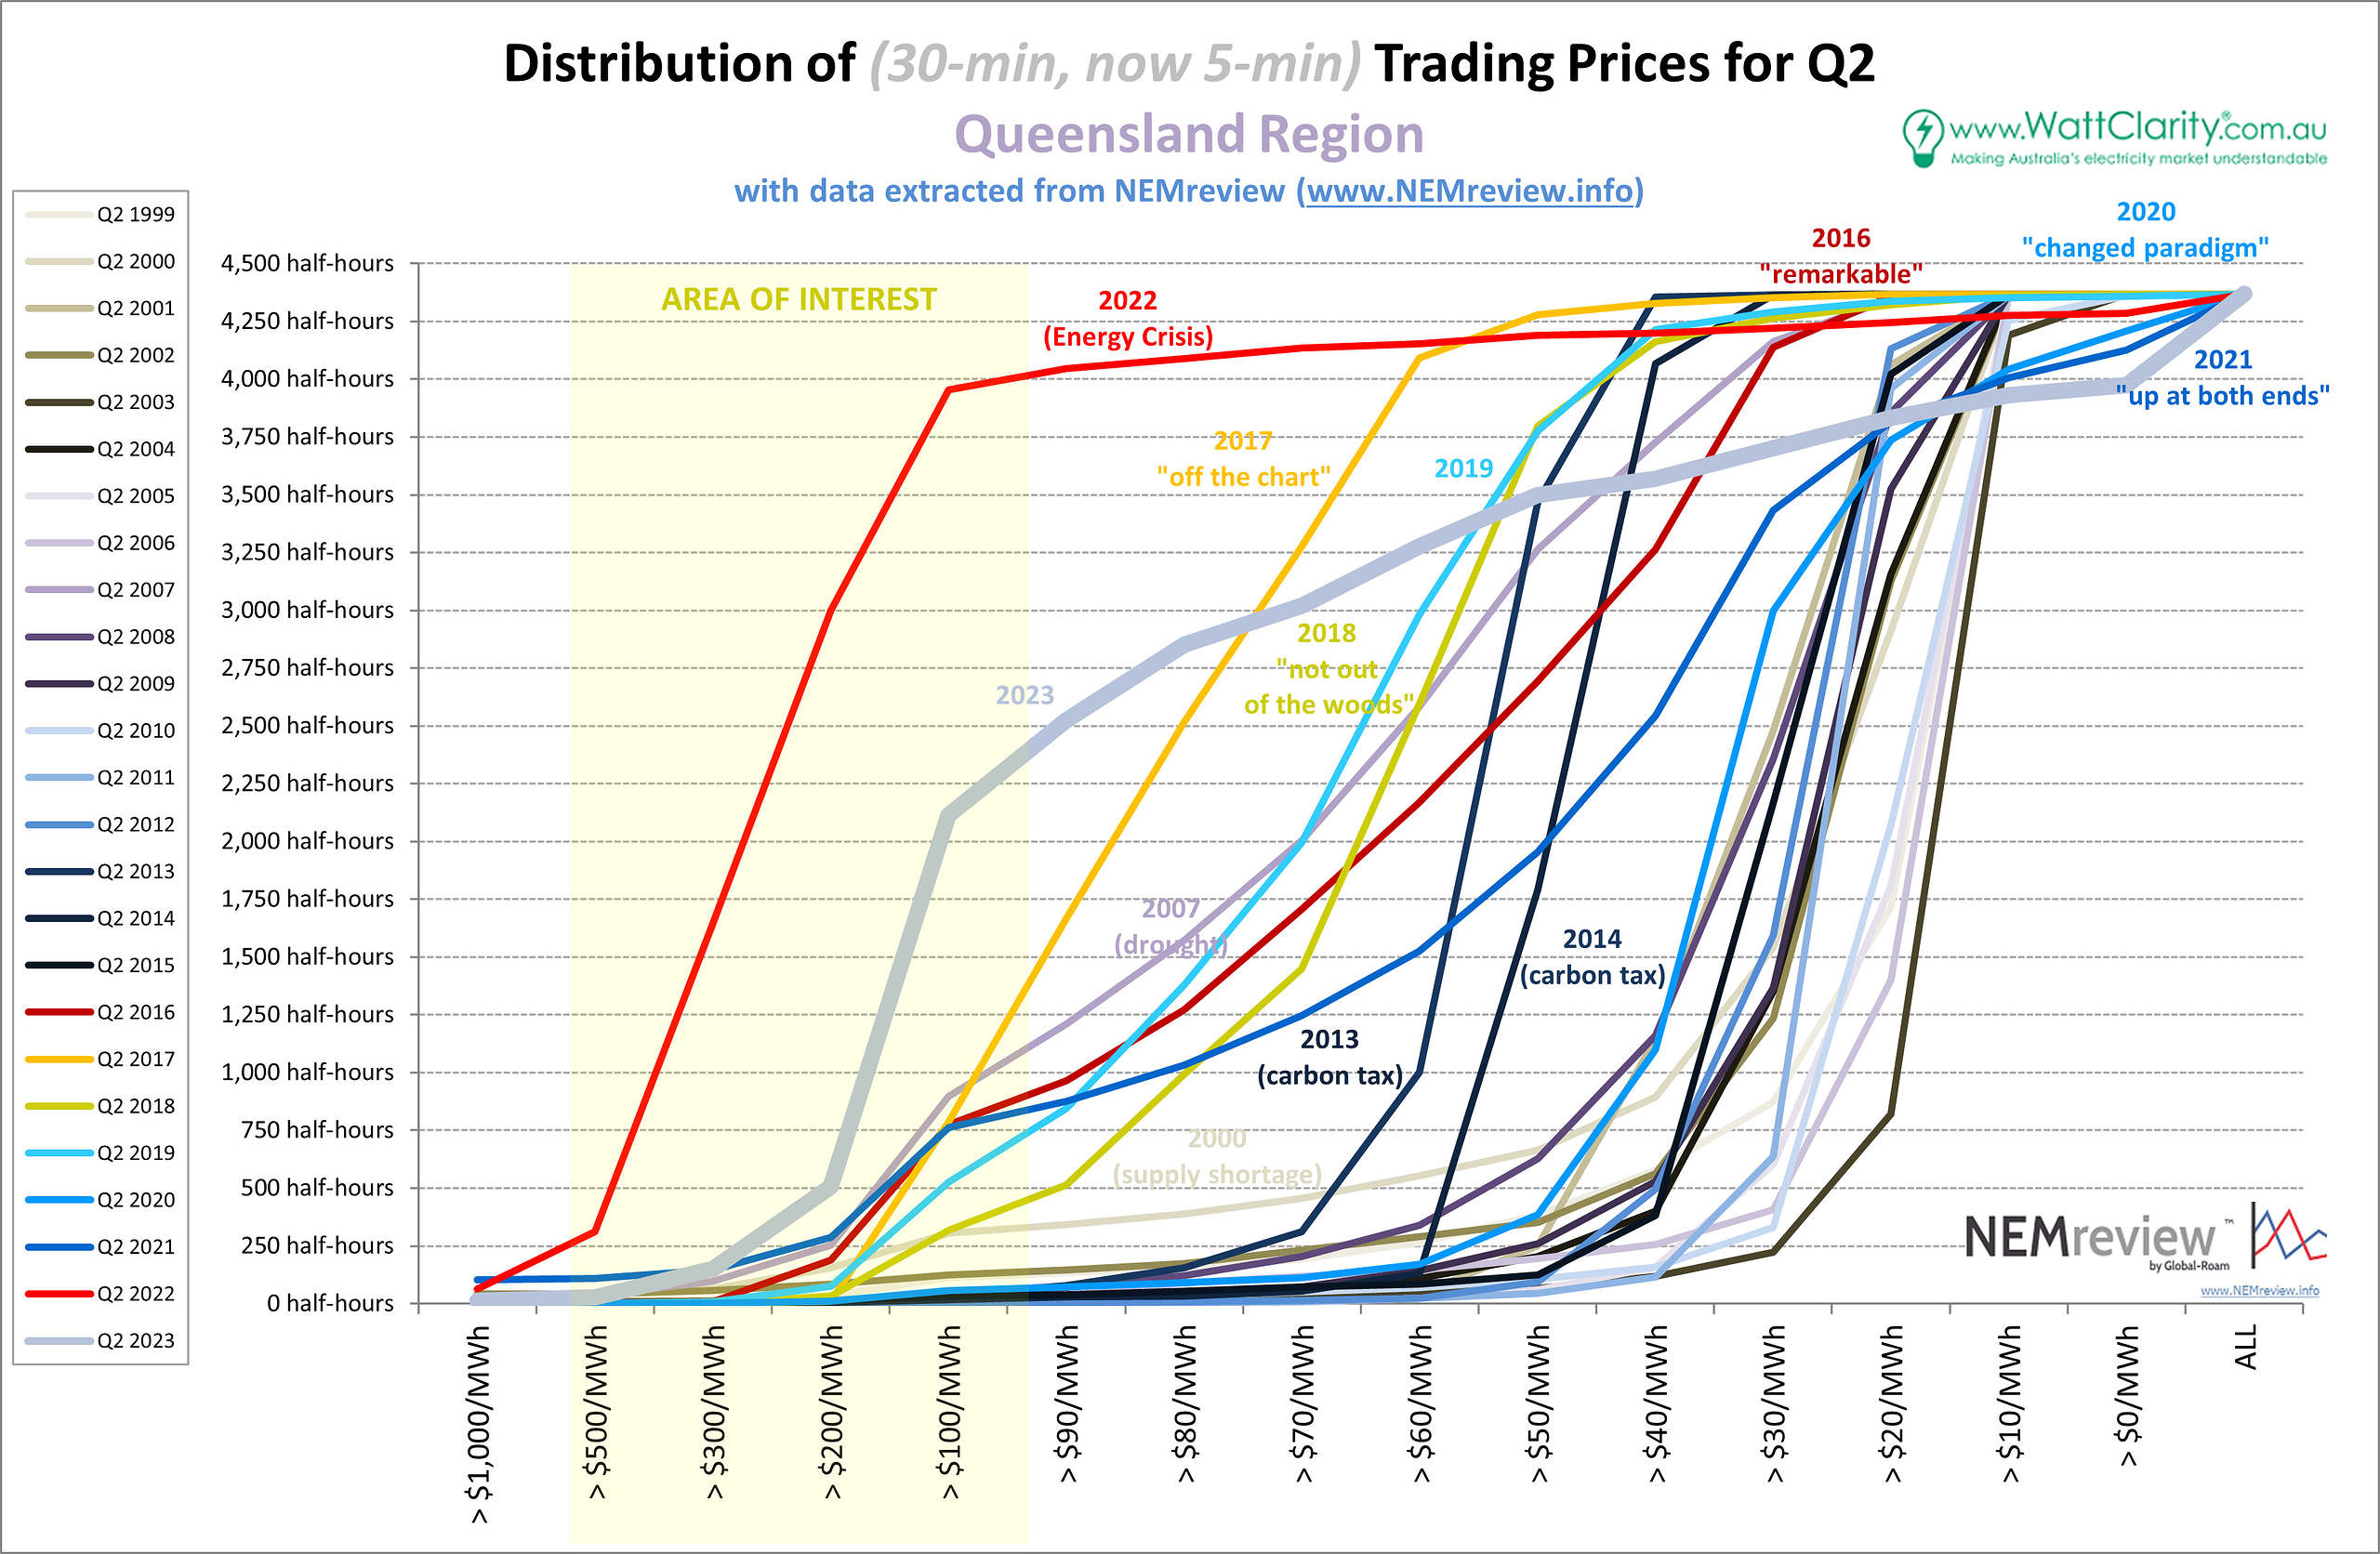
Duration Curve showing the distribution of Q2 Prices in QLD
Source: NEMreview
New South Wales
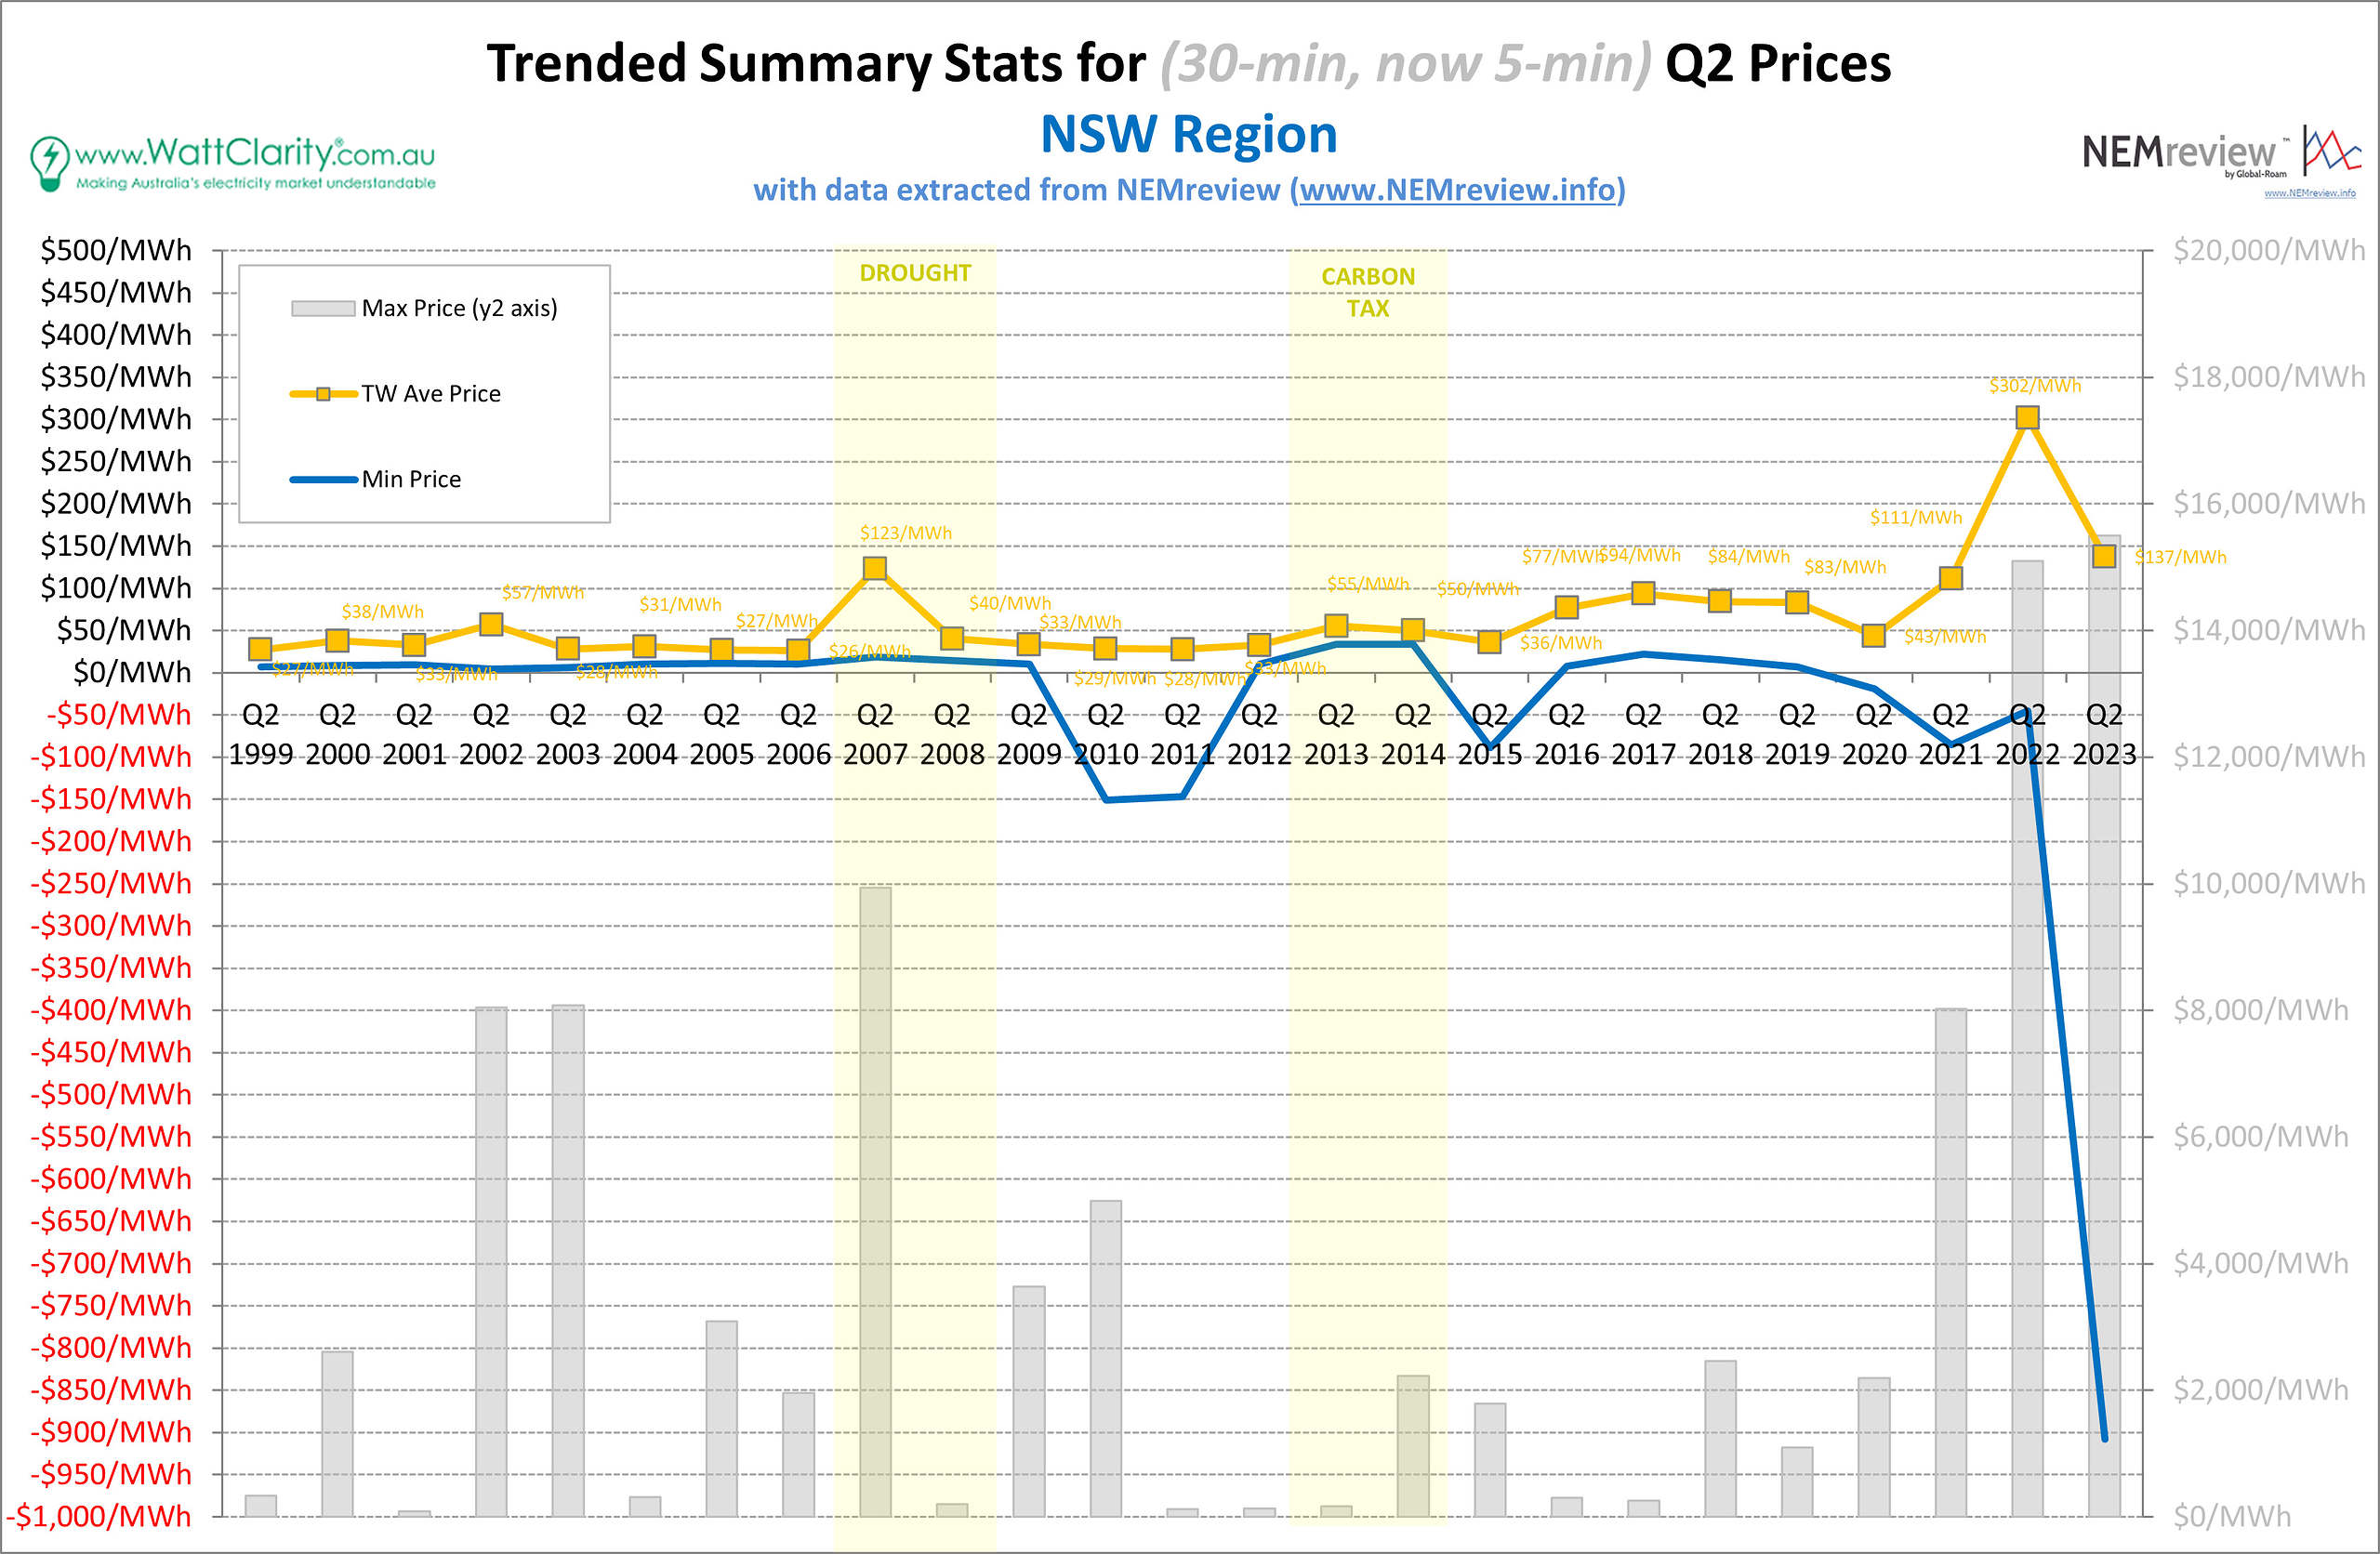
Trended Summary Stats for Q2 Prices in NSW
Source: NEMreview
The average price in NSW was $137/MWh this quarter. This continues the underlying long-term trend of increasing average prices – as this year showed the second most expensive Q2 on record, on a time-weighted basis. The duration curve for this past quarter in NSW (shown below) shapes out similarly to QLD, with a notable slope of incidences of prices around $100-200/MWh.
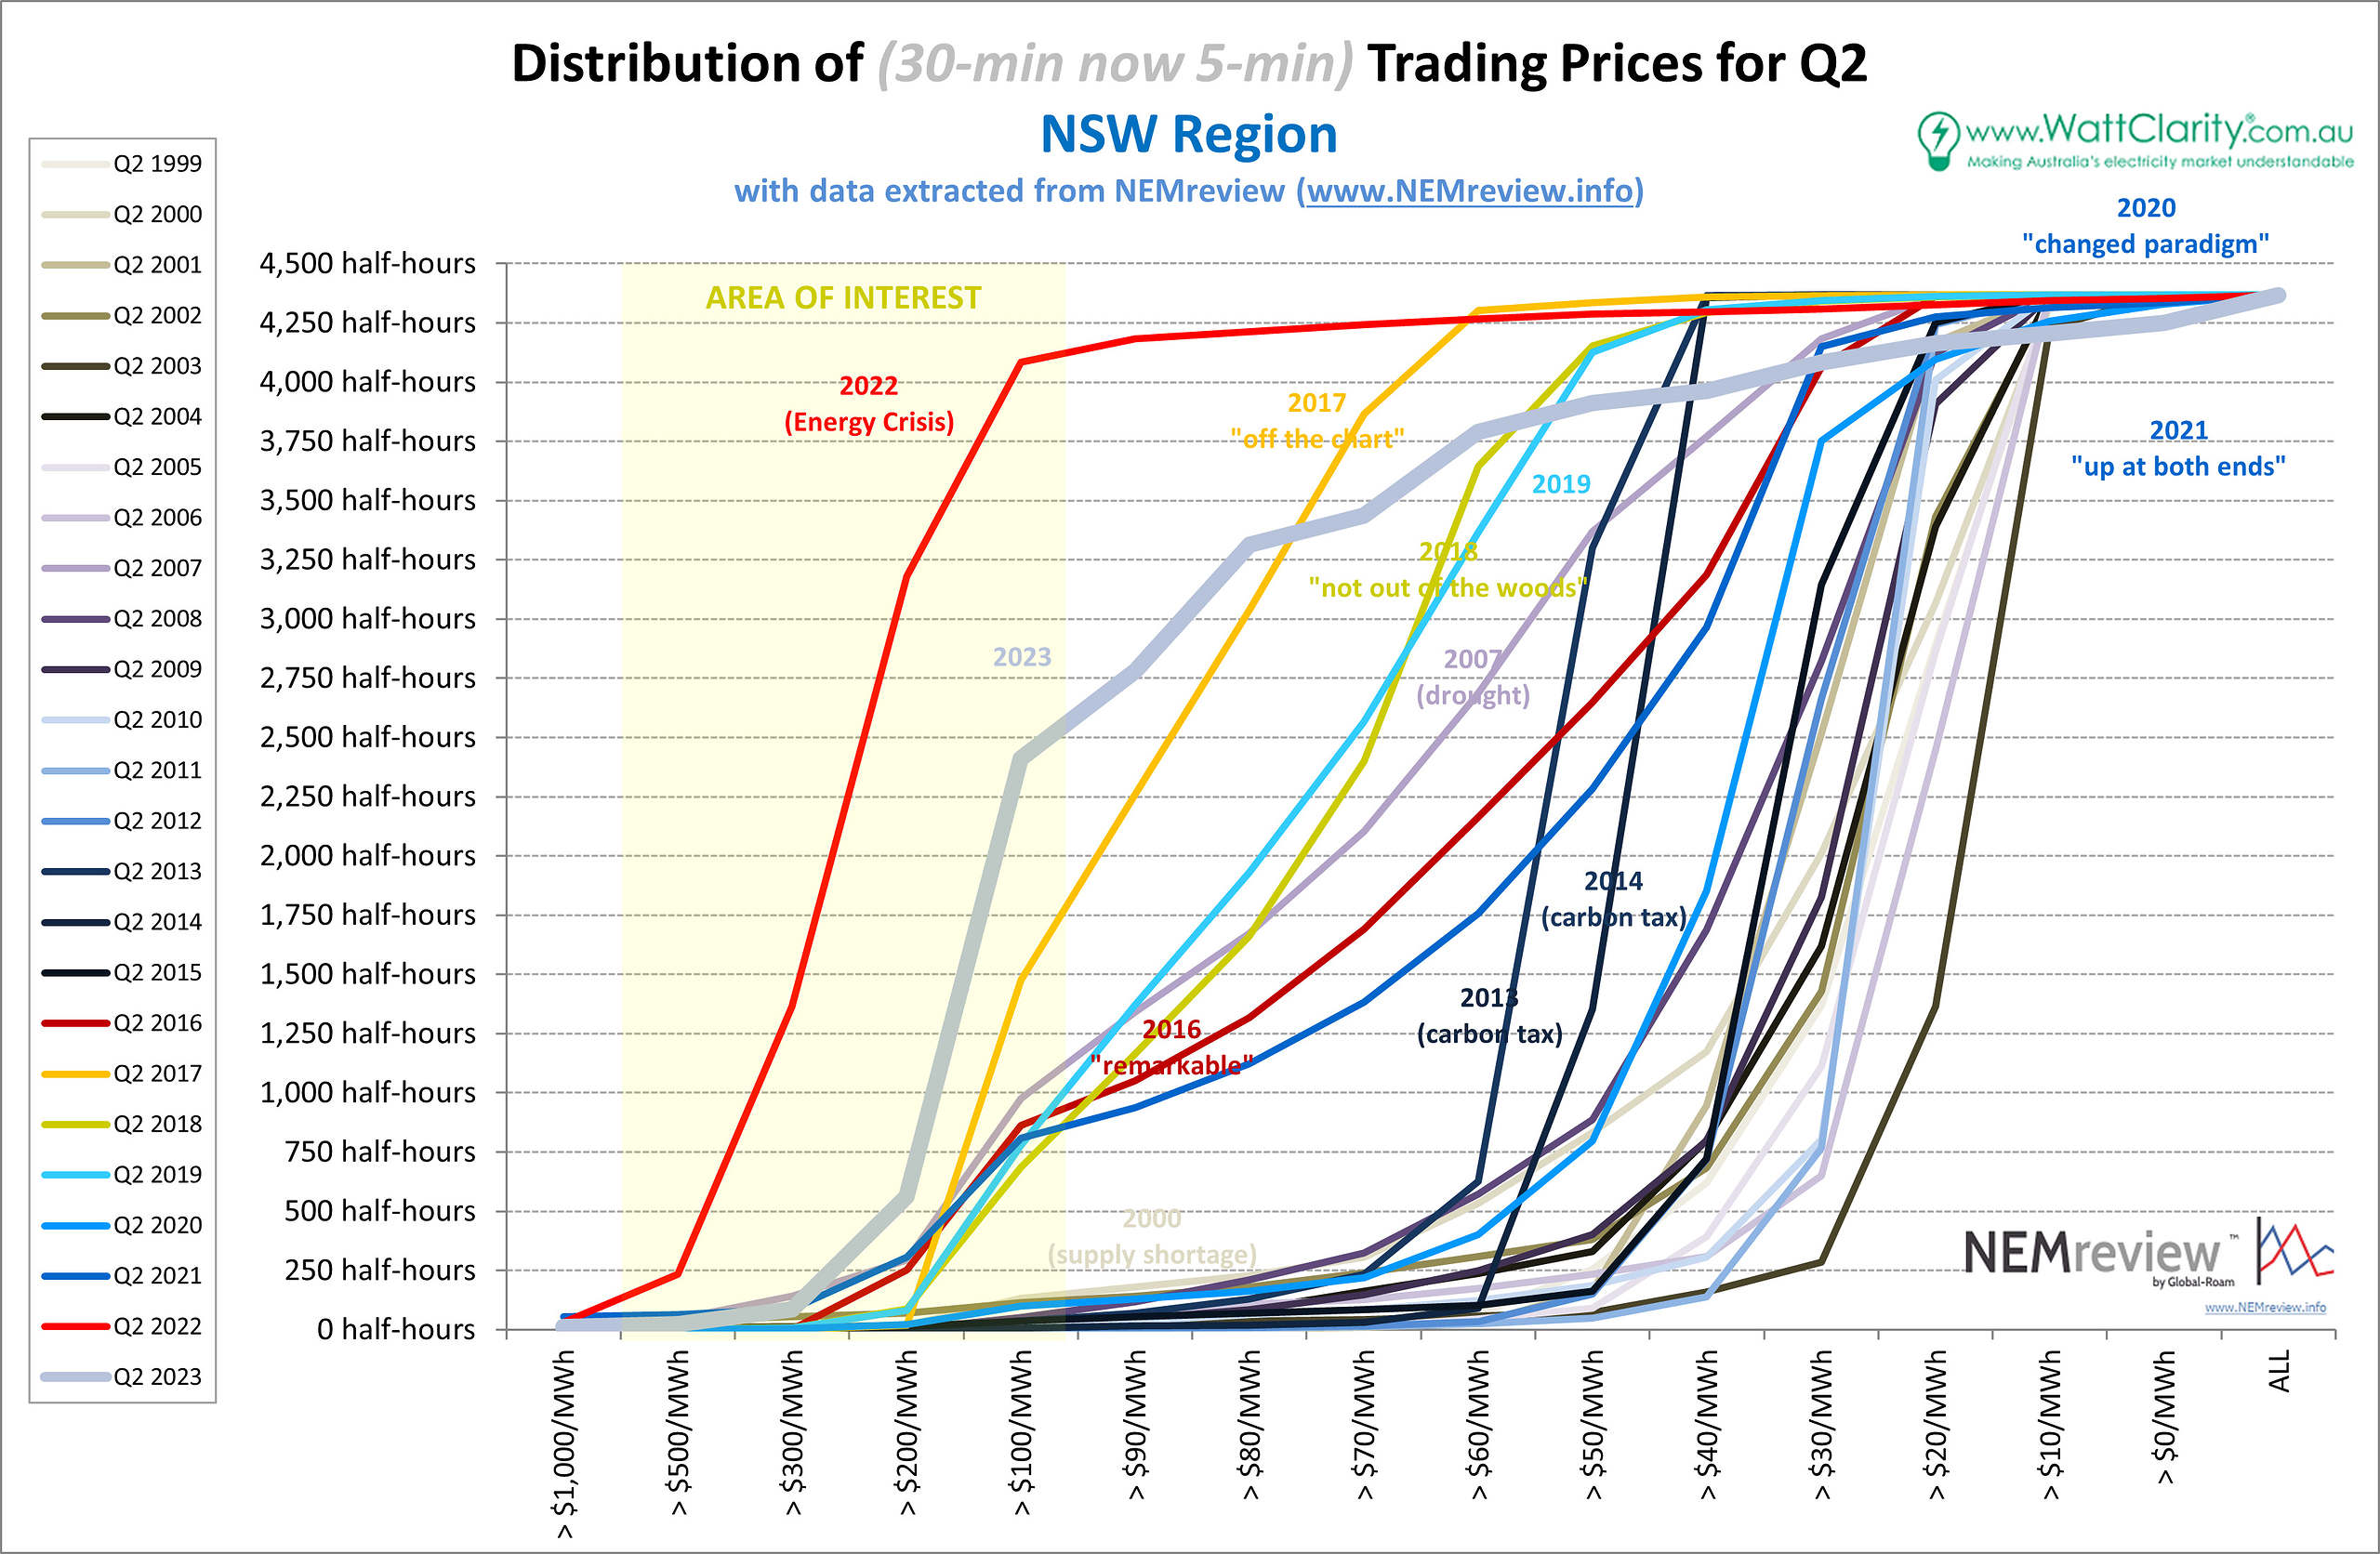
Duration Curve showing the distribution of Q2 Prices in NSW
Source: NEMreview
Victoria
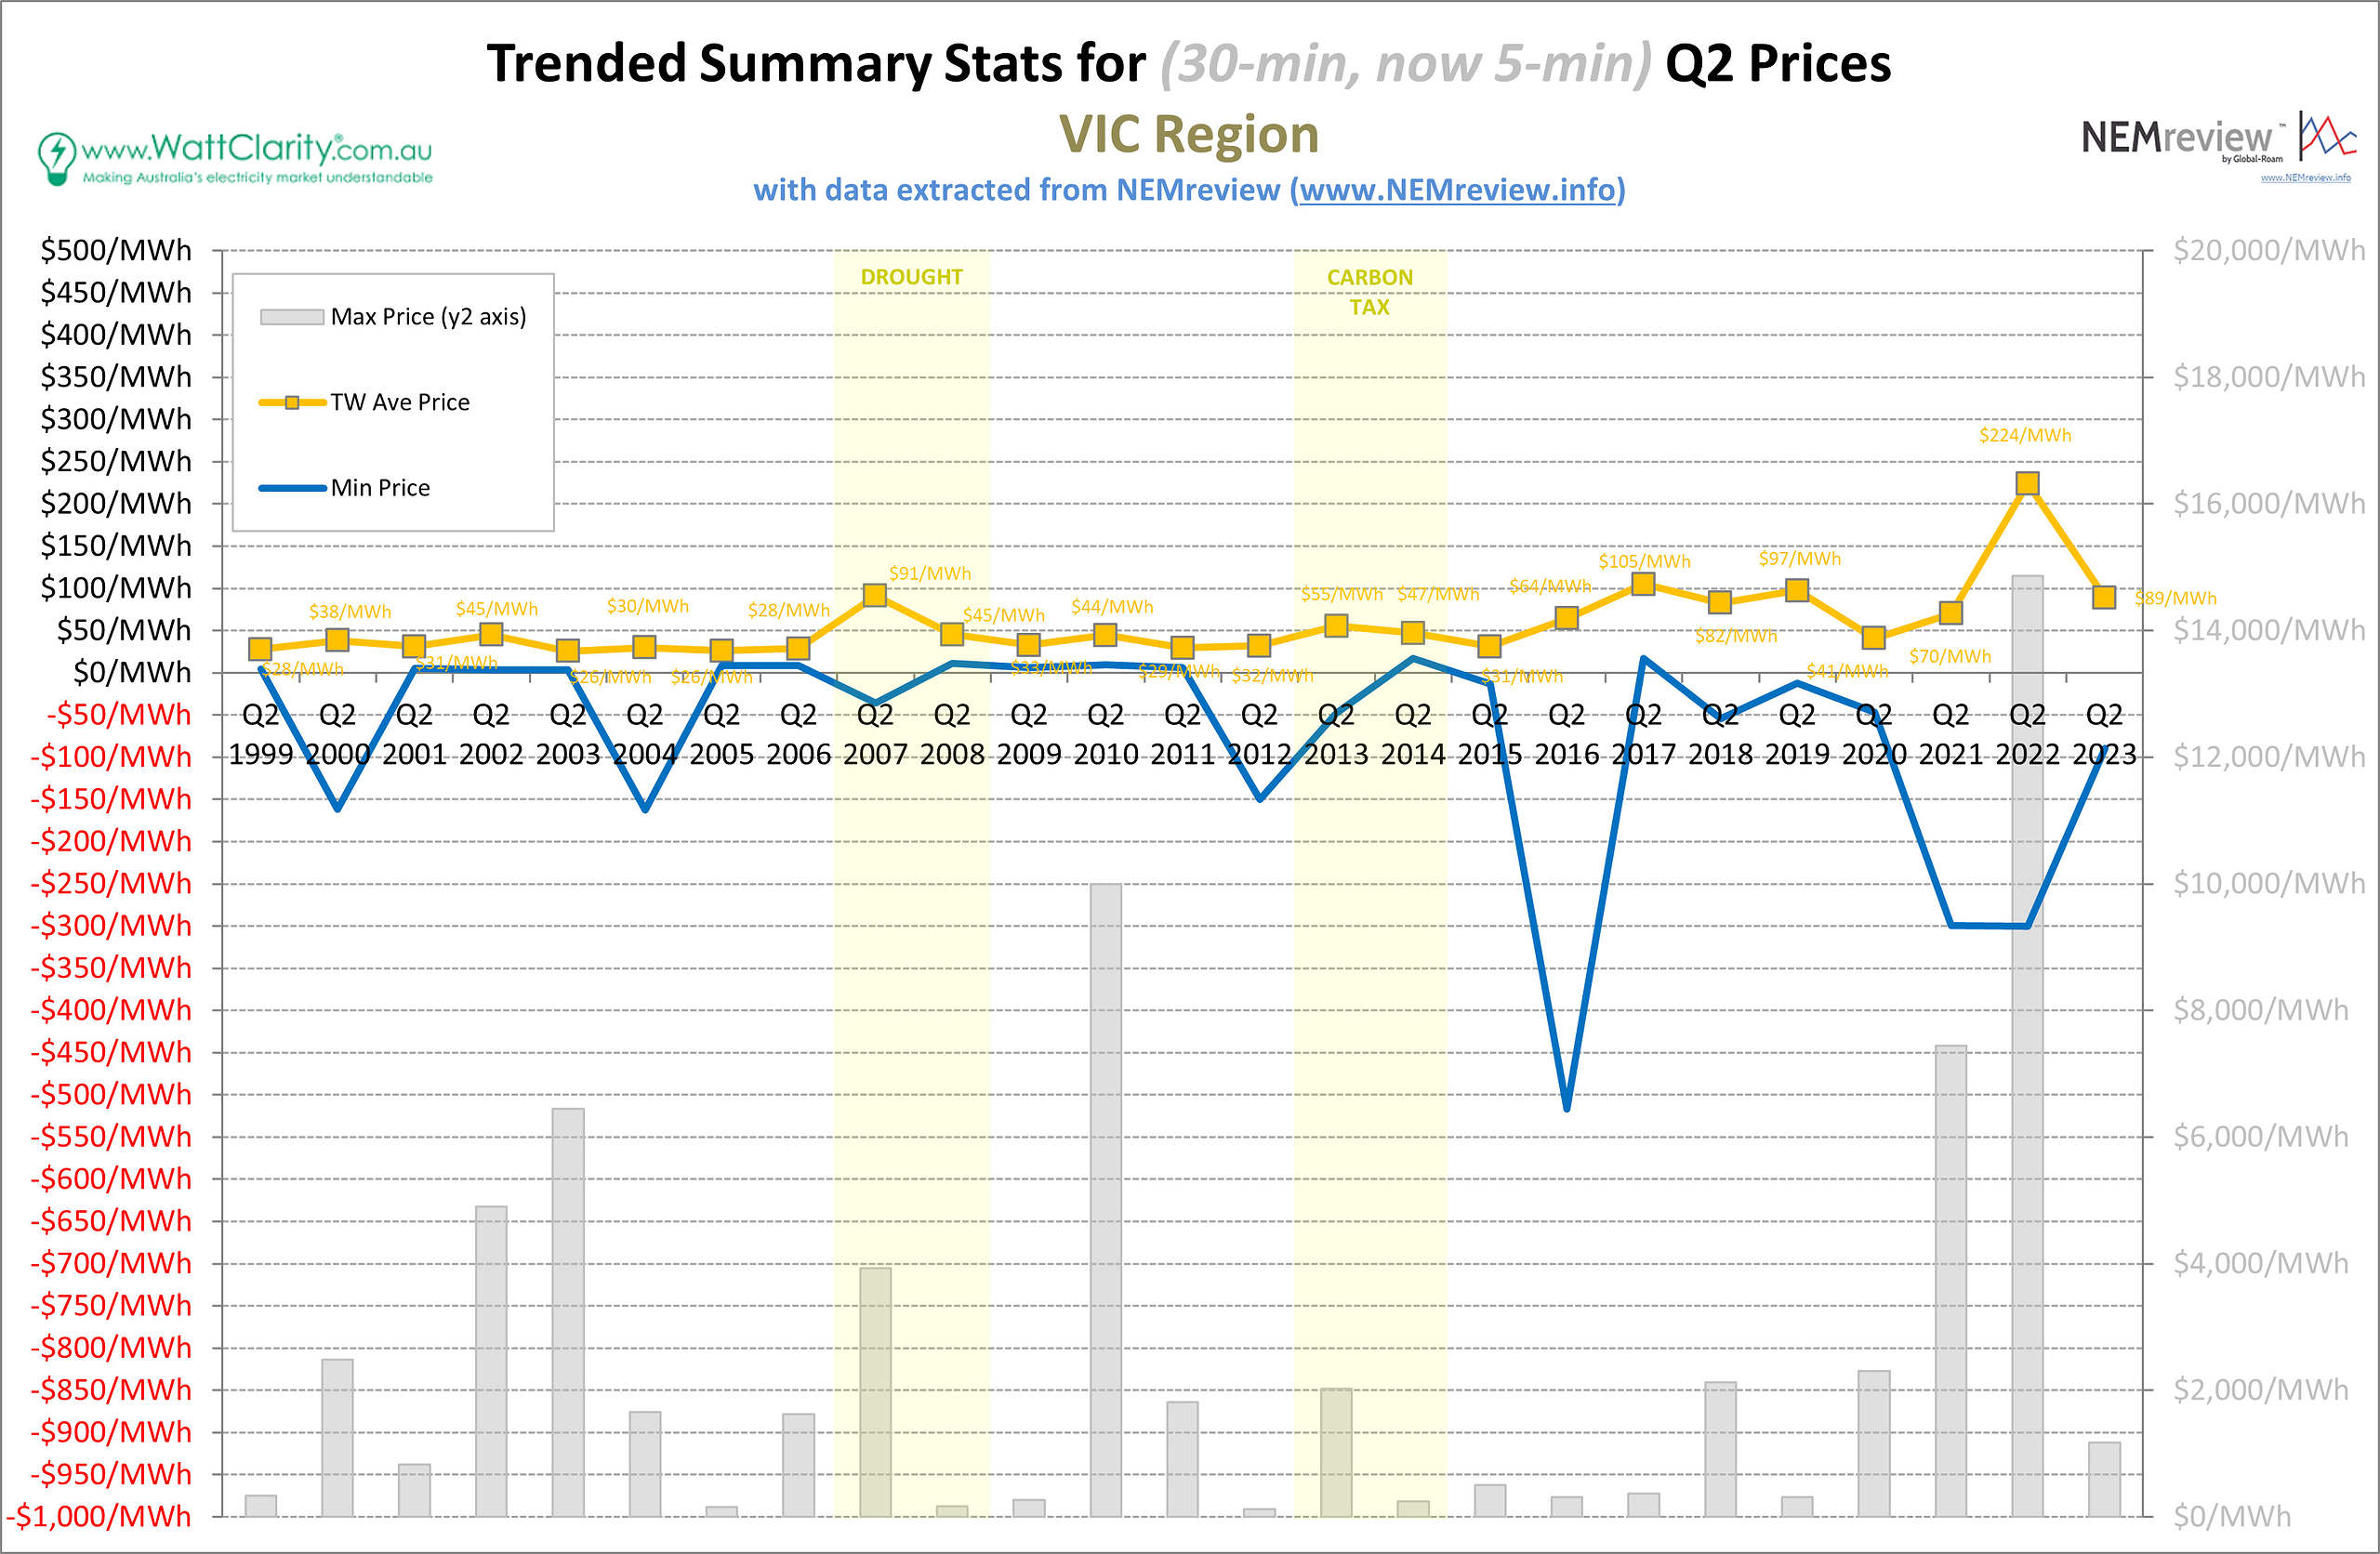
Trended Summary Stats for Q2 Prices in VIC
Source: NEMreview
The average price for Q2 in VIC stayed within a range similar to 2017-2021, coming in at $89/MWh this year. Additionally, we can see that the max price in the region did not go near the market price cap this last quarter. Notably, we can see from the chart below that the distribution of prices flattened out more than in NSW and QLD. To me, this would demonstrate the effect of a constrained VNI interconnector causing price separations between VIC and the more-northern regions.
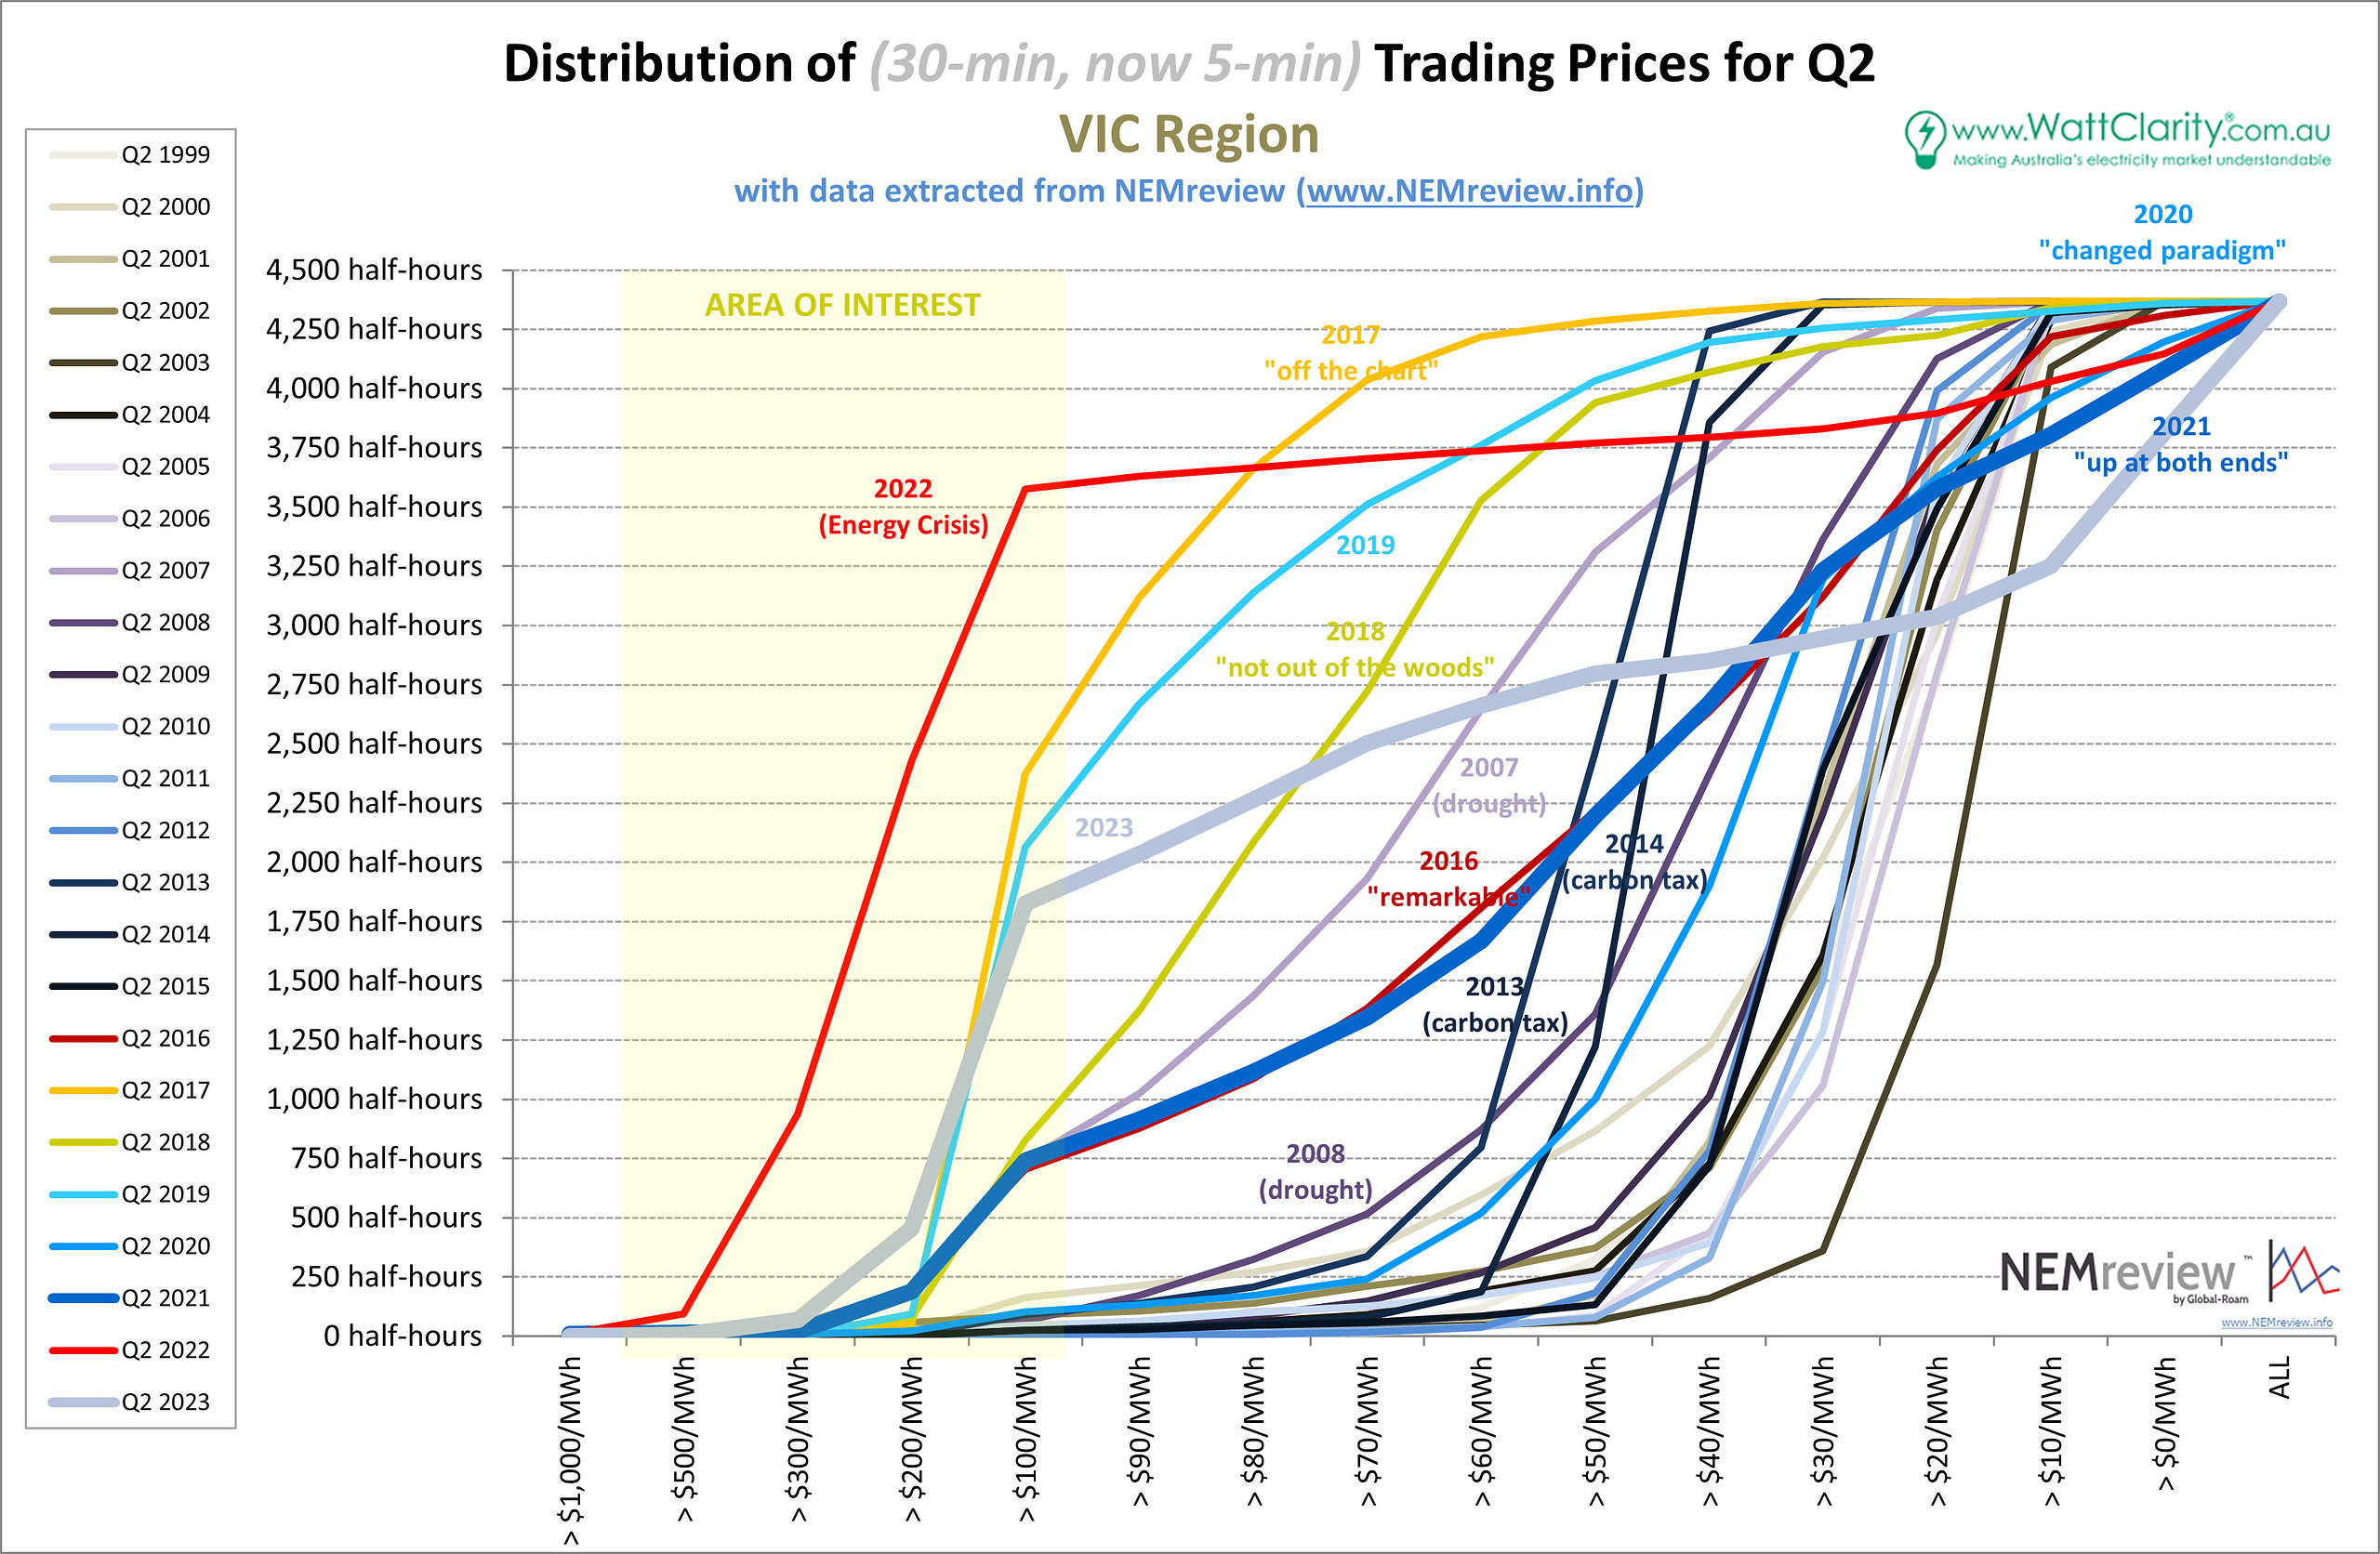
Duration Curve showing the distribution of Q2 Prices in VIC
Source: NEMreview
South Australia
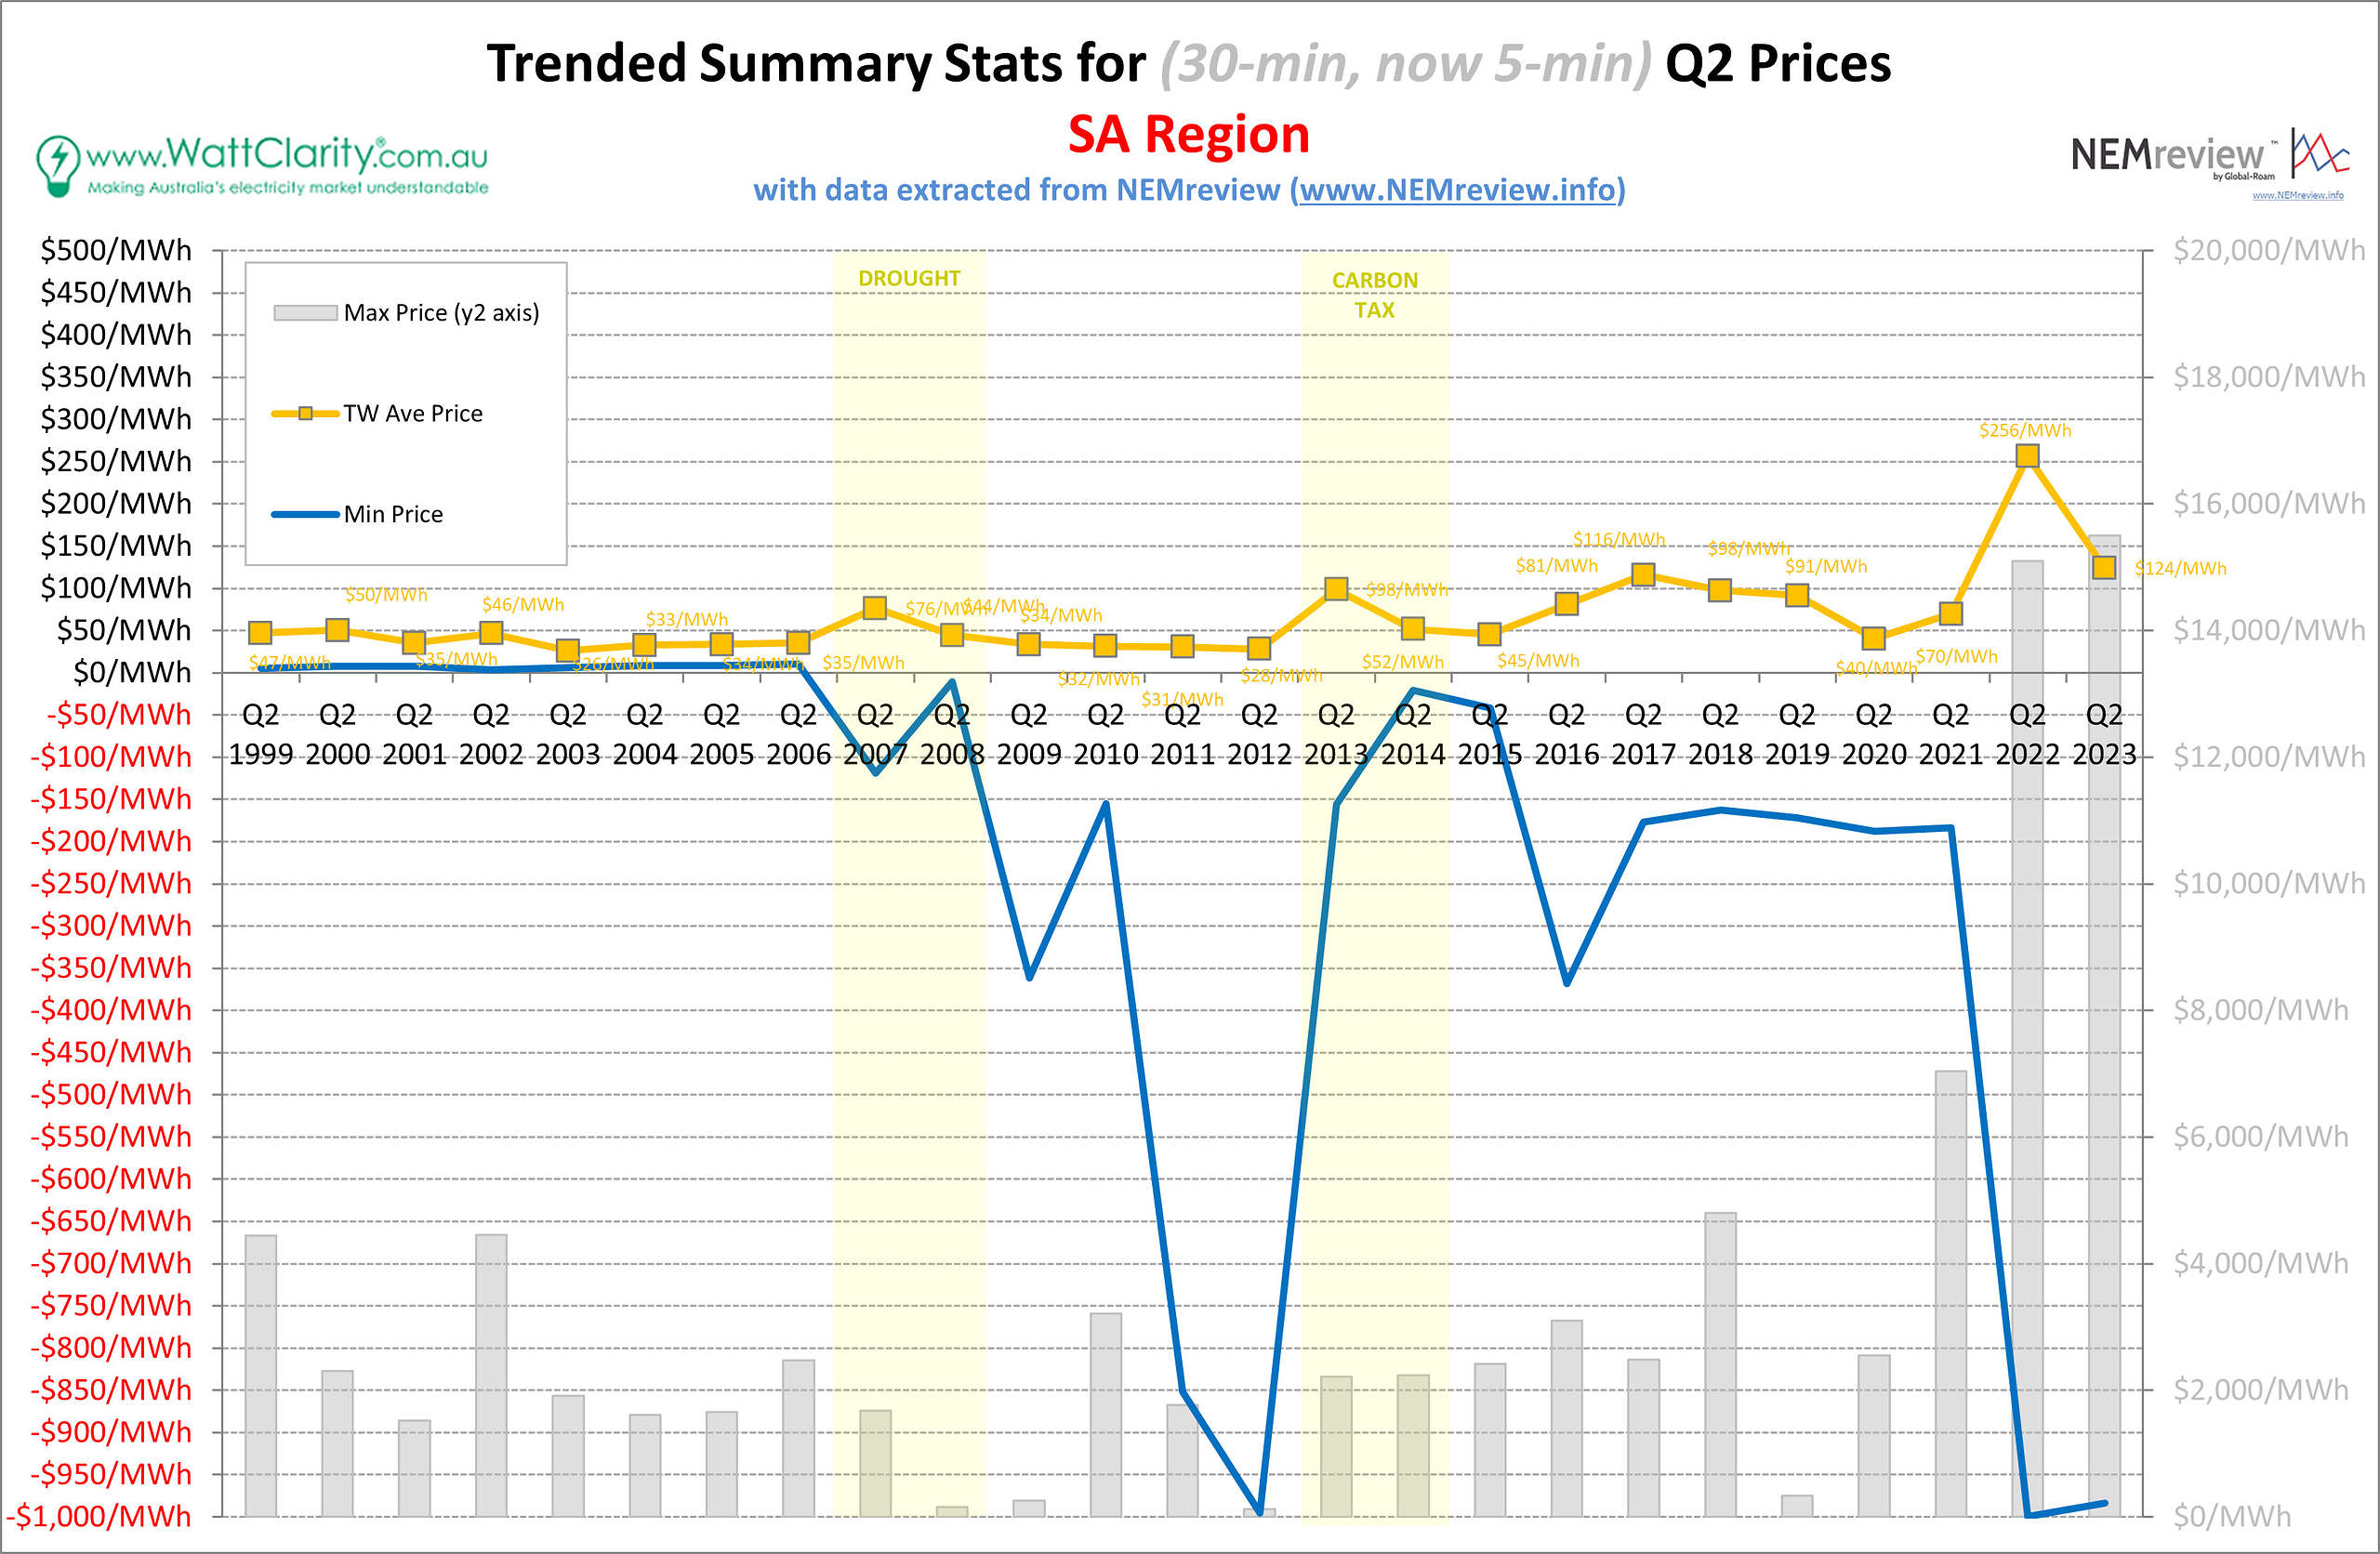
Trended Summary Stats for Q2 Prices in SA
Source: NEMreview
The time-weighted average price in SA this last quarter was $124/MWh, demonstrating an underlying long-term trend of increasing average prices in the region compared to Q2 in previous years. We can also see that the max and min prices reached near price cap and price floor levels at some stage during the quarter. The shape of the duration curve for the region this last quarter (shown below) somewhat resembles that of VIC.
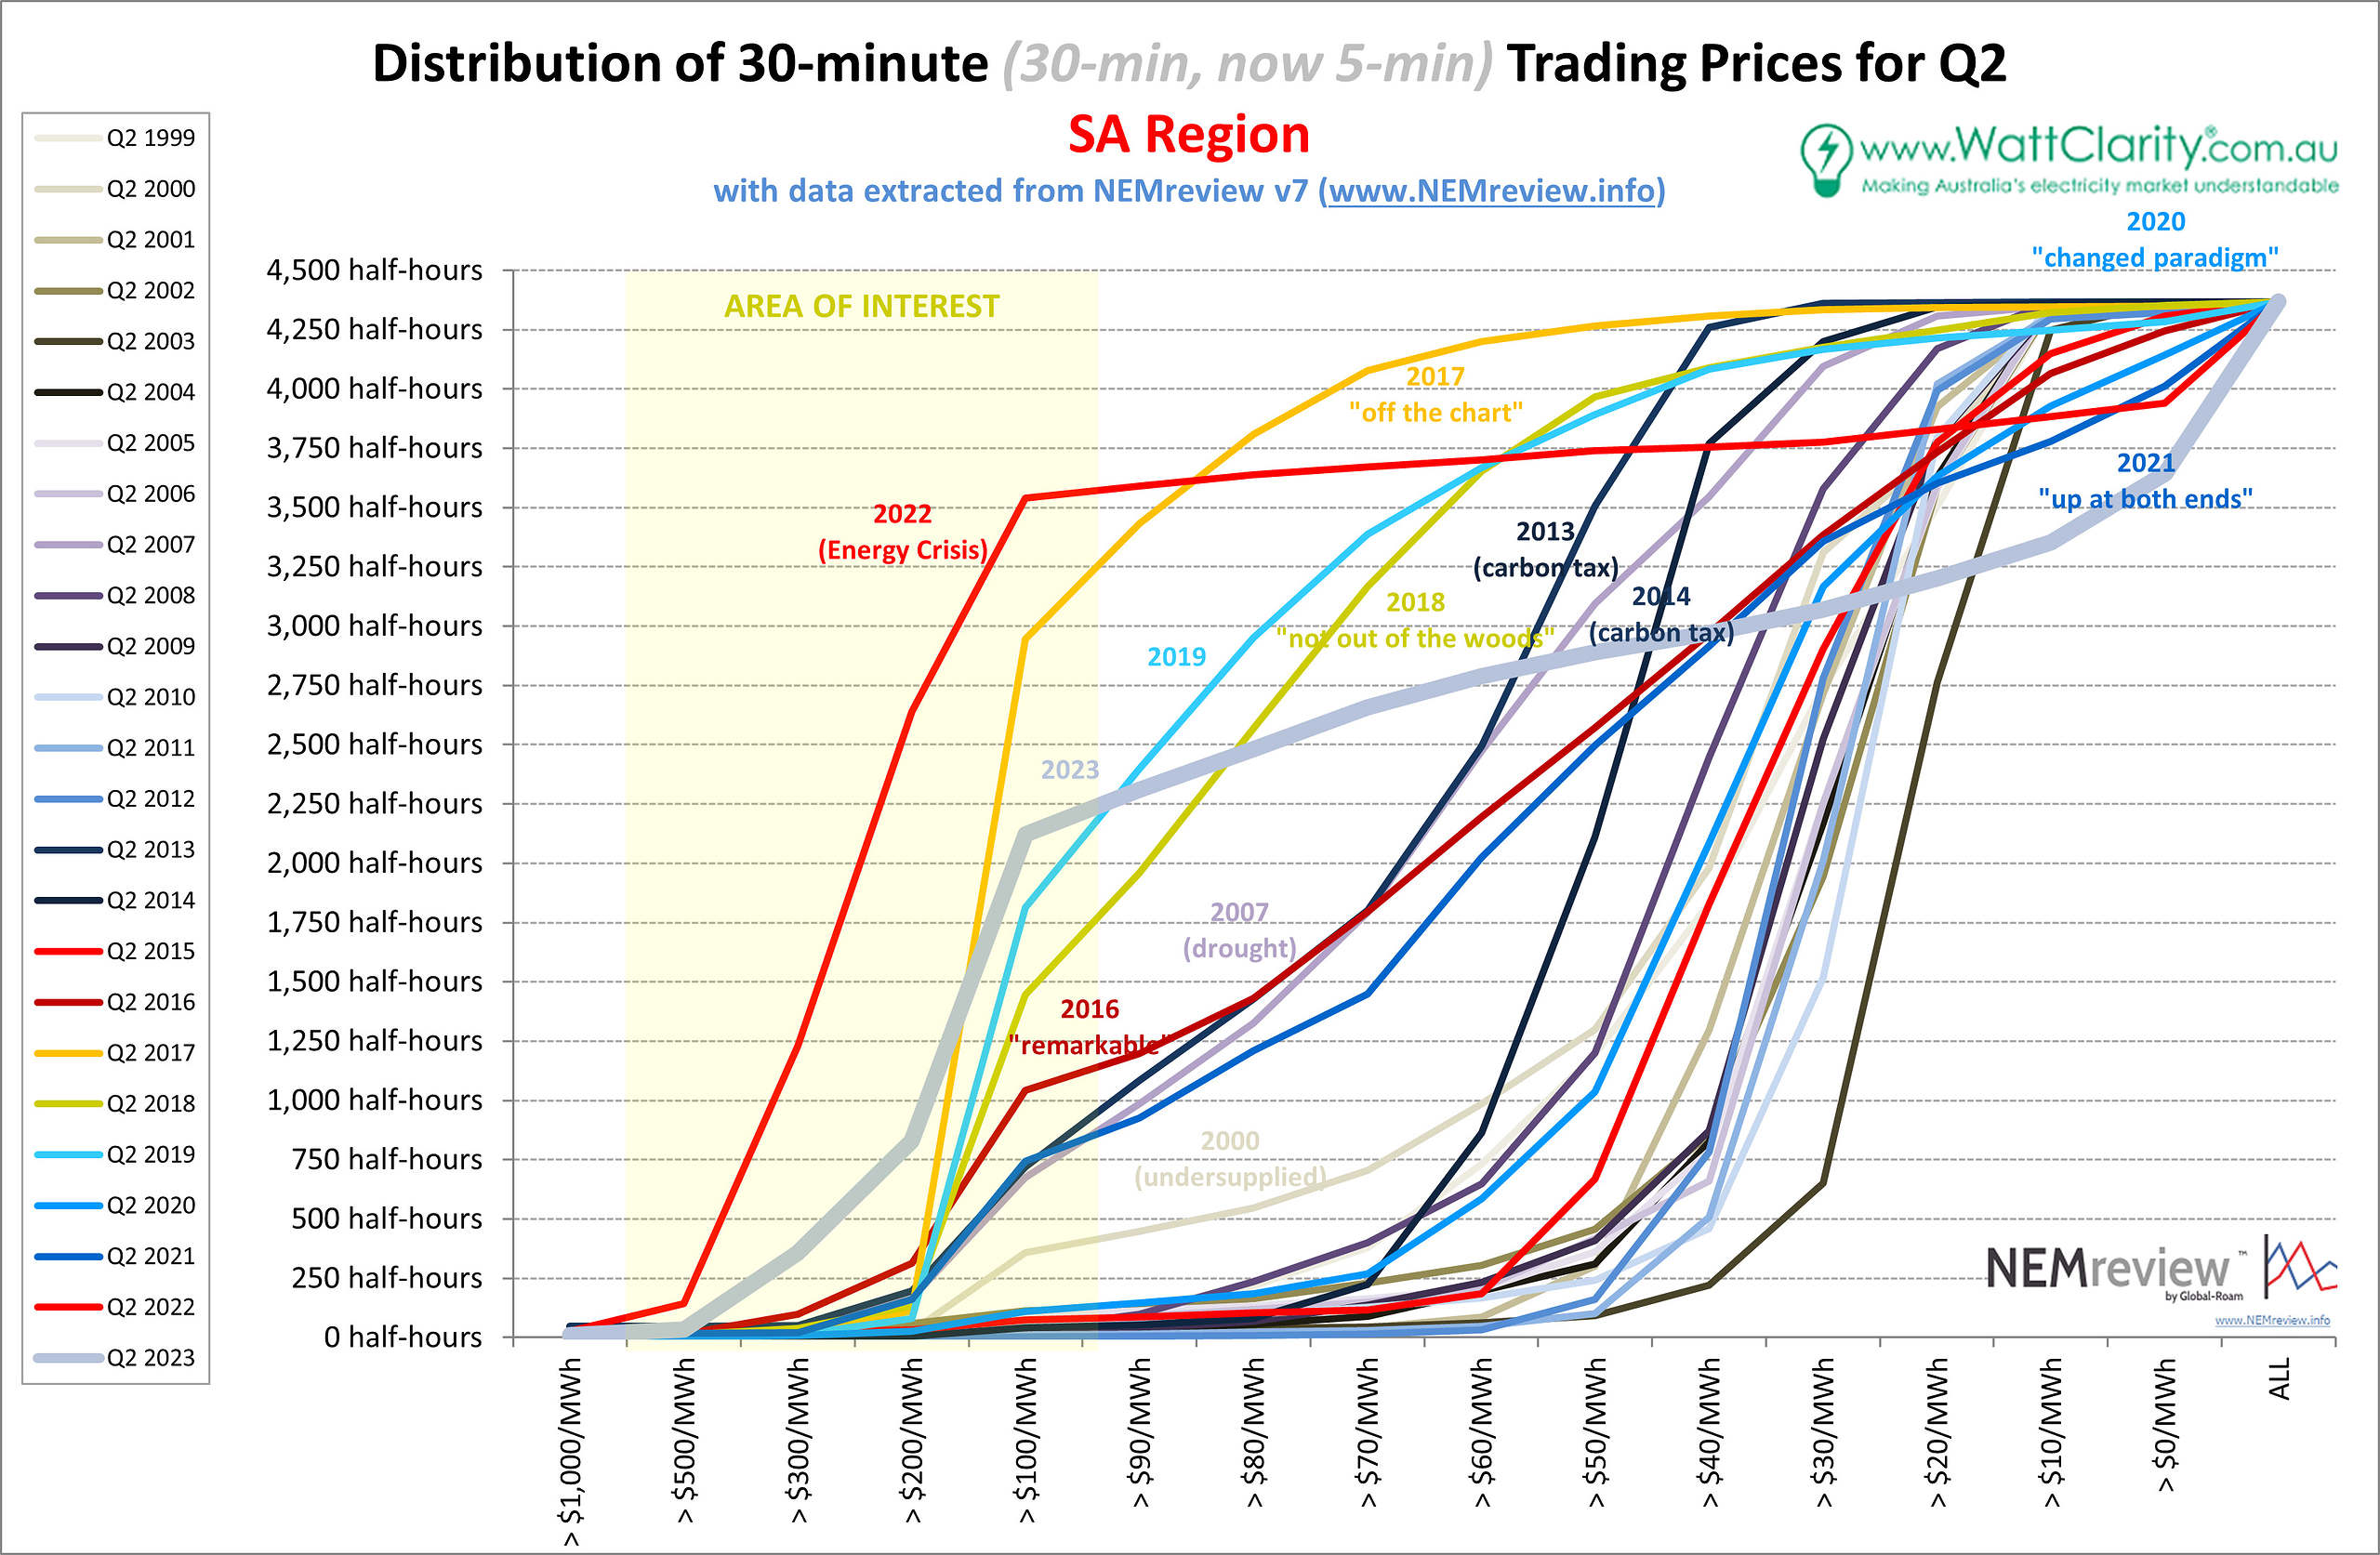
Duration Curve showing the distribution of Q2 Prices in SA
Source: NEMreview
Tasmania
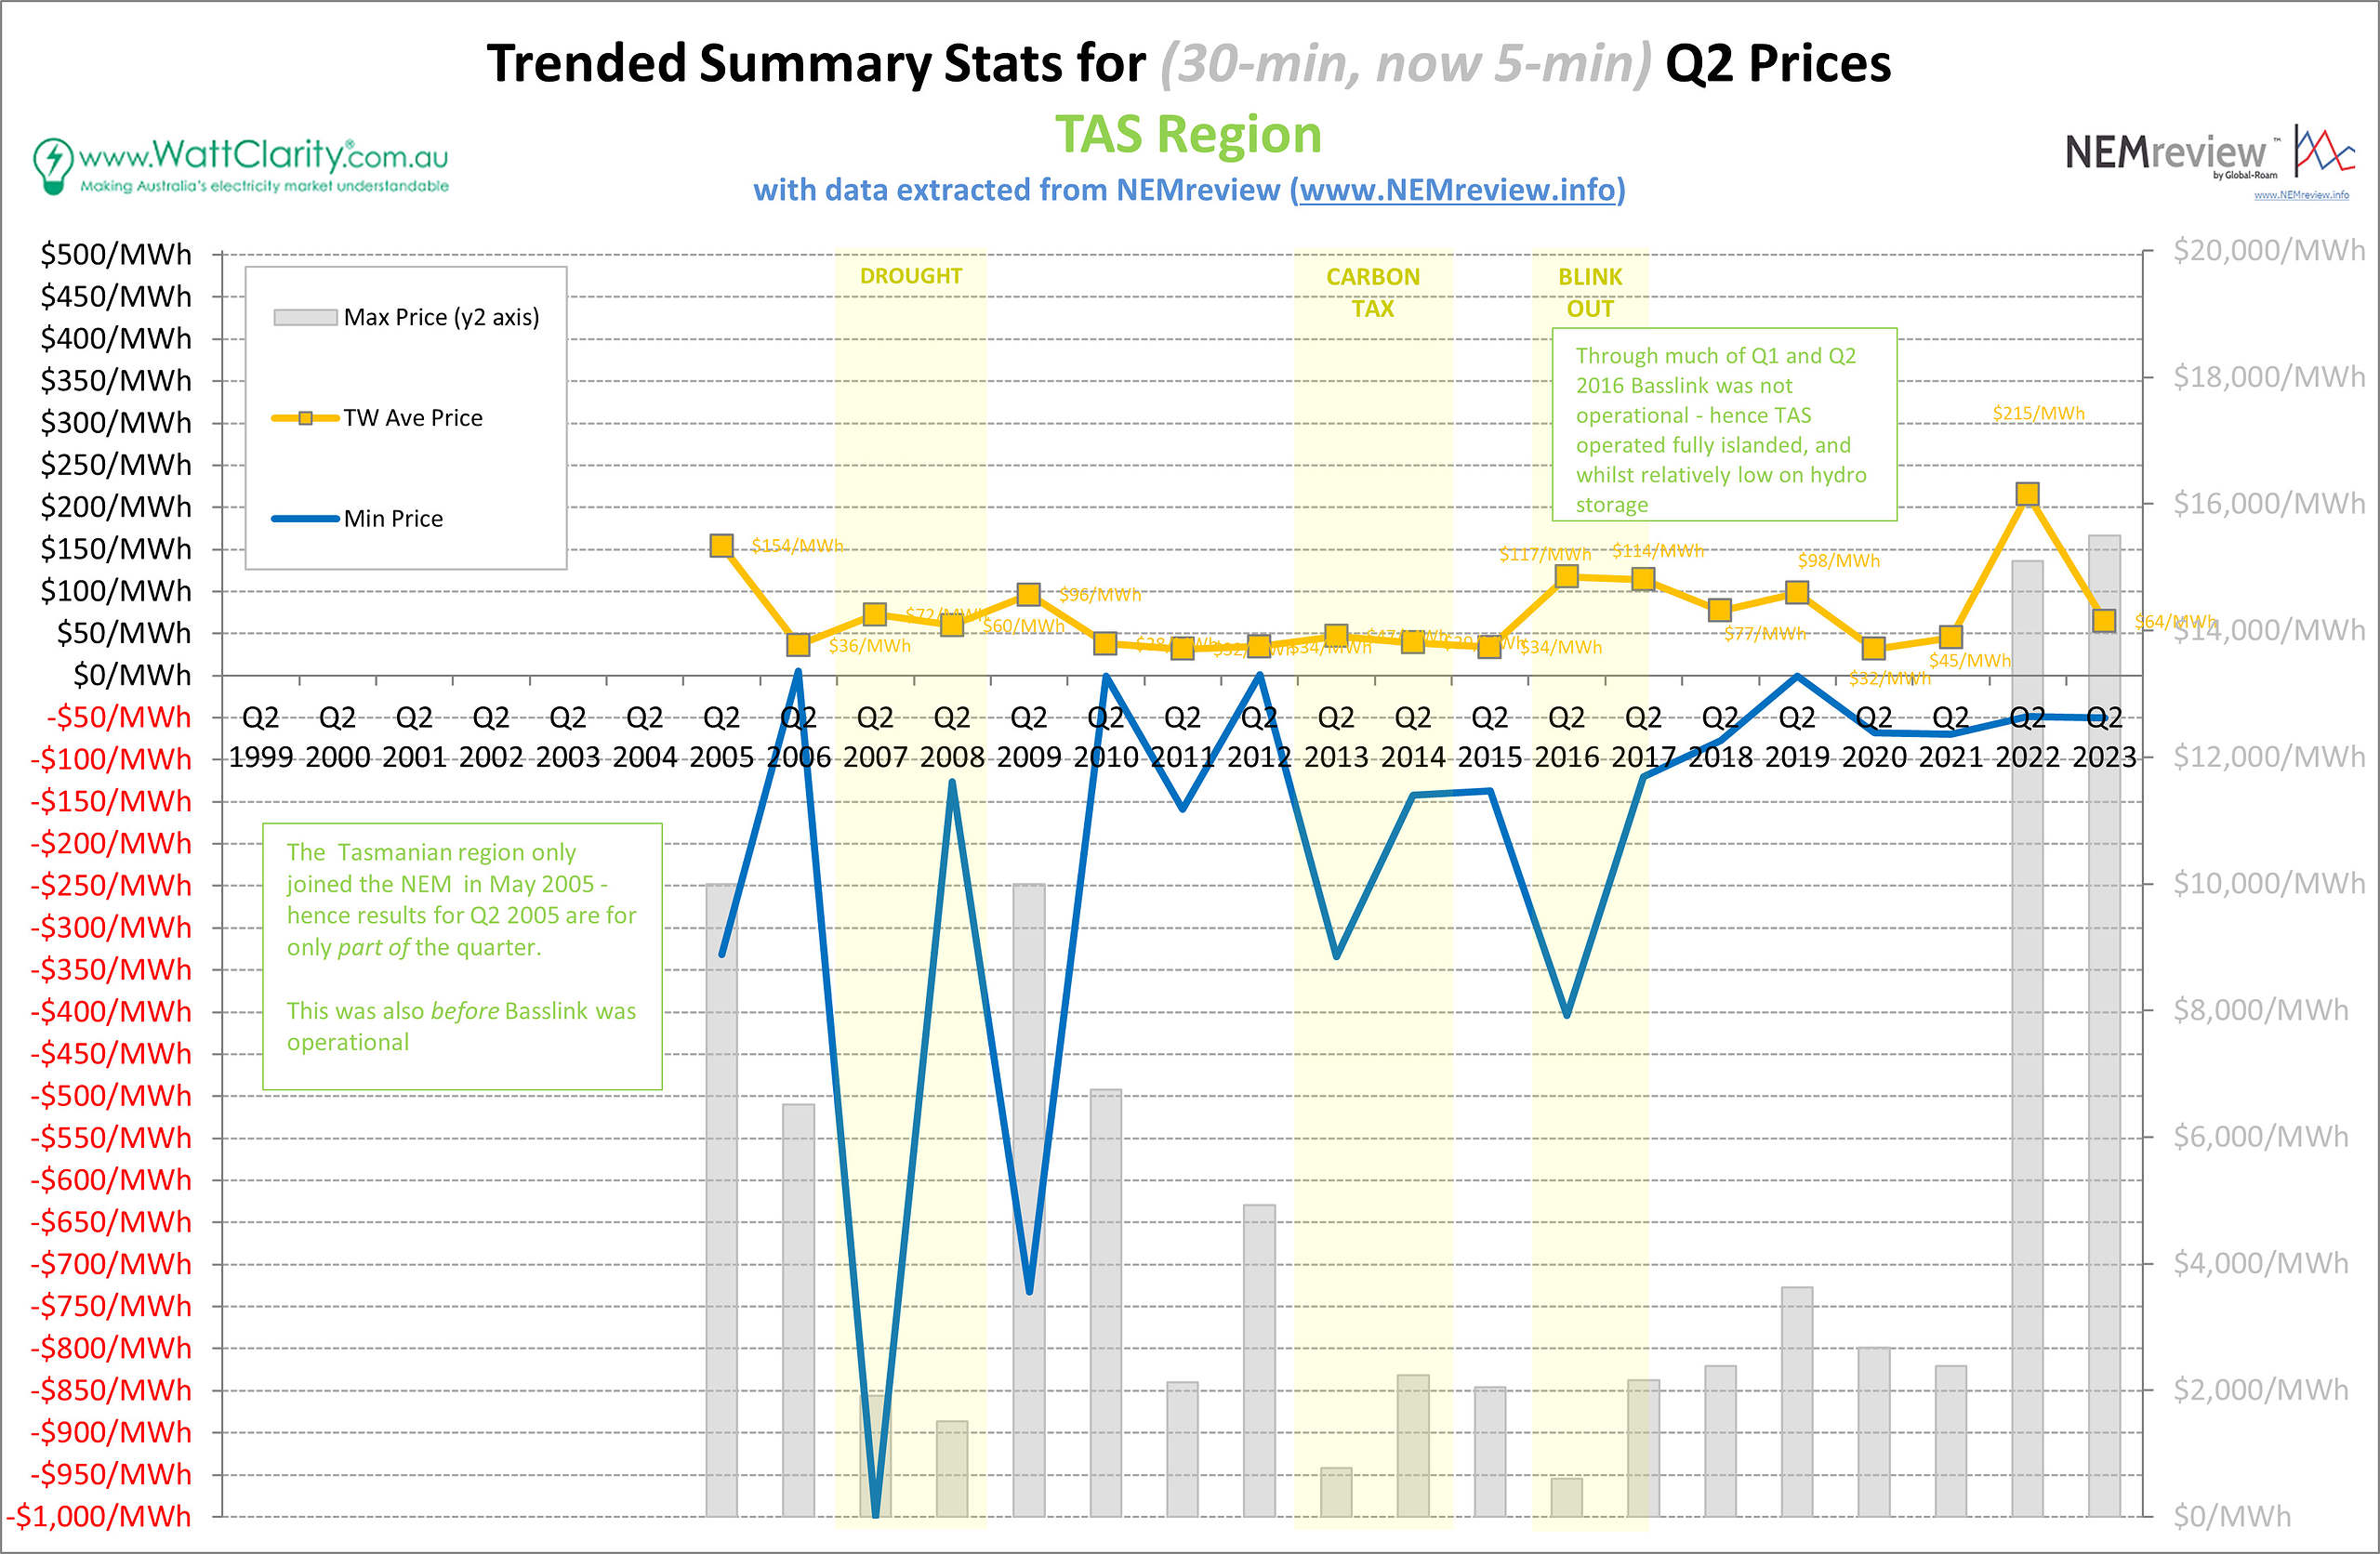
Trended Summary Stats for Q2 Prices in TAS
Source: NEMreview
The average price for TAS this last quarter was $64/MWh, returning to more typical levels seen since 2018. Unlike other NEM regions, the duration curve in TAS for Q2 2023 is more moderate when compared to previous years.
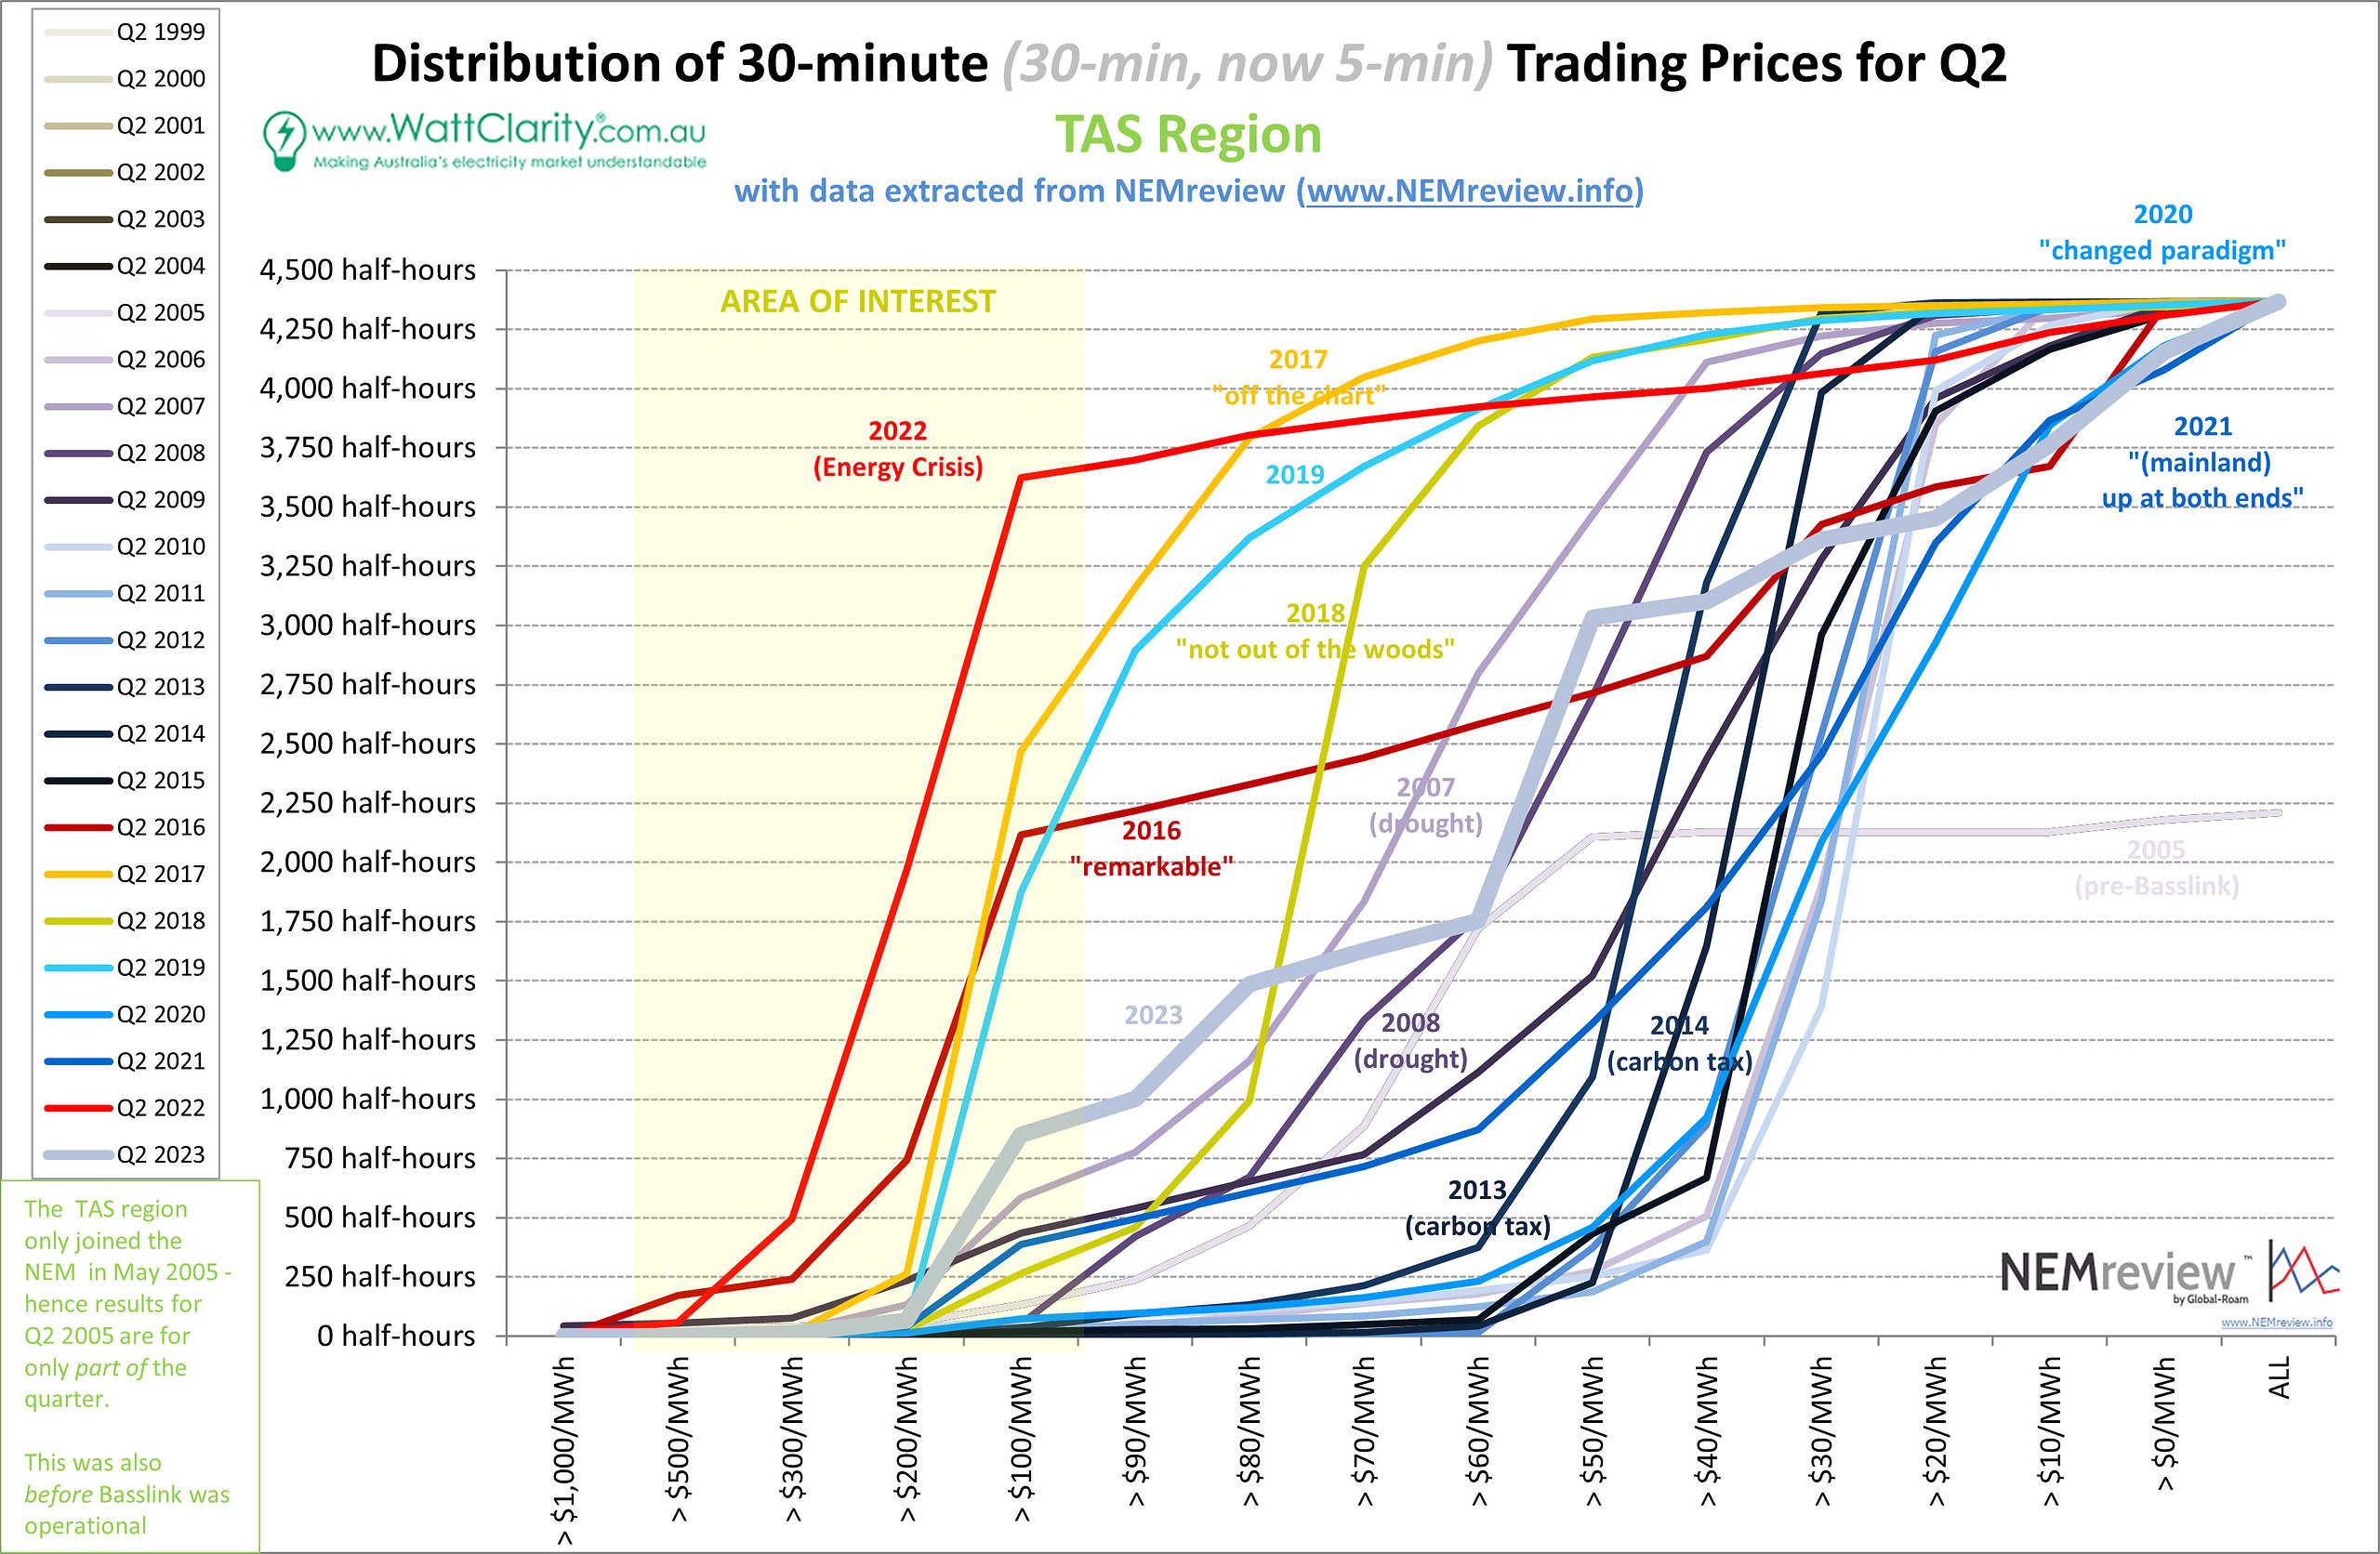
Duration Curve showing the distribution of Q2 Prices in TAS
Source: NEMreview
WA
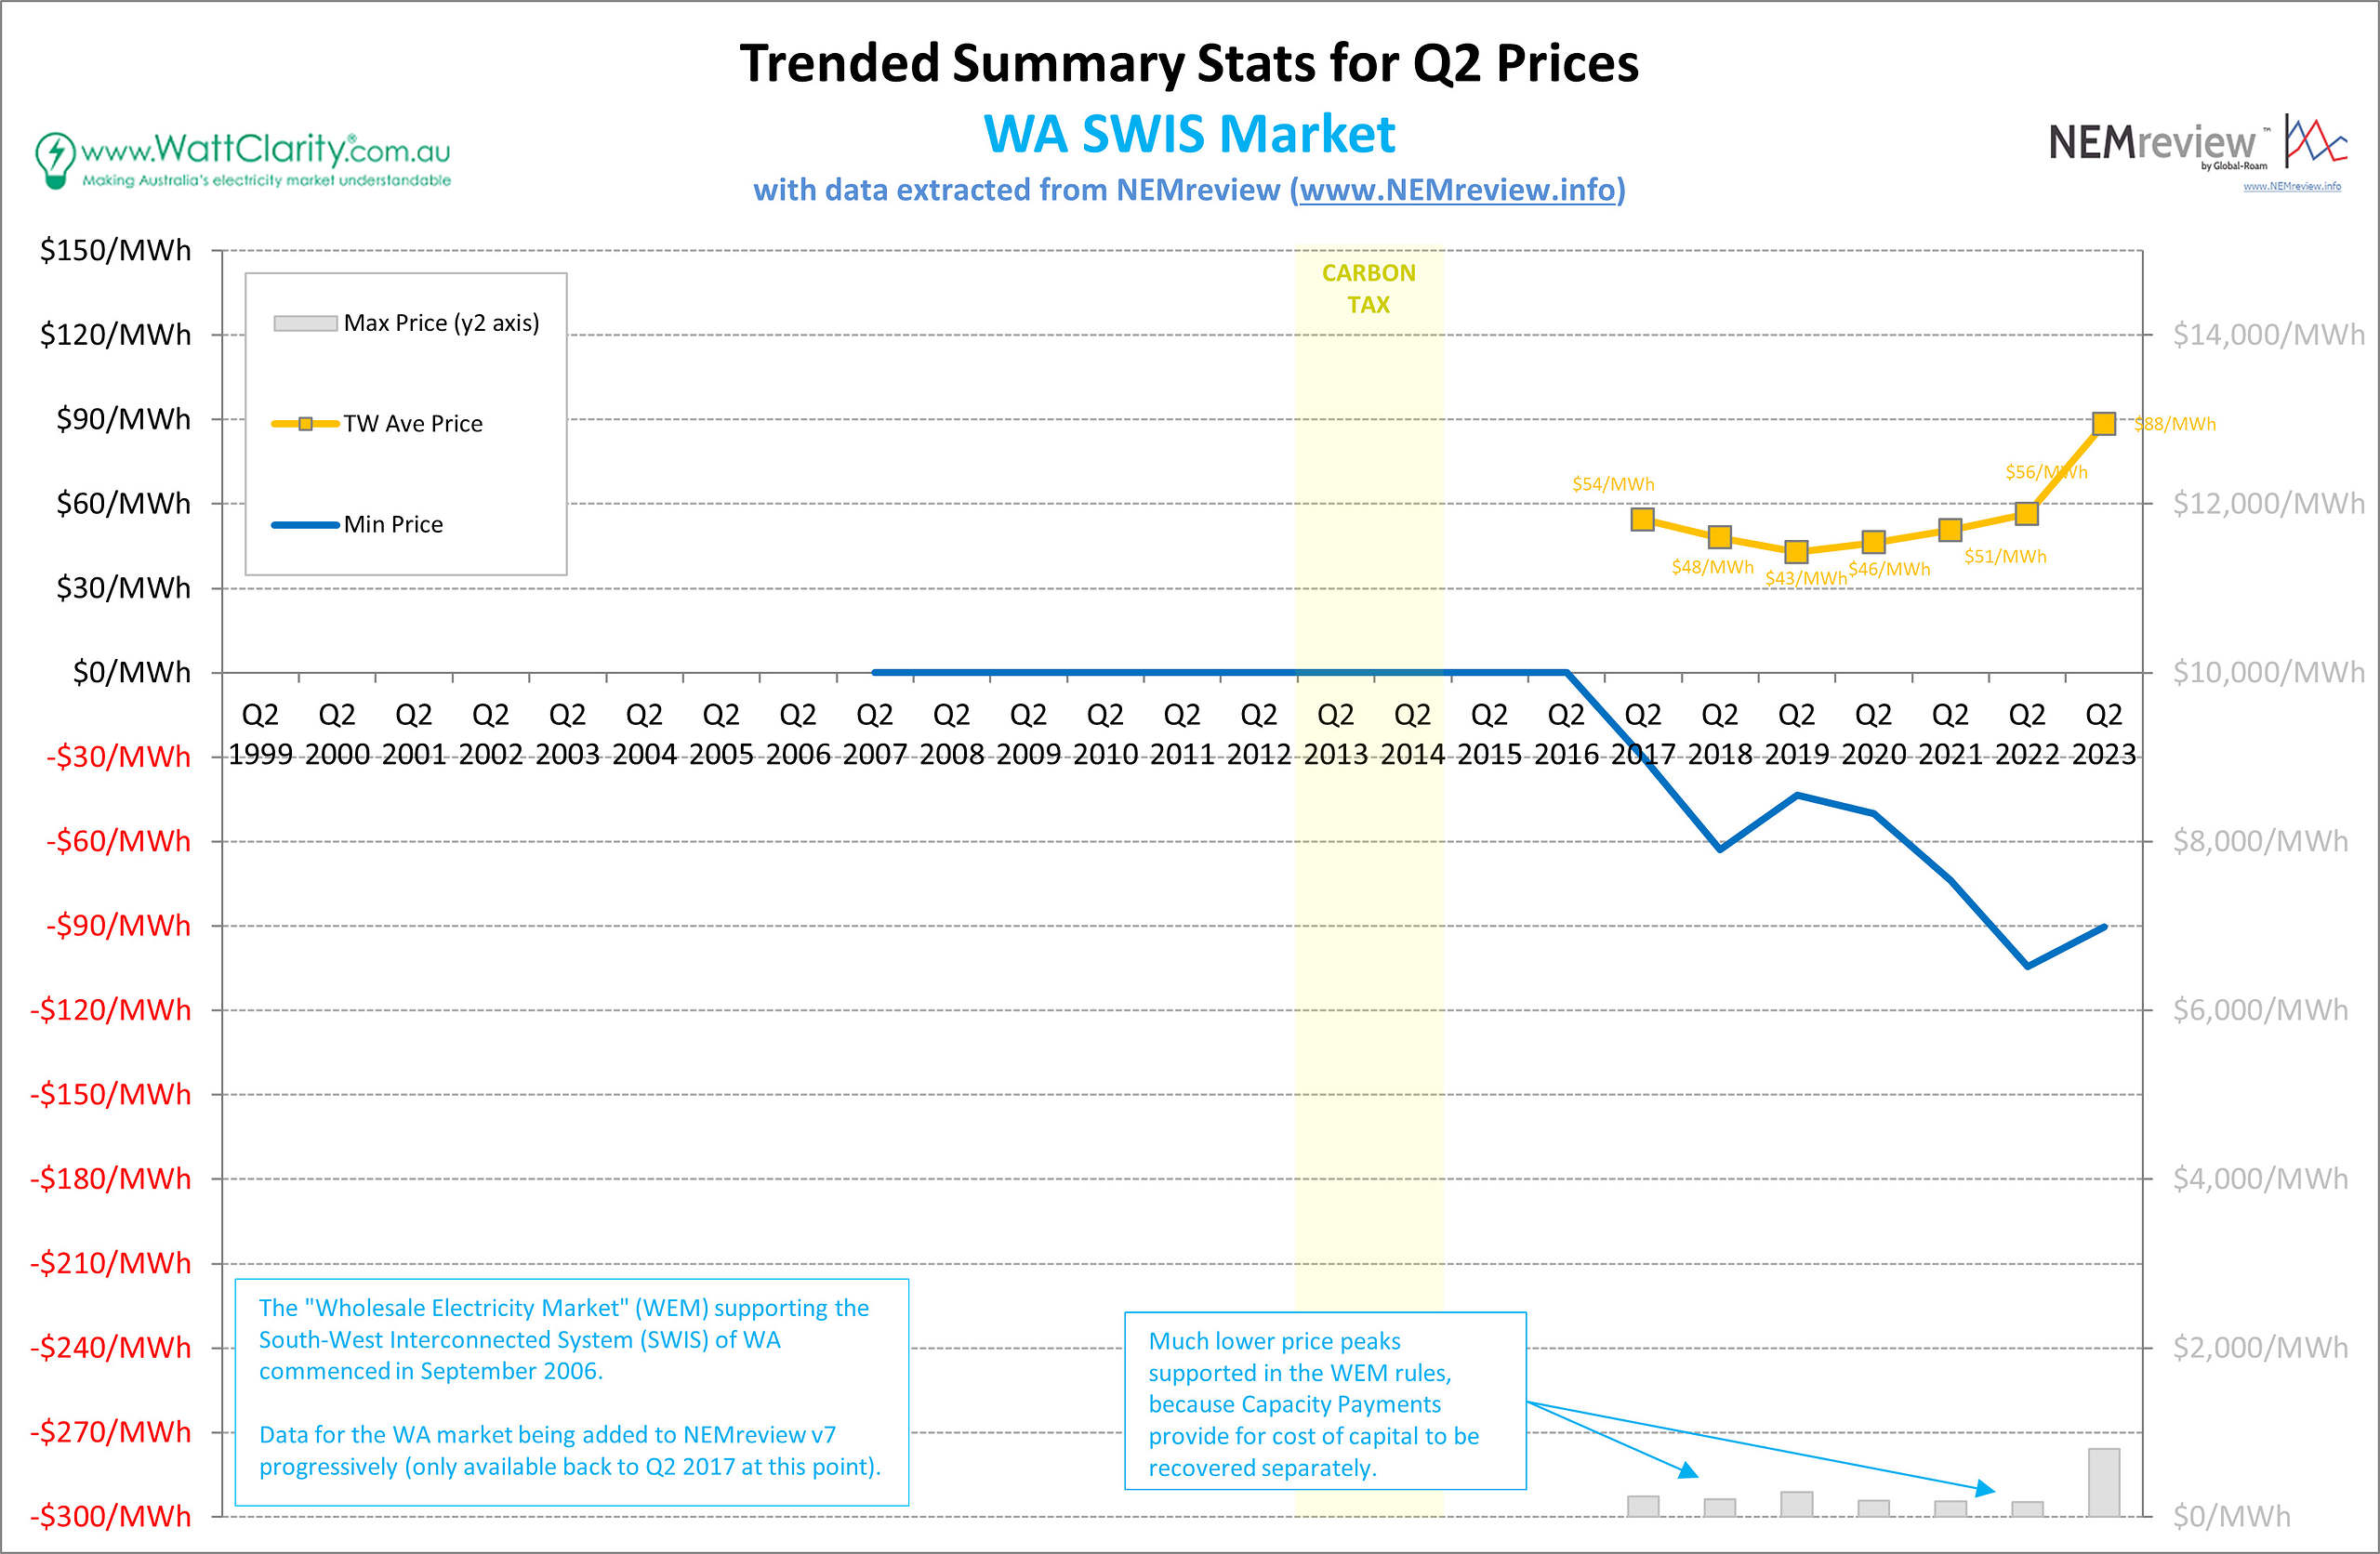
Trended Summary Stats for Q2 Prices in WA
Source: NEMreview
Mostly due to the different market design of the SWIS, we saw that max and average prices in the WEM did not spike to the same extraordinary levels as in the NEM during last year’s energy crisis. It is worth noting, however, that average prices in the WEM are up this year, to $88/MWh, from $56/MWh in 2022 for Q2. Notably, the duration curve below shows that 2023 (and not 2022) was the outlier for wholesale prices in WA, in regards to incidences of high prices.
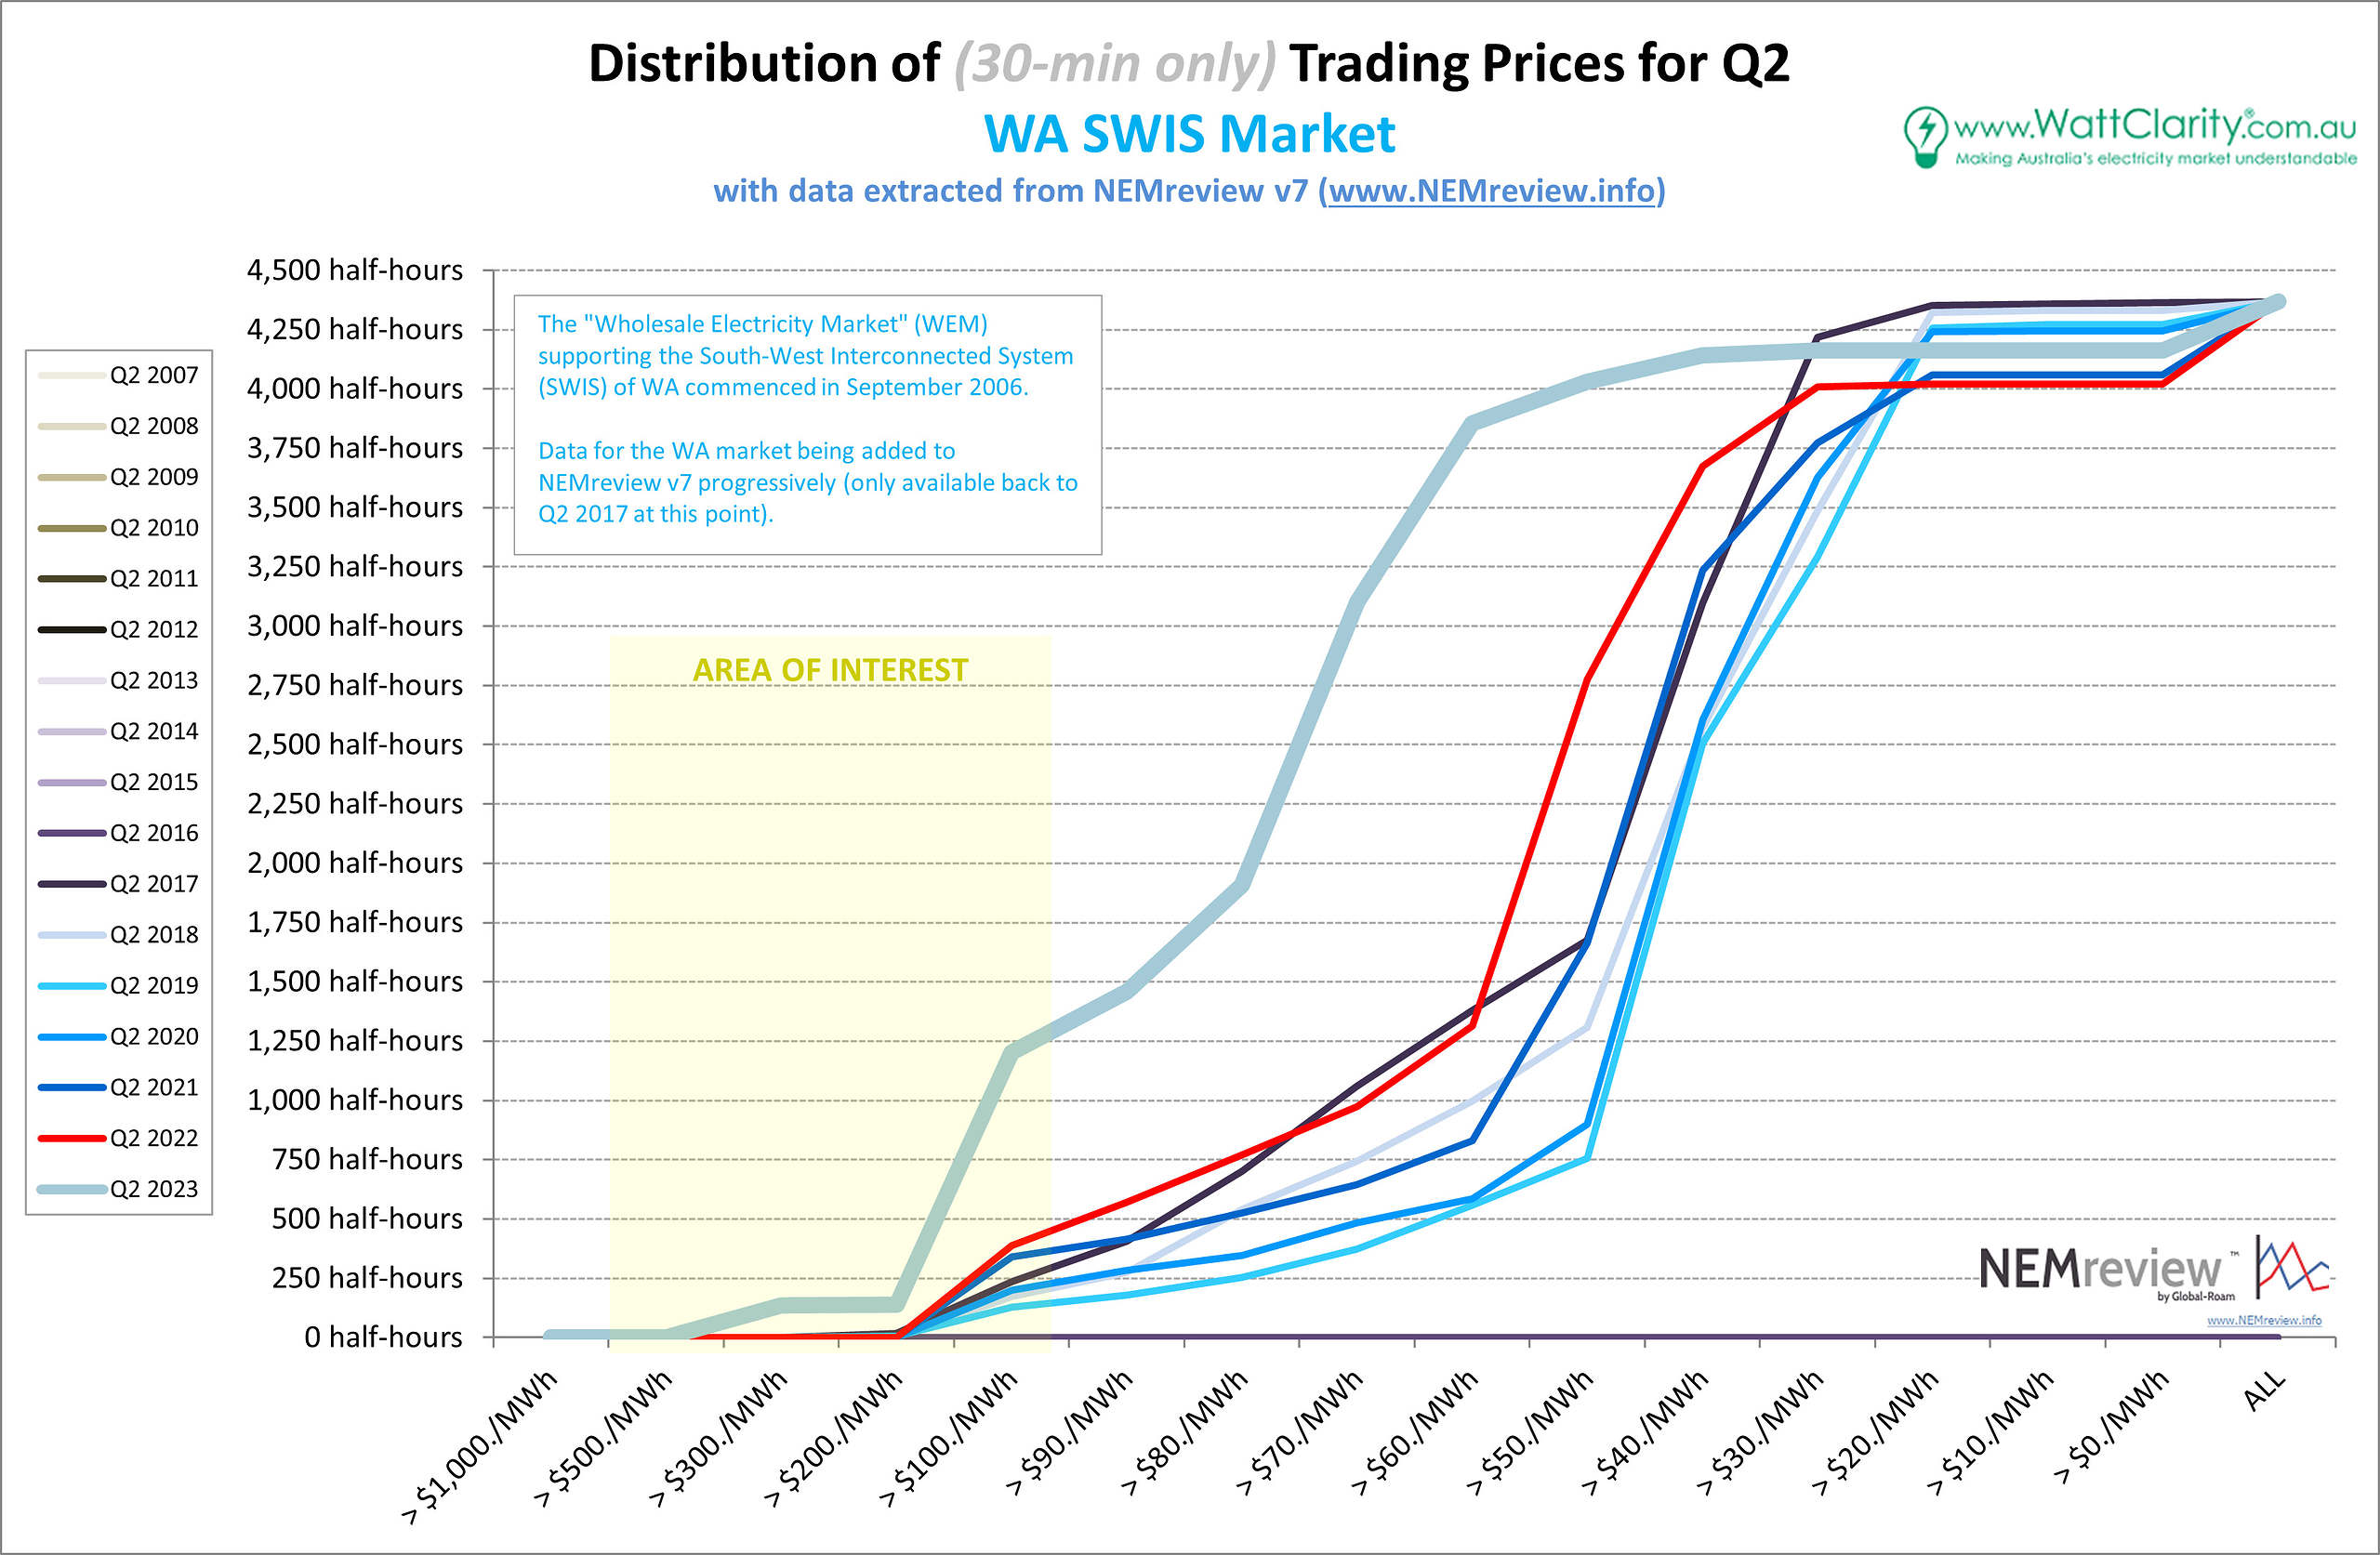
Duration Curve showing the distribution of Q2 Prices in WA
Source: NEMreview
Summary Charts
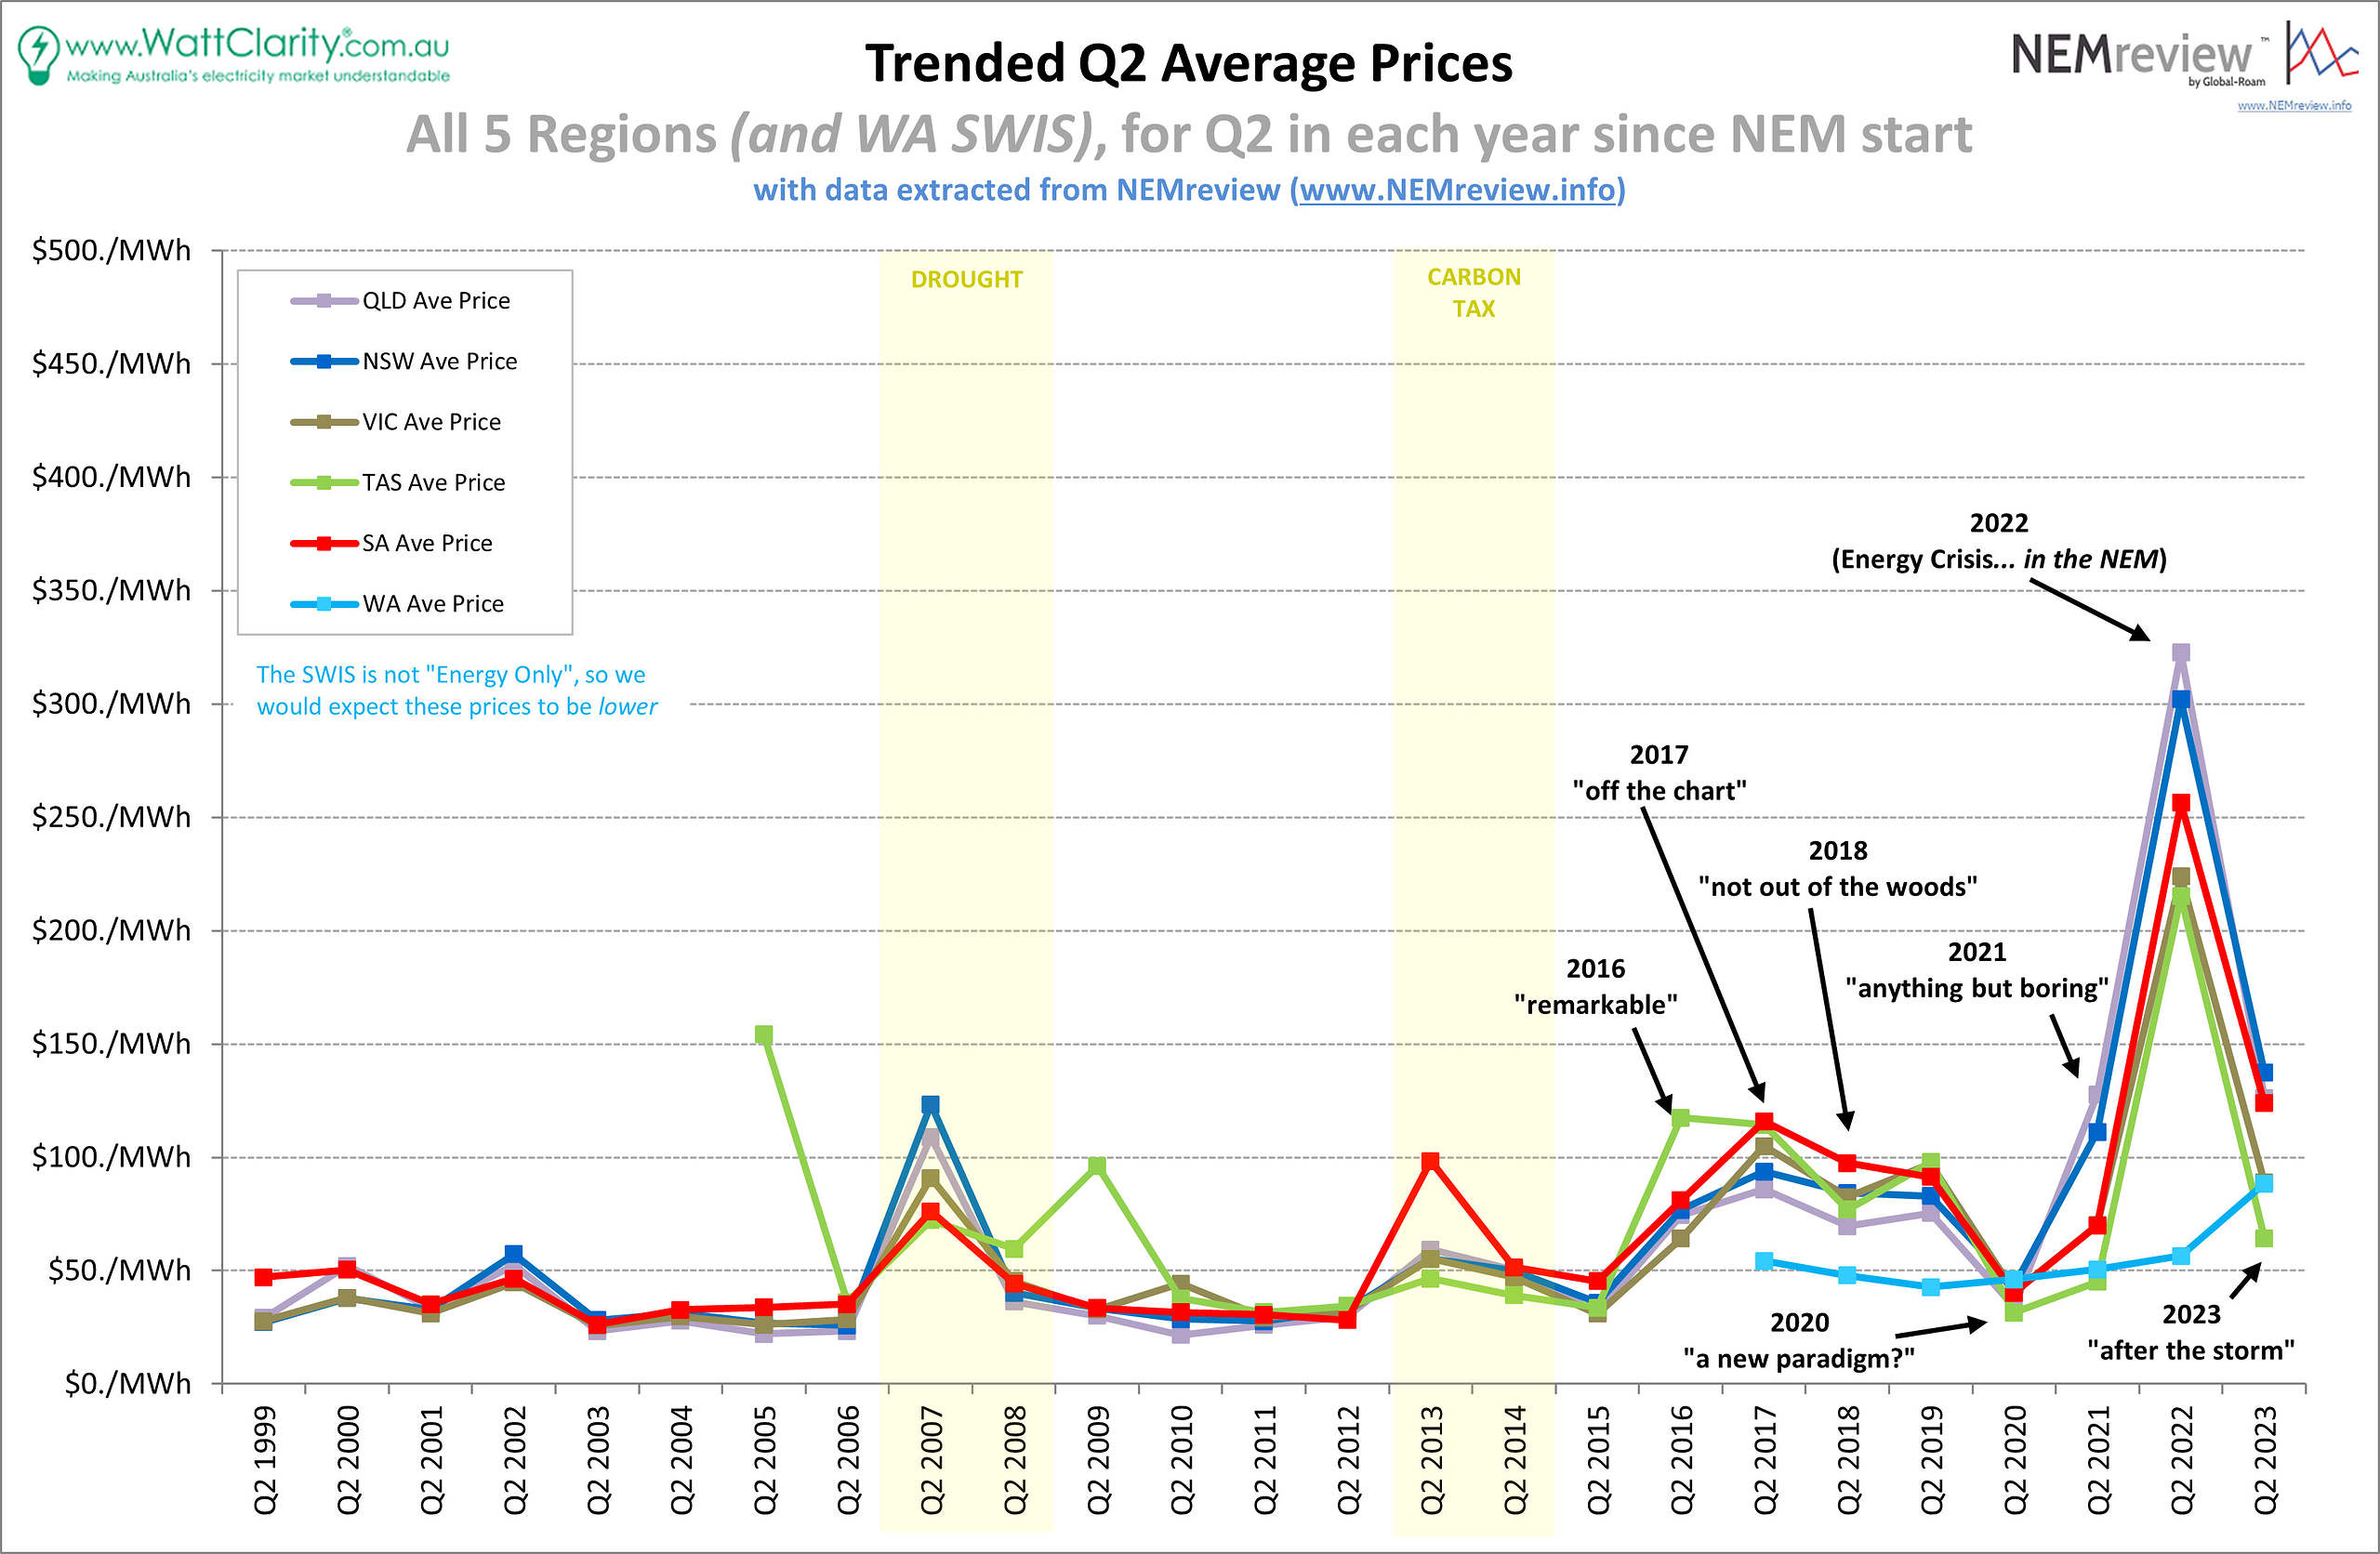
Trended Average Price for Q2 for each region
Source: NEMreview
The chart above presents an aggregation of the average prices for all regions so that we can examine the longer-term trends across the NEM and WEM.
Below, we have charted the incidences of high prices >$300/MWh and incidences of negative prices (i.e. ≤$0/MWh). We can see that incidences of high prices by this measure have increased from 2021 levels in all regions (except NSW where it stayed around the same level). Meanwhile, as we noted last year, incidences of negative prices across all regions have been trending upward significantly in recent years.
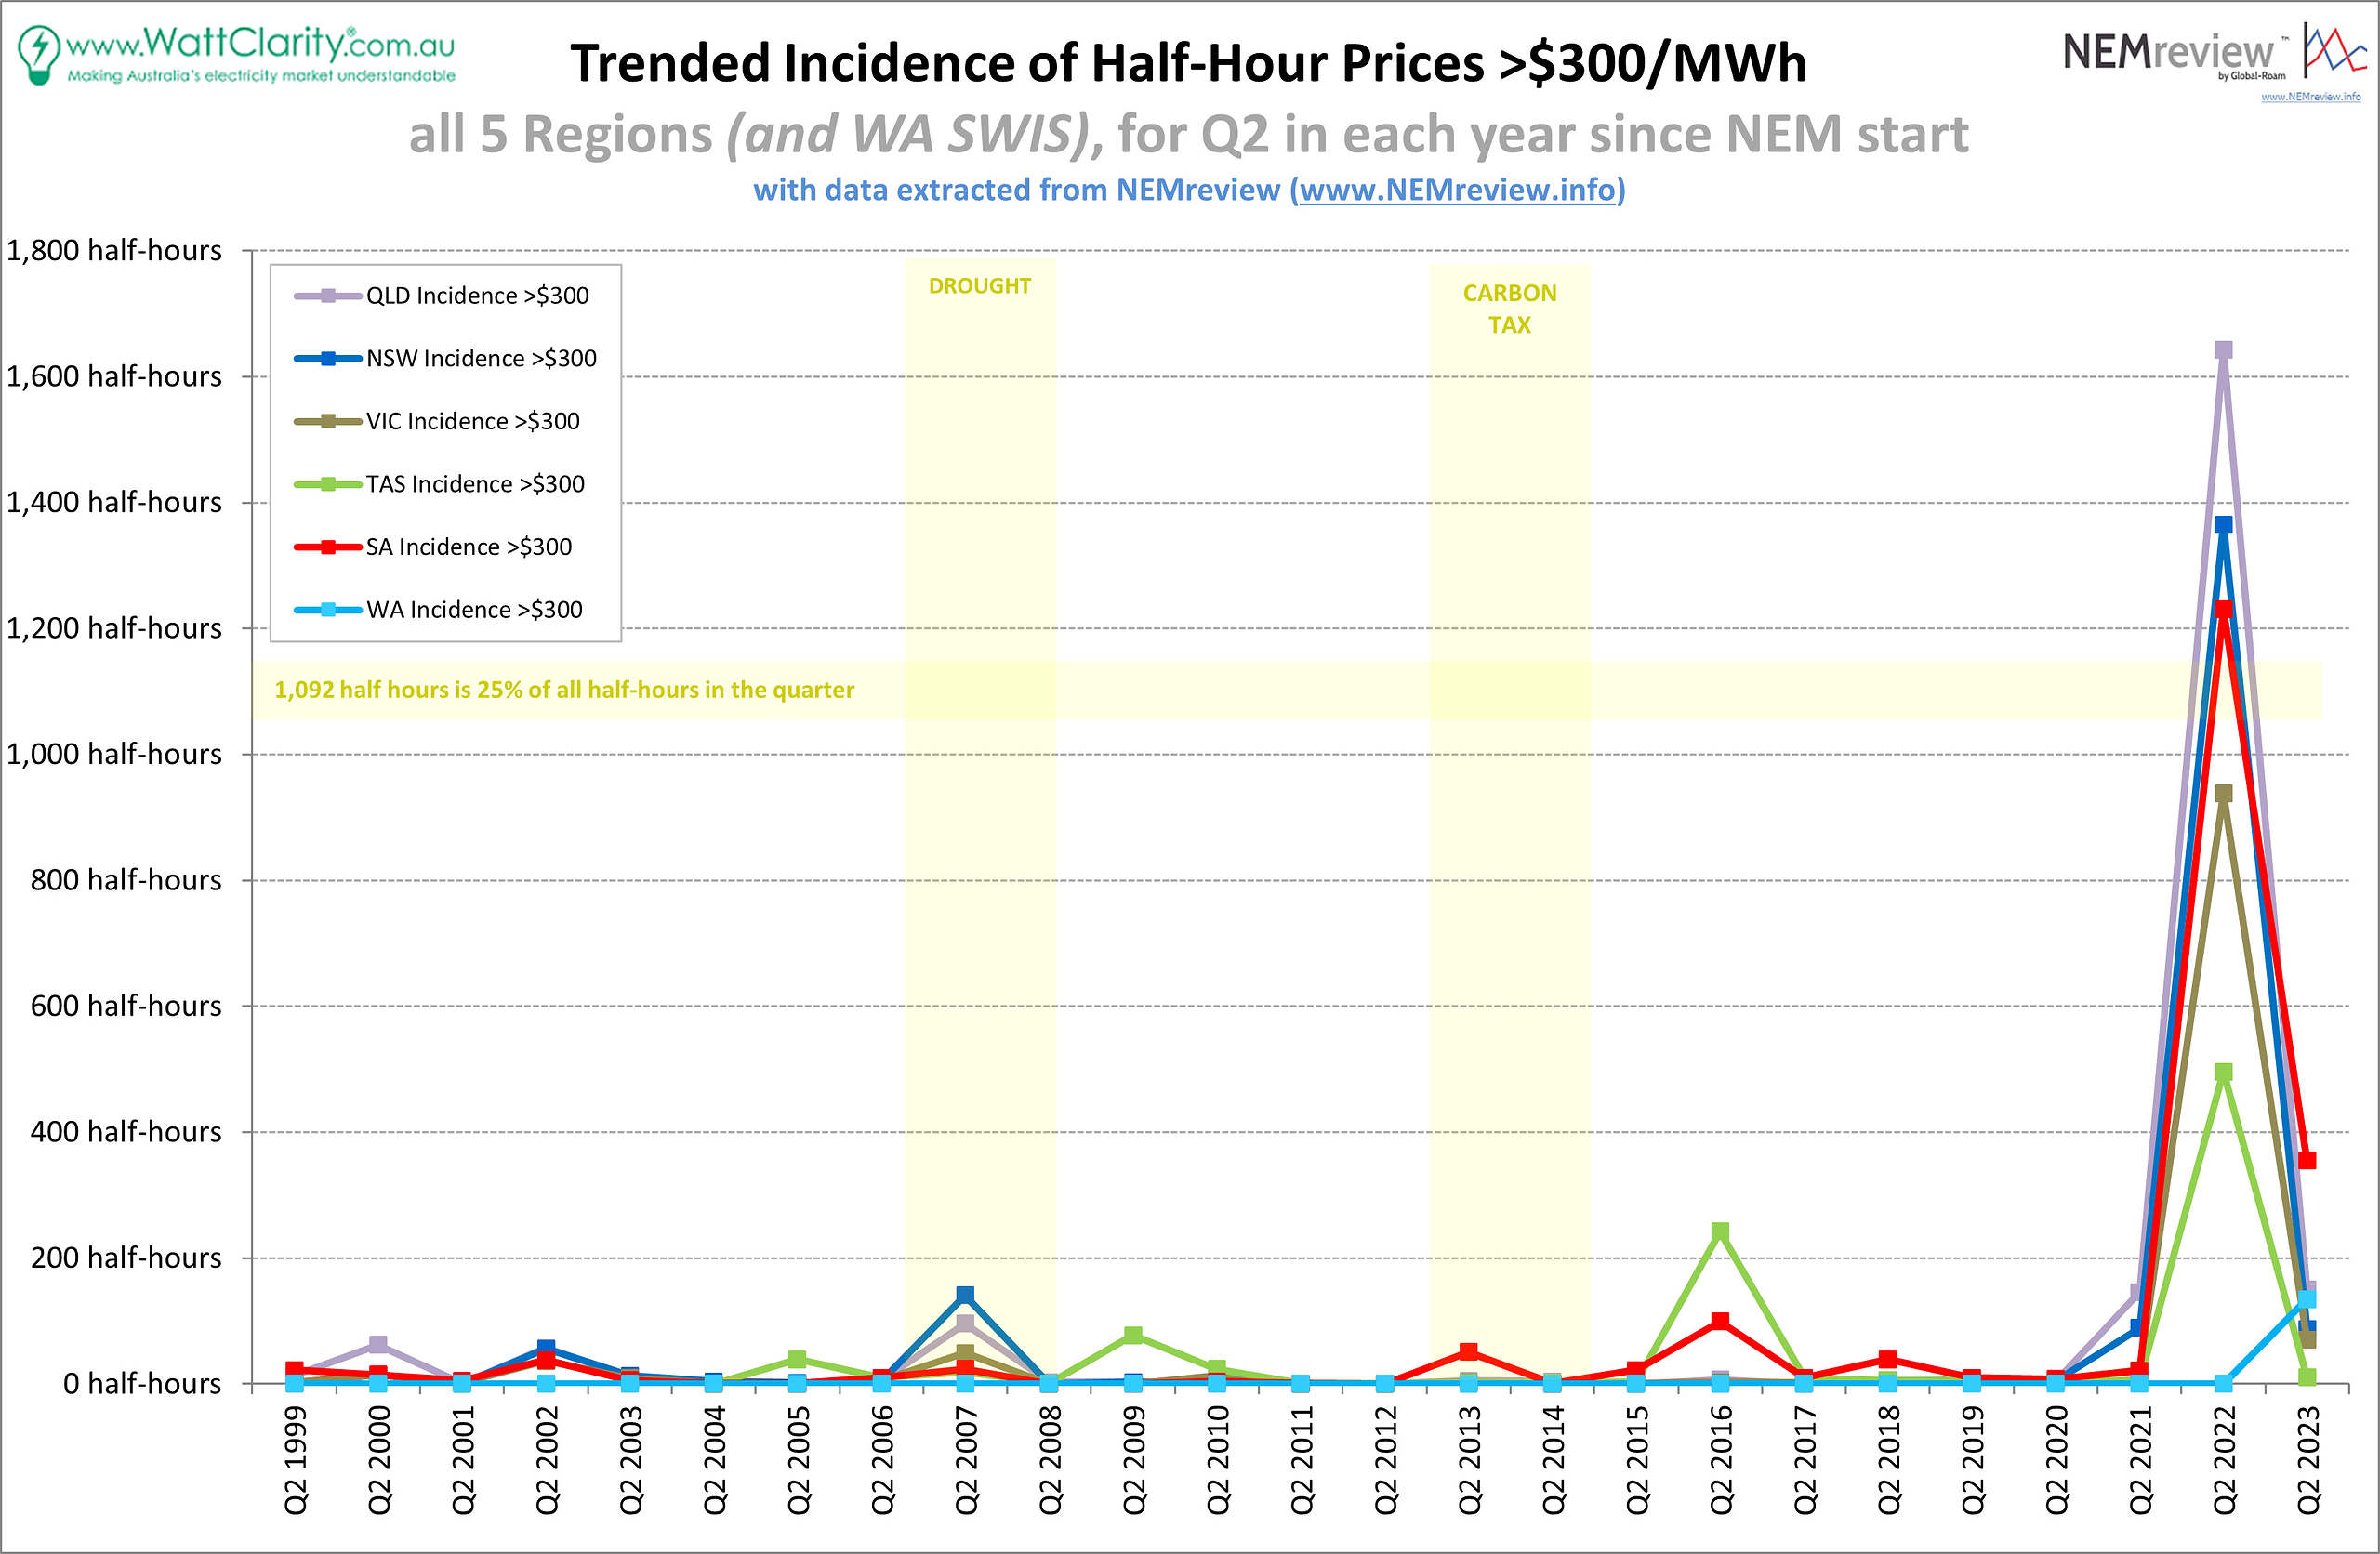
Trended Incidences of Prices >$300/MWh for Q2 Prices for each region
Source: NEMreview
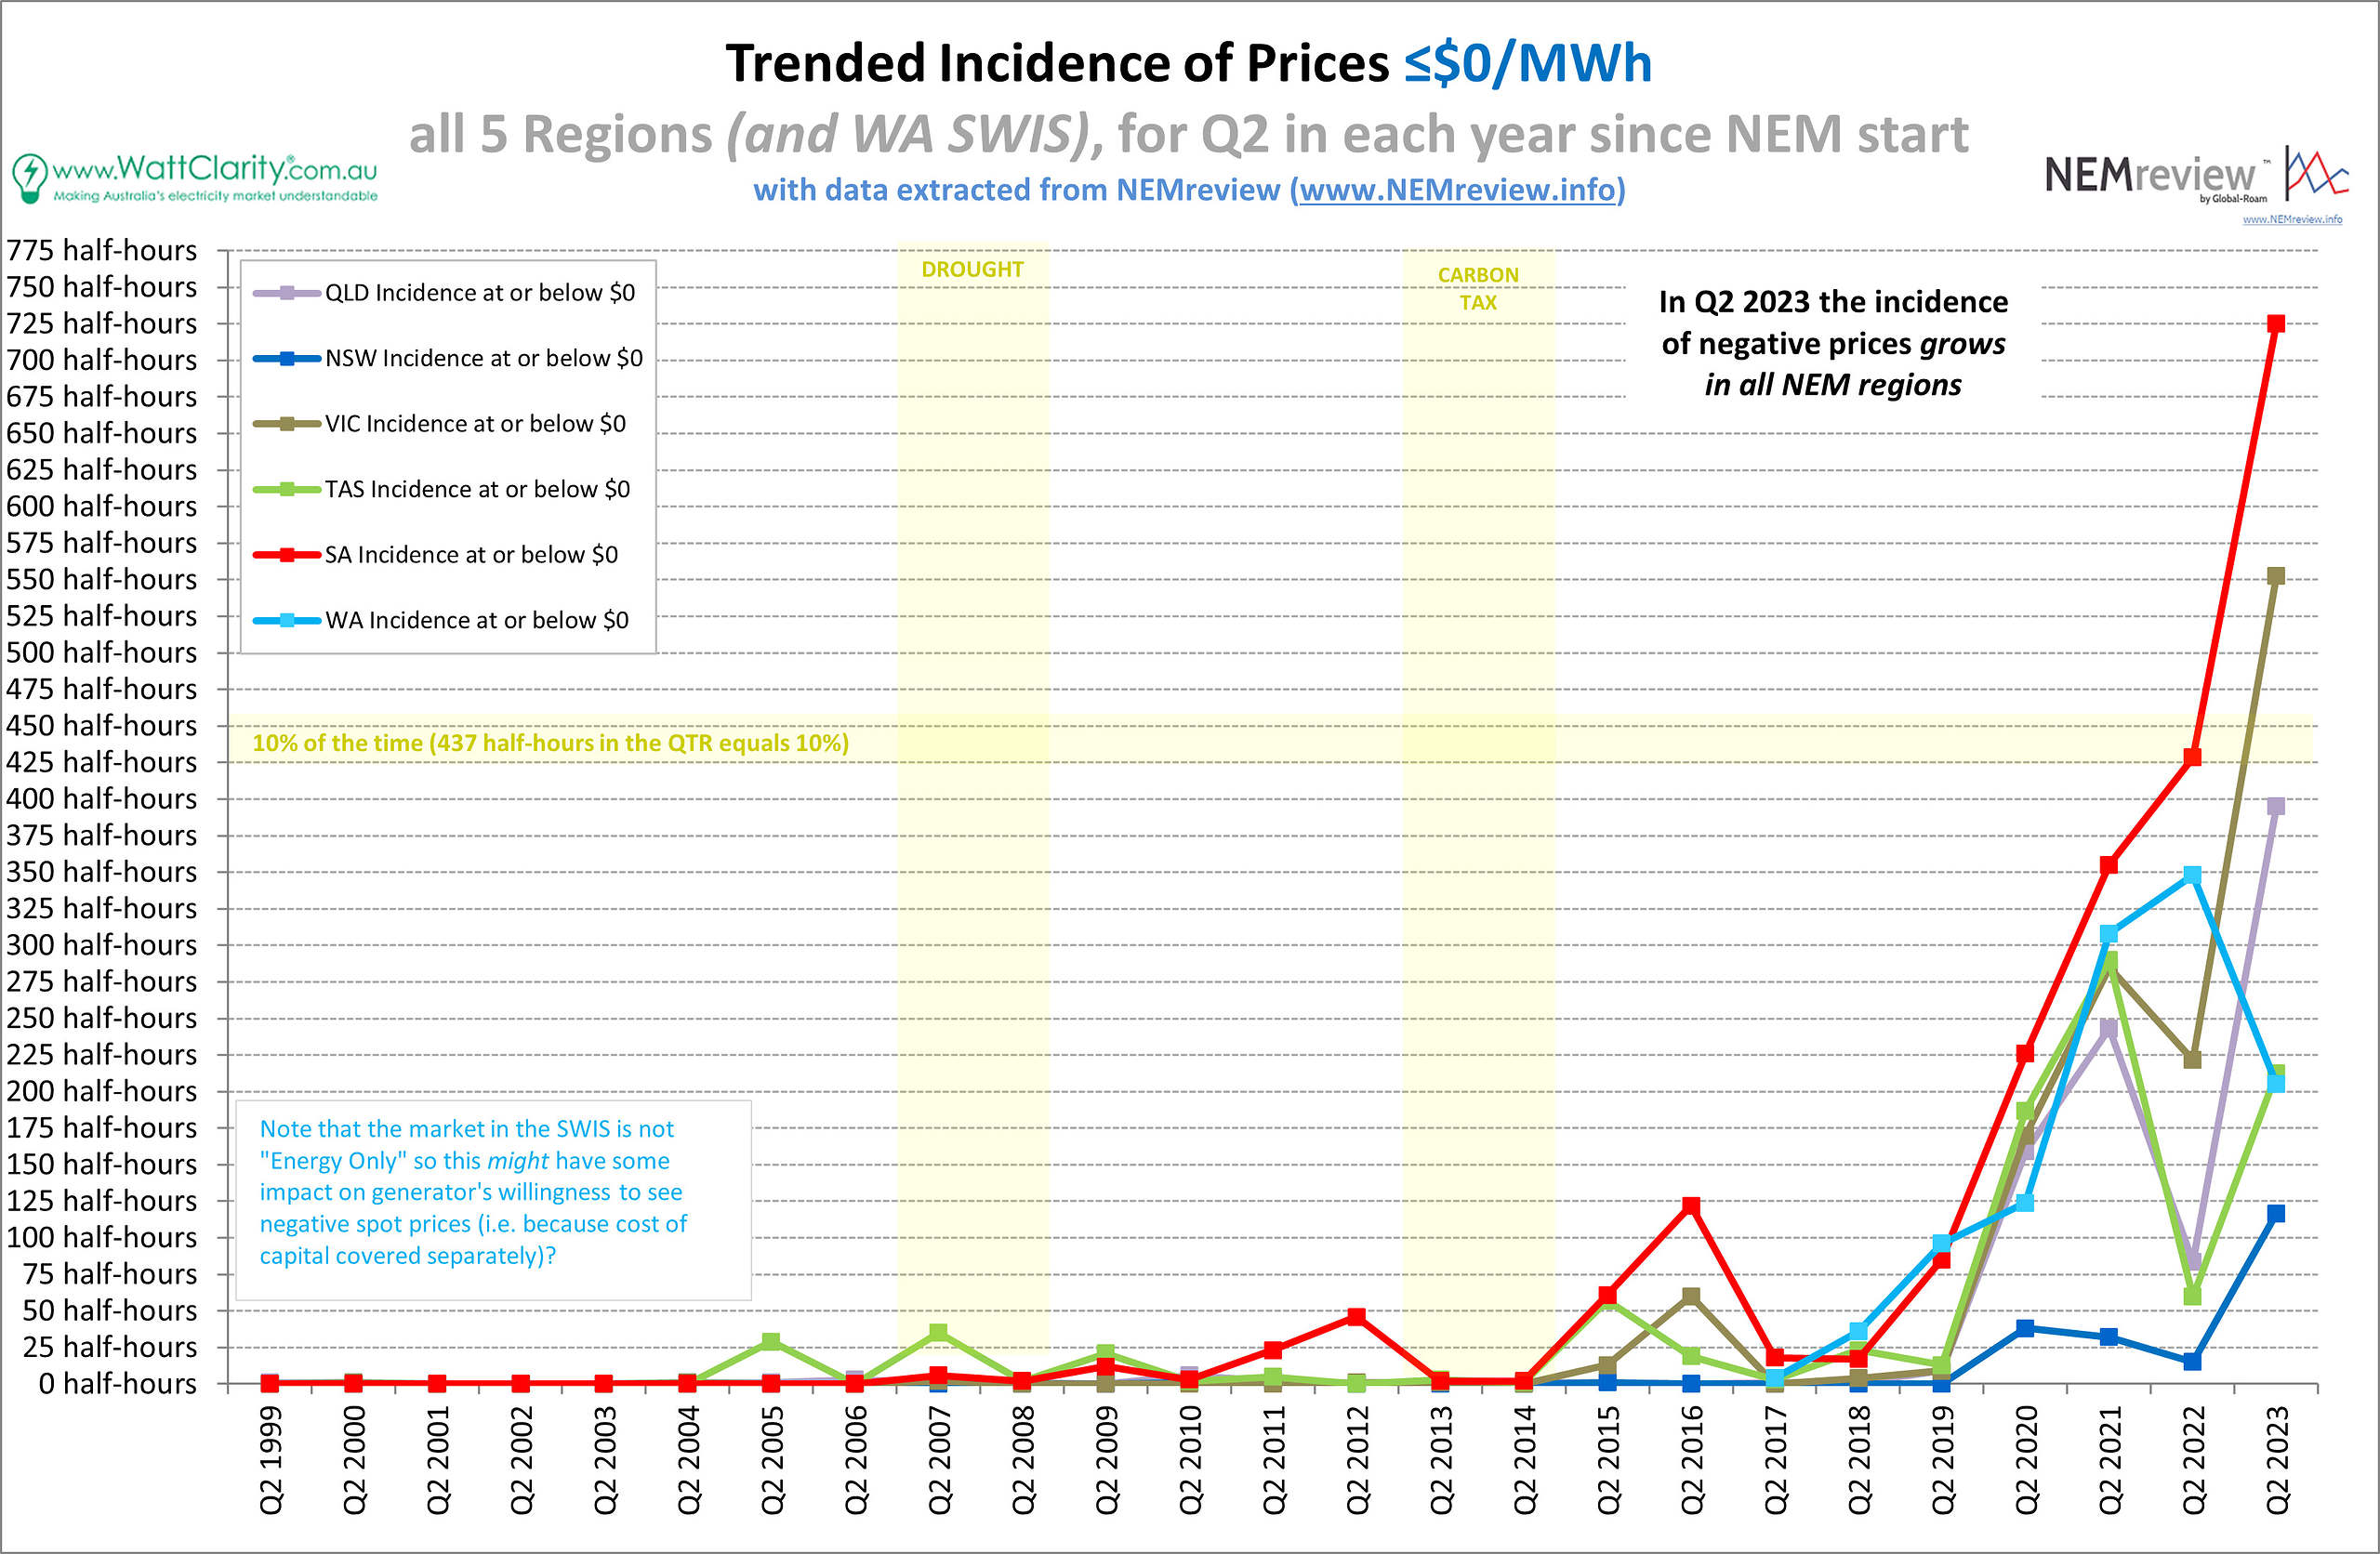
Trended Incidences of Prices ≤$0/MWh for Q2 Prices for each region
Source: NEMreview
Unfortunately this year (again) we have not had time to extend this analysis to look into FCAS prices, but it’s worth stating that ‘ENERGY’ is not the only prices worth examining. Similarly, if time permitted, it would be worth analysing futures pricing to see how actual price outcomes matched earlier expectations for the Q2 baseload contracts as published by ASX Energy.
Key Takeaways
It is hard to compare this year’s Q2 results to Q2 2022 as last year was far from typical for the NEM. But by using 2021 and previous years as a more instructive guide, we can observe the following longer-term trends through the data:
- Incidences of negative prices in Q2 are continuing to increase significantly from previous years. As incidences of >$300/MWh prices are also generally trending upward, I would surmise that this represents the widening gap between high and low price periods (and their frequency).
- Our duration curves are flattening more horizontally in VIC and SA, and having steeper slopes in QLD and NSW. The difference in these shapes, and the difference in average price outcomes, may be linked to increasing constraints on the VNI interconnector coinciding with periods of higher prices in the two more northerly regions.
- Even if we ignore last year’s extreme pricing outcomes as an outlier, time-weighted average prices for Q2 are still trending upward in QLD, NSW, and SA whilst remaining slightly more steady in VIC and TAS.
The last graph is an eye opener. Presumably due to wind and solar so it’s only going to get worse. How can negative wholesale pricing be transferred to the retail sector?
Good charts thanks as always Dan. I wonder if it’s time to update the threshold for the incidence of spike prices graph from $300. In think this year is being dominated by prices in the $300-$400 range which are no longer reflective of a spike.
One approach to maintain historical consistency could be to use an inflating threshold.
All the best.
Take a high level view and nothing terribly is surprising here. Volatility and slow uptick in average pricing started in 2017 with the retirement of Hazelwood. As wind and solar render the economics of traditional generation unviable and more exit the market both volatility and average price will get worse as holes are plugged with higher SRMC sources (gas and diesel). The “fat” of spare generation is just about gone. Throw in the outage at Callide (though this is tempered by transmission constraints) and the trend is clear. The WA situation is also clear. 200MW of coal was retired prior to the summer of 2022/23 and the coal industry in WA (a non export commodity) lurches towards collapse on shrinking sales volumes, there was more energy produced from gas than coal. (WA already was second only to SA in terms of gas for generation). Indeed for several months it has become almost normal to see diesel burnt on weekday evenings to maintain reserve requirements. WA has a capacity and energy market with regulated domestic tariffs so the price volatility that would otherwise occur is well hidden in the red ink in the Government owned retailer’s books. The actual volume of energy traded in the STEM in WA (the number you have interpreted here as the wholesale price) is proportionally very small.