This article (Part 3) follows on from an expanding Case Study pertaining to the 17:05 Dispatch Interval on Thursday 27th October 2022. So far we have published:
1) Part 1 on Thursday 9th March 2023 (looking at a macro perspective).
2) Part 2 earlier today (Tuesday 14th March 2023), looking at individual DUIDs and constraint equations.
What’s particularly of interest in this dispatch interval, is that we calculated an Aggregate Raw Off-Target measure of +871MW across all of 152 x Semi-Scheduled (i.e. Wind and Solar) units operational at the time. That’s a large size collective deviation away from target … and the second largest that’s ever occurred for Semi-Scheduled units, collectively.
The largest-ever instance (at +894MW):
1) Occurred in the extraordinary circumstances when multiple wind farms simultaneously tripped (due to incorrectly configured protection settings, subsequently fixed) as the lead-in trigger cascading into the SA System Black on 28th September 2016.
2) So the relative nearness of the more recent large excursion (only 23MW lower) provides some guide to the considerable significance of the event on 27th October 2022, albeit that (as noted here), the two events are not identical:
(a) The spread of the large excursions was much greater (not just in SA), as seen in Part 1; and
(b) It is almost* certain that the time-span of the event was slower (not instantaneous simultaneous trips).
* can’t be absolutely certain until we actually look at higher-speed data, but seems highly likely
This case study follows on from the article ‘Some revelations in GenInsights Q4 2022 about Aggregate Raw Off-Target for Semi-Scheduled units’ which noted ongoing escalation in the incidence of larger collective deviations away from Target (i.e. ‘Aggregate Raw Off-Target’ ) across all operational Semi-Scheduled units. That article drew from data compiled earlier for the GenInsights Quarterly Updates for Q4 2022.
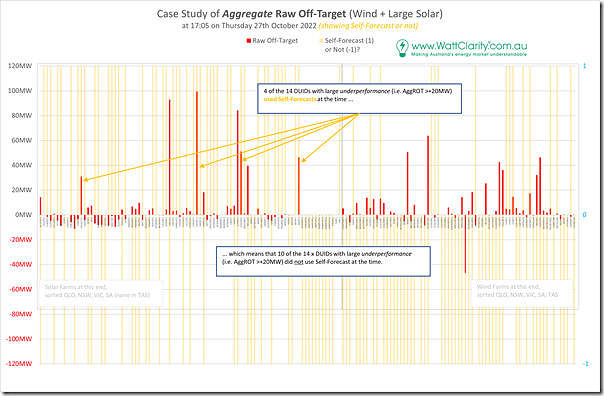
Given our growing interest in the source of the availability forecast used in NEMDE (i.e. whether a self-forecast, or the ASEFS/AWEFS forecast* from AEMO, or via another method) we thought it would be worth illustrating in the chart below:
* noting that ASEFS and AWEFS were upgraded from 23rd November 2022 … but this is after the time point of this Case Study, so not material here.
In this chart we have (for clarity) set a self-forecast as +1 and any other source as –1:
With respect to this chart we can see that:
1) There is a split:
(a) 5 units (of the 15 large deviations) reference Self-Forecasts,
(b) 10 units (of the 15 large deviations) reference another method (including ASEFS/AWEFS ).
2) Of particular note is that the two largest deviations of under-performance at nearby solar farms were split:
(a) The Darlington Point Solar Farm, not using a self-forecast, was under-performing to the tune of 93MW; whereas
(b) The Limondale 1 Solar Farm, was using a self-forecast, and was under-performing to the tune of 99MW.
… note in Part 2 that their pattern of under-performance showed similarity.
So this small piece of analysis highlights that under-performance (or rarer over-performance) can occur regardless of the source of the forecast Availability … but we’d need to look at many more dispatch intervals to have any chance of seeing any pattern.


Leave a comment