This will be a long Case Study that will be posted in several parts over a number of days … this is just Part 1.
There are a number of pieces of information to convey in this Case Study, and analysis is continuing as well – so we’ll post them in sequential parts, starting with an overview of this particular event.
Earlier today we posted the article ‘Some revelations in GenInsights Q4 2022 about Aggregate Raw Off-Target for Semi-Scheduled units’ which noted ongoing escalation in the incidence of larger collective deviations away from Target (i.e. ‘Aggregate Raw Off-Target’ ) across all operational Semi-Scheduled units.
Two examples were provided of exceedance in either direction:
Incident #1) On 27th October 2022 (at 17:05) we see a collective under-performance on the part of the Semi-Scheduled units totalling AggROT = +861MW (remembering that positive numbers are under-performance, because of the way the calculation works).
Incident #2) On 23rd August 2022 (at 13:15) we saw a collective over-performance on the part of the Semi-Scheduled units (totalling AggROT = –650MW).
With the exception of the extreme case of simultaneous wind farm trips leading into the SA System Black, the deviations were not this large several years ago … and (unless something changes) they look set to continue to grow larger in future.
In this Part 1 of Case Study, and what follows, we’ll investigate further Incident #1.
You’ll need to wait until significantly later for us to investigate Incident #2 (or you could do this yourself, if you have the data).
(A) Two hours on 27th October 2022 containing the event
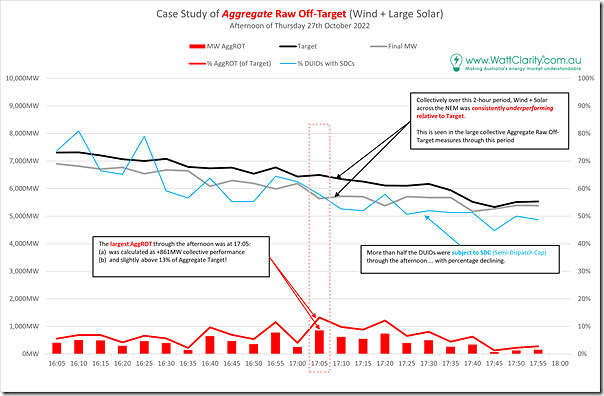
I thought we’d start by having a look at the Aggregate Raw Off-Target measure for Semi-Scheduled plant for a two hour period (i.e. 16:05 to 18:00) that has the period of interest squarely in the middle:
… noting we did not extract data either side, so this means we can only compare Target to Actual for 23 dispatch intervals.
Here is what we found:
A couple quick thoughts:
1) Of the 23 x Dispatch Intervals shown through the late afternoon period, every single one shows sequential collective under-performance of Wind and Large Solar.
2) The collective deviation at 17:05 (+861MW) calculates at above 13% of the Aggregate Target.
3) Whilst 17:05 is the largest collective deviations, many of the others are quite large as well.
4) The percentage of units with Semi-Dispatch Cap flagged:
(a) Trends down through the afternoon;
(b) But remains above 50% for 21 of 24 dispatch intervals.
5) Whilst 23 dispatch intervals are not a large sample size (considering there are 110,000 dispatch intervals in the year) there are some troubling signs worthy of further digging.
… there are other things apparent in the above, but we’ll leave that for later.
(B) Status of 152 DUIDs at 17:05
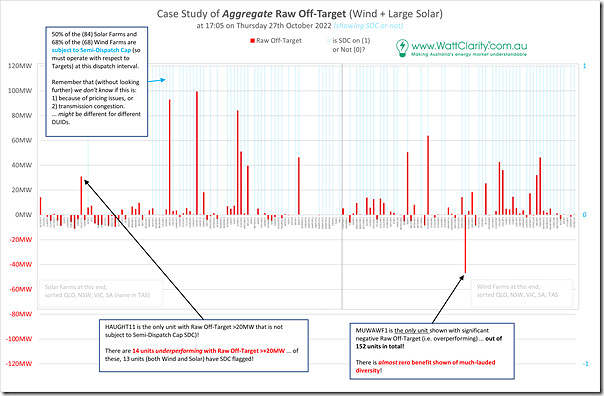
In the second chart in Part 1 of this Case Study, we look specifically at the 17:05 dispatch interval and our calculated ‘Raw Off-Target’ value for each of the 152 Semi-Scheduled DUIDs that received a Target for that dispatch interval.
A couple quick notes first, though:
1) In earlier case studies about AggROT, we’d show a tabular view … but there are simply too many DUIDs now to make that manageable, so have flipped to showing a chart.
… this has the added advantage of making the significant deviations really stand out.
2) Remember what the number sign means:
(a) Under-performance with respect to Target (and FCAS Regulation enablement) is shown as a positive number;
(b) Whereas over-performance with respect to Target (and Regulation FCAS enablement) is shown as a negative number.
3) If you click on the chart it will open as a larger-resolution image:
(a) … but even then it’s difficult to read so many units
(b) We’ve organised the chart with Solar Farms on the left, and Wind Farms on the right (more solar farms than wind farms) and grouped them:
i. Firstly by region (QLD, NSW, VIC, SA, TAS)
ii. Then alphabetically
(c) we’ll look at some specific DUIDs in Part 2 of this Case Study.
4) Finally, worth noting there are 158 units shown here (though good luck counting them all), because that’s how many there were operating as Semi-Scheduled when this analysis was done (i.e. March 2023) … but only 152 units were operating in October 2022 … so the 6 new units are shown as 0MW ‘Raw Off-Target’.
With all of that as background, here’s the graphical representation:
There’s a couple big, high-level observation that we can make:
1) There are many more large positive deviations (i.e. under-performance) than there are over-performance (negative deviations).
2) The large deviations …
(a) cover both Solar Farms and Wind Farms;
(b) and are spread across regions.
3) A number of them are quite sizeable …
(a) 14 x DUIDs show under-performance deviations above 20MW (some approaching 100MW);
(b) 1 x DUID showing over-performance deviations below –20MW
4) Indeed, there are many fewer units in total showing over-performance (even small) than under-performance (even small).
… whilst one dispatch interval is a very small sample size, it does make one wonder about the extent to which there is an artificial skew occurring (and, if so, the implications of that)?
5) Many units are subject to Semi-Dispatch Cap:
(a) 50% of the Solar Farms are affected;
(b) 68% of the Wind Farms are affected.
… readers should keep in mind that the SDC might be triggered because of network congestion or because of economic reasons (e.g. low prices with DUIDs bidding to seek to avoid). In Part 2 of the Case Study we’ll start looking into more detail.
6) Of the 15 units showing sizeable (i.e. more than 20MW) deviations:
(a) 13 were subject to Semi-Dispatch Cap;
(b) Whilst 2 units were not.
… will need to think more about the significance of that (or is it just coincidence?)
That’s where we will leave Part 1 of this Case Study. Stay tuned for Part 2…


Leave a comment