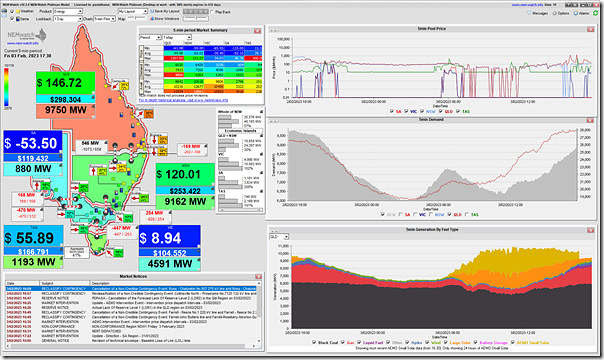
Despite the prior expectations that it might be as 10,656MW (P30 forecast for 14:30 this afternoon, noting the worm turned around that time), this NEMwatch snapshot for the 17:30 dispatch interval shows the Market Demand is ‘only’ at 9,750MW:
So:
1) Still well up in the ‘red zone’;
2) But 369MW below the all-time maximum (up at 10,119MW back on 8th March 2022); and also
3) A massive 906MW below the most extreme forecast (I saw in a quick scan) for what it might have been (i.e. 9.2% on the current level).
—
Note that the maximum level of Market Demand today appears to have been 9,806MW at 16:55 … so prior to the 17:30 dispatch interval shown above. For those comparing different stats, keep in mind that Market Demand is different to Operational Demand (which AEMO increasingly speaks about) in important ways.
—
Shows the inherent difficulty of forecasting electricity demand … with pesky weather patterns making it difficult…


The weather conditions didn’t seem anything like a record, so it would have been disappointing if a record Market Demand had occurred. The Market Demand was only 3% or so short of the record. There are so many variables in the mix for these records, weather, changes in work patterns (more people working at home), fewer international students and lower tourist numbers than pre Covid.
There does appear to have been a better level of self consumption of rooftop solar than there was under similar conditions say four years ago. This is a good result for the grid as a whole. Further improvements would be obtained if all residential customers were moved to a wholesale linked tariff.