Last Friday evening in scanning the news in a number of different sources, this headline jumped out at me:
Writing in the AFR in the lead up the AFR’s own energy-focused conference this week (tomorrow and Tuesday 11th October in Sydney), Angela Macdonald-Smith writes that:
‘Australia has almost run out of time to head off an energy transition “train wreck” with action on policies to spur investment in firming capacity and achieve emissions targets lagging ever further behind what is needed, according to one of Australia’s leading energy bosses.
Alinta Energy chief executive Jeff Dimery said announcements last month of earlier coal power station closures by AGL Energy and the Queensland government and higher but sometimes “hollow” targets for renewables and storage have him worried, with consumers to pay the price.’
… and continues, (in addition to Jeff Dimery) to also nominate Mark Collette, Frank Calabria and Tony Wood amongst those concerned about the current trajectory towards failure.
(A) Different personality types
Having graphically illustrated that same looming train wreck over 5 years ago now, I’m still in the pessimistic camp … despite the fact that there’s been a number of positive developments arising in the period since that time.
With respect to this general prognosis:
Type 1 = I am aware that, whilst I’m looking at the situation with a ‘glass half empty’ perspective (so the headline of that AFR article resonated with what I’ve been thinking) …
Type 2 = … there are others who are more optimistic about the chance of avoiding disaster (e.g. in his review of GenInsights21, David Leitch writes that he’s more on the optimistic side).
I’m also aware, as Gary Larsen illustrated with his ‘Four Personality Types’ cartoon, there are other people who don’t fit in either perspective:
Type 3 = Some perhaps unable to make up their mind;
Type 4 = Whilst the 4th type have surely found their home on social media …
For me …
1) The past 5 years since speaking at Clean Energy Summit 2017 has reinforced my pessimism;
2) Whilst the 2022 Energy Crisis (which was primarily due to factors related to the thermal fleet) demonstrated sufficient other factors involved (including weather affecting both old and new) to ring warning bells about the road towards the ‘net zero by 2050’ destination.
(B) Looking specifically at Loy Yang A power station
Let’s take a relatively obvious case of planning for the accelerated retirement of AGL’s Loy Yang A power station.
On Thursday 29th September 2022 AGL announced it would bring forward the retirement date by about a decade to close by the end of the 2035 financial year. Later in this summary article on WattClarity, we added in links to just some of the large amount of commentary we’ve come across via news media, from industry organisations and in a number of other sources.
In this AGL Energy Media Release, they note that:
‘AGL aims to progressively decarbonise its asset portfolio with new renewable and firming capacity, with an ambition to supply its customer demand with up to 12 GW of new generation and firming capacity, requiring a total investment of up to $20 billion, in place before 2036, funded from a combination of assets on AGL’s balance sheet, offtakes and via partnerships.
This includes an interim target to have up to 5 GW of new renewables and firming in place by 2030 ’
My reading of the AGL ambition is that:
1) The scale of development quoted (i.e. ‘12GW of new generation and firming capacity’) …
2) … would be needed to replace the ‘lost’ production from both Loy Yang A (now closing by 2035) and Bayswater (closing by 2033).
So readers should keep in mind the difference here in this article, in that I’ve intentionally just simplified things in comparing:
Comparison Set 1) The Loy Yang A power station (4 units); and
Comparison Set 2) All of the installed large-scale VRE in Victoria built to date:
(a) Which is Wind Farms (40 units) and Large Solar Farms (10 units);
(b) So 50 x VRE units in total.
—
With respect to the comparison, keep in mind what we wrote about ‘the schism’ in GenInsights21 (particularly Key Observation #2) and earlier in the GRC2018 (particularly Theme 5 of 12 within Part 2). Using the same framework we can separate out the various services that Loy Yang A currently supplies to the NEM into the two ‘Service Type’ bundles:
Service Type #1 = ‘Anytime/Anywhere Energy’
We coined the term ‘Anytime/Anywhere Energy’ in 2018 to describe the form of support for variable renewable energy that took form in the Mandatory Renewable Energy Target and rooftop PV feed in tariffs, but has since been propagated through many (if not all?) of the state-based renewable energy targets.
… our concerns about the long-term implications of this form of support, not just in terms of physical capacity being deployed, but also in terms of a deficit in organisational capability being developed was one of the reasons why I was interested to hear James Allan’s thoughts about one possible method for addressing some of this.
But with this simple comparison, let’s simplify it further by (in this article) just comparing the gross energy production of our two comparison sets.
B1a) The dubious practice of simply comparing installed capacity
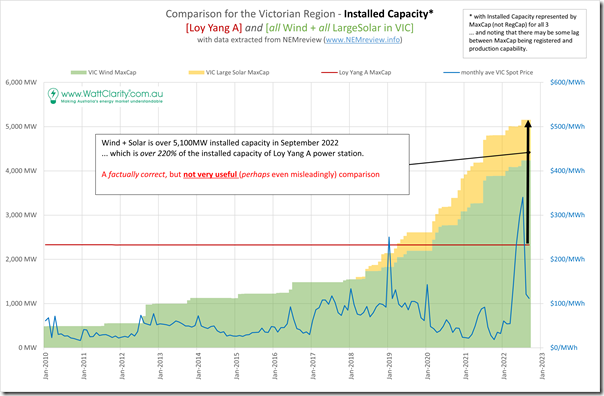
It was quite frequently the case back in 2017 (when speaking this warning), and is still occurring depressingly frequently that we’ll see too many people publish a chart like this to compare growth in capacity of VRE with capacity of the older fossil-fuelled plant that it’s being designed to (at least in part) replace:
In my version of this chart I’ve stacked the Installed Capacity* of Wind & Large Solar to see its growth over time. Victoria has significantly more Wind capacity installed than Large Solar capacity.
* with respect to Installed Capacity, remember this recent ‘capacity ain’t capacity’ explanation, and note that I’ve chosen to show Maximum Capacity for Wind, Solar and Loy Yang A.
Readers could read this chart and see that the growth of installed wind and solar capacity across the Victorian region was such that it exceeded (in aggregate capacity terms) the installed capacity of Loy Yang A in early 2019, and is now more than double the installed capacity of Loy Yang A.
… however those readers who erroneously read from this chart that installed capacity of large-scale VRE across Victoria is ‘doing more than’ what Loy Yang A is producing, are unfortunately quite misinformed*. That’s even the case just in terms of bulk energy … before we even start to consider all the other ‘Keeping the Lights on Services’ discussed briefly below.
* For those who still do this (or still don’t know why charts like this are of very low value, in the first instance) it might be worth this refresher on how a megawatt is a rate and a megawatt-hour is a volume.
Readers here might like to keep watch for this type of false equivalence comparison in the weeks and months ahead, as new VRE projects reach financial close and are (all too frequently) compared to the capacity it’s being built to replace, rather than its expected energy generation.
B1b) A much more useful comparison
We’ve established in various pieces of analysis (such as in Appendix 15 about ‘Aggregate Scheduled Target’ within GenInsights21) that any reliability benefit of any/all installed VRE capacity is quite low … and this conclusion has been supported by many others, including market operators, across the world. The prime purpose and benefit of this VRE is bulk energy of a low emissions form.
Therefore it’s been my view for a long time that VRE projects should be primarily referred to in terms of expected MWh production, rather than* MW installed capacity.
* there are a couple reasons why Installed Capacity might still need to be mentioned as a lesser metric – such as to do with cost of installation ($ per MW installed) and size of peak output onto the grid (hence cost of network connection) – but these are subsidiary to bulk energy production, in my opinion.
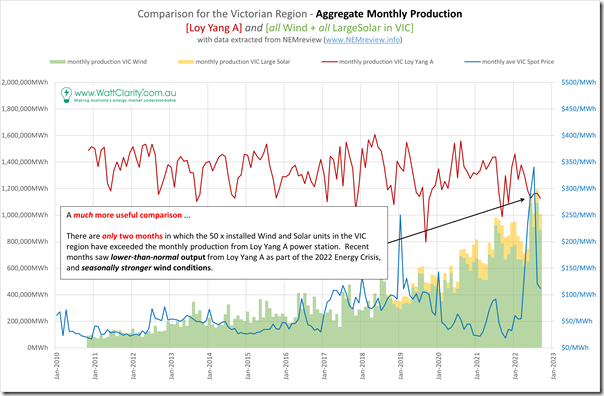
It would be much more useful if comparisons of Loy Yang A were presented in the form of MWh produced, as we have done here in this second chart:
To be clear, both charts above are factually correct – but the second one presented here is a much better reflection of the challenge faced in replacing the bulk energy now produced by the Loy Yang A power station … all before 2035!
B1c) Back to the AGL announcement
In the AGL announcement they talk about replacing Loy Yang A and Bayswater with ‘12GW of new generation and firming capacity’ … in re-reading the AGL announcement I did not see:
1) What split they envisage between VRE and firming capacity; and
2) Of the VRE capacity …
(a) what will need to be in VIC (to replace Loy Yang A); and
(b) what will need to be in NSW (to replace Bayswater).
Did I miss something?
Comparing the two charts above we see that the more than 5,000MW of installed wind and solar capacity in the Victorian region has only produced more bulk energy than that produced by Loy Yang A in two months in history:
1) June and August 2022, after further growth in capacity; but also
2) When wind production was seasonally high; and
3) Where Loy Yang A production was depressed compared to its historical performance.
… so it should be clear that there will need to be well beyond 5,000MW of additional VRE capacity built in Victoria in the next 10 years just to cover ‘normal’ monthly production from Loy Yang A allowing for more average wind and solar conditions across a full calendar year.
1) Considerations from a Victorian bulk supply perspective
If we put on a ‘Victorian region bulk supply’ hat, it’s important to remember that this bulk energy additional supply from VRE will need to be on top of whatever needs to be built to replace Yallourn Power Station.
… this, of course, does not include any consideration of the network to connect it our, or the additional ‘Keeping the Lights on Services’ that will also need to be built in various forms.
2) Considerations from an AGL Energy portfolio perspective
If we put on an ‘AGL Energy portfolio’ hat, thinking about just replacing Loy Yang A and Bayswater bulk energy conjures up a size of (just) additional VRE capacity that gets up towards the 12GW level which AGL has notionally identified for both VRE and firming capacity.
… I wonder if there’s actually enough scope in that installed capacity for all that’s going to be required to replace both large stations?
—-
Very simplistically (so lots of caveats!), a back-of-the-envelope calculation is as follows:
1) Remembering again that the reliability benefit of VRE capacity is quite low … so the dispatchability benefit of Loy Yang A + Bayswater might need to be replaced by something like 5GW of new firming capacity (i.e. summing the installed capacity of the 8 x retiring coal units … not thinking at all about the 3 remaining still to go by Q2 2023 at Liddell)
2) 12GW – 5GW = 7GW remaining for new installed VRE
3) Which (i.e. 7GW) perhaps might replace Loy Yang A in all but ‘bad wind’ months, like the wind drought of June 2016.
4) But does not seem likely to replace Loy Yang A and Bayswater, even on a good sun/wind months.
Conclusion – unless AGL Energy is planning to reduce its share of bulk wholesale energy supplied (i.e. perhaps through some rooftop PV and so on) the 12GW new capacity number seems too low for what would be required to replace both Loy Yang A and Bayswater.
—-
Service Type #2 (multiple) = ‘Keeping the Lights on Services’
The essential companion to the ‘Anytime/Anywhere Energy’ component discussed above is a bundle of many discrete services that we bundled under the label of ‘Keeping the Lights on Services’.
There are a number of these services currently supplied by Loy Yang A that would not replaced by straight substitution with VRE capacity – which is why it’s necessary for AGL to also include ‘firming capacity’ in the bundle of 12GW that they wrote about in their Media Release quoted above.
1) Dispatchability is only one of these services, along with firmness, inertia, system strength, FCAS provision and so on.
2) We might, at a future point in time, think more about this bundle of service and the accelerated Loy Yang A closure.
More for another time…
PS1 on Tuesday 11th October – discussion on Social Media
Readers here might appreciate the conversations emerging on social media, as follows:
1) Arising out of this thread on Twitter;
2) Arising out of this thread on LinkedIn … and others there as well started by other readers.
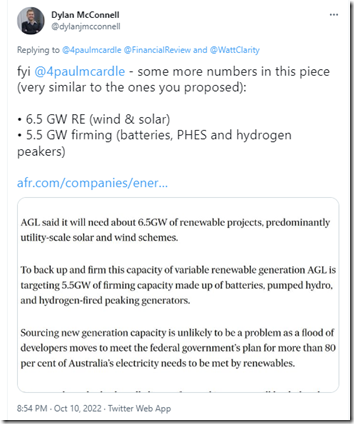
In particular, On Monday 10th October Dylan McConnell’s added some more context here on Twitter, referencing the AFR article of the same day ‘We won’t bow to Cannon-Brookes on directors, AGL says’.
PS2 on Thursday 13th October – Cornwall Insight
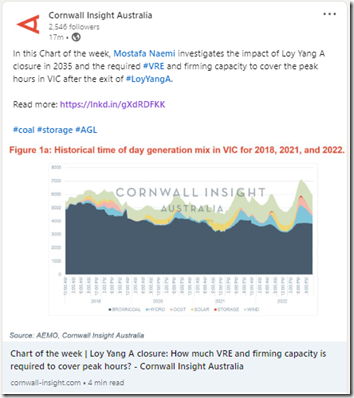
On Thursday 13th October I noticed that Mostafa Naemi had published a piece ‘Loy Yang A closure: How much VRE and firming capacity is required to cover peak hours?’ for Cornwall Insight.
This was the snippet included on LinkedIn:


Paul,
Great articles. I am on the pessimistic side as well.
I hope there are clever people working on supplying reliable cheap power to NEM.
It is disingenuous to report “new generation and firming capacity” in one number, do we assume that is 12GW of firmed generation during all months, or for 4 hours.
Boston et al (2022)* modeled using 10 x Snowy2 schemes storage and still had significant blackout during Winter 2010.
Interestingly the wind drought June 2016 you mentioned does not show up in their modelling.
Would it be possible to only run Coal power from mid-May to July?
Ref: https://wattclarity.com.au/articles/2022/06/seasons-of-low-wind-and-solar-output-will-influence-the-shape-of-the-nem/
Assumes Snowy 2.0 supply 2GW of capacity but 350GWh of storage.
Of course one should be talking in MWh but nut just MWh produced but worst case. So if Loy Yang A produced 16,000 GWh in a normal year we would need enough wind and solar to produce 16,000 GWh in a poor year or about 17,500 GWh at nominal capacity factors. However, capacity factors are increasing due to better controls, better technology etc. So in 2025 an optimally designed solar farm with bifacial panels etc might average 28% and similarly wind farms with taller towers and large rotors should manage 44%. So, to produce 17,500 GWh the system needs 3.2 GW of new wind and 2 GW of new utility solar. In practice behind the meter solar is still the cheapest power so it will continue to expand even if the Victorian government reduces incentives. So by 2035 at least 20% of demand will be provided behind the meter so to replace Loy Yang A you will need about 2.6 GW of onshore wind and 1.8GW of utility solar. At last count between restricted capacity of plants working up and new plants committed Victoria already had 2.8GW of wind scheduled to be online by 2026 and at least 800 MW of large scale solar for an expected addition with new rooftop solar of about 15,000 GWh/y. So that will easily take care of the production from Yallourn 8,500 GWh/y and 40% of LYA by 2026. Therefore, there are nine years to find the balance. If Star of the South is built, it alone should supply 9,000-9,500 GWh per year and ongoing additions of 600MW of btm solar will provide another 6-7,000 GWh. In sum if the only new large scale renewable plant that is built after currently financed plants are completed is Star of the South, Victoria will add 30,000 GWh/y of capacity and close 24,000 GWh. Now it is possible that no offshore will be built, but the idea that there will be little or no new large scale renewables contracted in Victoria for 13 years is completely unrealistic.
The problem with trying to replace coal power with wind and solar is that on windless nights wind and solar deliver nothing. End of story.
https://spectator.com.au/2022/07/energy-policy-where-parallel-universes-are-set-to-collide/
The real game in town is finding a way to keep the coal fires burning until nuclear is up and running. Watch that space!
Britain and Germany are demonstrating the alternative.