
As someone who has been monitoring the NEM for over 20 years, I am continually amazed at the complexity of the bulk power system and its inter-relatedness with everything from supply reliability to environmental considerations and economic prosperity.
The Generator Statistical Digest 2019 (GSD2019 – released today) further enhances this view as it starts to highlight all the nuances of the various generation types, highlighting there is no silver bullet as we transition through different forms of generation supply. Instead of ‘picking a side’ on the generation spectrum which many observers continue to do, I want to continue to draw attention to the need for all forms of generation to continue to be used in a coherent, collective manner at the right time and the right price to ensure we have supply reliability and predictability. The notion of ‘baseload’ and ‘peaking’ are concepts of the past … the information below is how we start to bring the grid of the future together, and it centres around the price received – the market value.
In the GRC 2018, one of the metrics that we spent considerable time developing was around when generation occurs not just the annual quantity. In the GSD 2019, we have taken that to the next level, highlighting how each generation fuel type (and even within the same fuel type) is receiving mixed values of spot market revenue per MW installed, with different volume weighted RRP (compared to time-weighted RRP) and how some generation is being impacted by network constraints more so than others. Each ‘B’ page within the report, for all generation types, includes the following key metrics that start to paint and interesting perspective of the market values of wind, solar and gas fired generation types as coal generation continues to face considerable public pressure.
… Looking at Coal fired generation
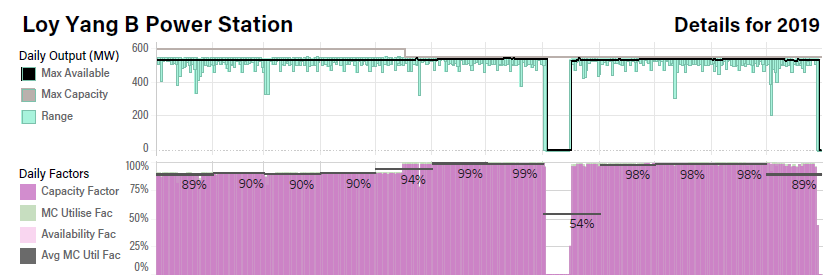
Whilst there is a strong desire from some quarters to ‘shut down coal’, the picture from the GSD paints a continuing reliance on coal fired generation. Alinta’s Loy Yang B1 shows an incredible level of reliability and predictability with just one unit outage through the year, commensurate with it being one of the youngest coal-fired units (commissioned in 1996). Showing an average capacity factor over 90% for the year (remember this a 530MW unit), it has generated spot revenue above $430m for its owners, with an additional $1.2m in FCAS revenue (albeit offset with $1.5m in FCAS costs). This unit alone in 2019 generated 87% as much energy (4.47TWh) as all the large scale solar in the NEM across the same period (5.1TWh). As highlighted in the below ‘Daily Output (MW)’ chart, this unit has barely been below 450MW on a daily basis, thereby giving it the highest capacity factor of any unit in the NEM. These types of statistics cannot be ignored.
However, not all coal-fired units are as reliable or predicable. Perhaps one of the oldest units in the NEM, Gladstone 1, has a decidedly less glamourous daily profile for 2019.
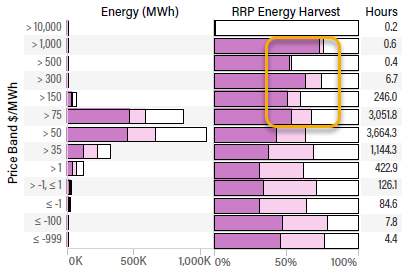
Whilst the unit has ‘only’ managed a capacity factor of 46% across 2019, with 13 starts across the year, it still managed to generate approx. $74m in spot revenue (one of its better spot revenue years in recent times), because it has been able to generate when the prices are high, as shown in the RRP Energy Harvest charts included on the B pages. These charts indicate the availability of the unit is roughly the same at all pricing levels, with near maximum capacity being generated at the higher end price periods (presumably when demand and supply were tight). This again denotes being available when the price signals require the generation.
… Looking at Gas fired generation
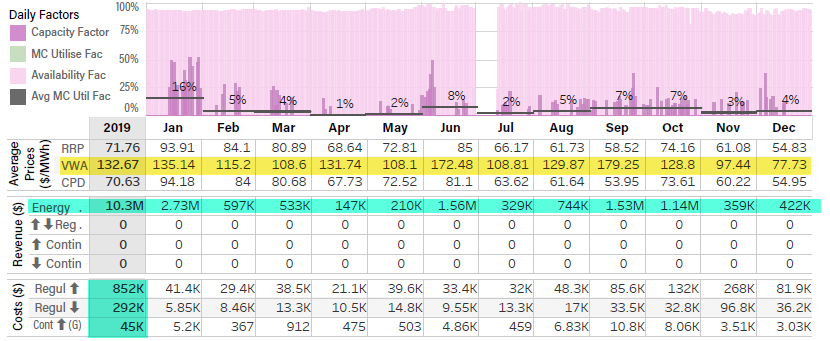
Looking at Braemar 1 in Qld, we can see its VWA (yellow highlight) is approx. $132/MWh across the calendar year 2019, with a capacity factor of approx. 5%. Further down in the above chart, we can also see an annual spot revenue of $10.3m, and for what we understand is one of the first times in the public content, a breakdown of the estimated FCAS costs associated with its generation (denoted in green highlighted as costs). So while $10.3m spot revenue may seem good for this unit, when we subtracts the FCAS costs (a further reduction in revenue of approx. $1.2m across the station) and then estimated fuel costs (given we can see it is placing most of its energy between $75-$150/MWh, let’s assume $100/MWh), we can quickly determine it is making approx. $25/MWh on its generation: slim pickings I would assume.
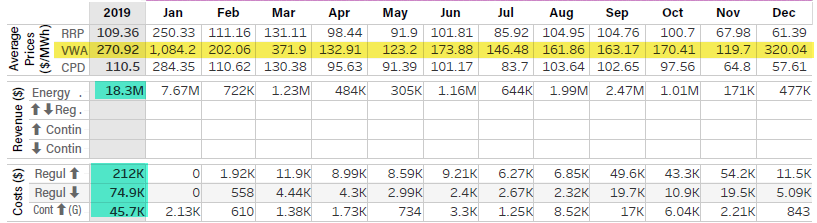
A similar picture can be painted for gas generation in Victoria with Jeeralang B2, where VWA is indicating a healthy $270/MWh, with annual spot revenue approx. $18.3m, although over $7.5m came from Jan 2019 alone. Interestingly, the FCAS costs associated with Jeeralang B station are about 25% of those associated with Braemar 1, especially in FCAS Regulation.
So what does all this mean! While we continue to build new wind and solar power stations, it does appear that the newly built generation is impacting gas fired generation first (not coal), with dwindling capacity factors and revenue for the generation source that is supposed to be there when wind and solar generation is not able to generate once all the coal is shut. So far, the numbers don’t really indicate this.
… What about wind and solar generation
All of this analysis neatly compliments the challenges already highlighted in Allan and Ben’s notes on wind and solar generation. In general, the energy harvest charts for solar are showing lower generation availability and capacity generated at higher prices, higher temperatures and capacity factors between 25%-40%, rather than 60%-80%
Whilst the numbers are all different, a significant trends continue to be present:
- As was noted in the GRC 2018, the NEM is coming off a high coal-fired generation position and it will take time – there is no silver bullet;
- The energy still being generated by coal fired generation is significant and it will take large numbers of 30-40% capacity factor wind farms and 25%-35% capacity factor solar farms to make a large dent in coal forced generation; and
- In making a dent in coal fired generation, gas fired (and hydro) generation will continue to bear the brunt of reduced operation, reduced spot market revenue and more financial challenges than history would otherwise show.
All of these factors bring a reality to the challenges of the NEM transition, and one we should all start to get our heads around. If you are an energy market or power system consultant, NEM observer or government adviser, you would be well informed to have this as your ‘ready-reckoner’. Let’s continue to have discussions based on facts, not opinions, as we work through the complex system that is the NEM.
————————————–
About our Guest Author
|
|
Jonathon has nearly 20 years practical experience in the Australian NEM, having held senior operational and trading roles in participant organisations and now as the Director of a specialist market consulting organisation, with a specific focus on renewable energy integration. Current clients include some of Australia’s largest integrated utilities, market regulatory organisations, transmission system operators and not-for-profit market observers. Jonathon has spent considerable time working with AEMO, Australia’s energy market operator.
As a former member of the NEM’s Dispatch and Pricing Reference group, Jonathon’s intricate knowledge of power system dispatch and security, coupled with practical, on-site experience with power system operations across all forms of electricity generation, allows him to bring operational and energy trading realities to strategically significant policy discussions. Jonathon has degrees in Engineering and Management, and is a member of the Australian Institute of Company Directors, CIGRE and IEEE You can find Jonathon on LinkedIn here. Jonathon, and his team at Greenview, are also co-authors of the Generator Statistical Digest (released on the 28th January, 2020). |

Leave a comment