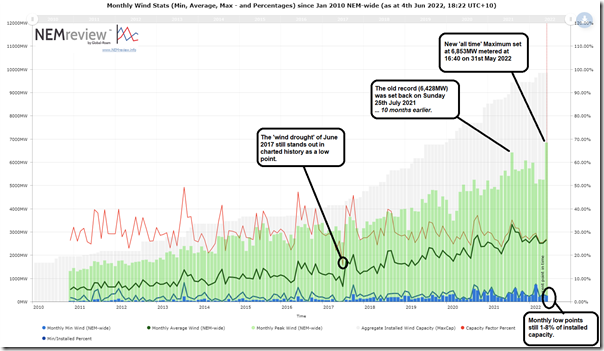
Given we hit a new all-time record for wind production at the start of this week (on Monday 31st May 2022) I thought it was timely to update this pre-prepared query in NEMreview v7 in order to show how the headline for statistics have been changing:
(data shown is this trend is to the last complete month – hence no data is visible for June until we’re into July 2022).
(A) Headline stat to the end of May 2022
There are a number of things clearly visible in the chart above, including the following:
(A1) Monthly maximums
I’ve summarised the progressive evolution of the ‘highest ever’ instantaneous production records in the table below:
| Month | Incidence of new ‘all time maximum’ |
|---|---|
|
May 2022 |
As noted here on Tuesday 31st May 2022, this day saw two discrete instances of ‘new all-time record’ aggregate wind production: 1) The first instance occurred early in the morning – with the new record sitting briefly at 6,637MW metered at 02:30. 2) The second instance occurred after we’d published the article … hence the PS at the bottom noting that the record had been bumped higher – to 6,853MW metered at 16:40. |
|
July 2021 |
Prior to 31st May 2022 the prior record had stood for 10 months … being back on 25th July 2021 as noted here (with the record pushed to 6,428MW). This record exceeded the record set on 24th July 2021 (i.e. the day before) at 6,120MW metered at 20:20. |
|
May 2021 |
The record set in May was at 5,644MW I did record this burst to 5,642MW on 25th May 2021 , but did not record the extra 2MW later… |
|
April 2021 |
The record set on Tuesday 13th April 2021 was at 5,430MW. |
|
August 2020 |
The record was pushed higher, to 5,425MW. I had (earlier) recorded this jump in the all-time maximum to 5,075MW on Friday 21st August 2020. |
|
May 2020 |
The record was pushed higher, to 5,032MW. I had (earlier) recorded this jump to 5,030MW for the first time on Friday 1st May 2020. |
|
August 2019 |
The record was pushed higher, to 4,818MW. |
|
July 2019 |
The record was pushed higher, to 4,624MW. |
|
May 2019 |
The record was pushed higher, to 4,423MW. |
|
February 2019 |
The record was pushed higher, to 4,050MW on 12th February 2019. |
Prior to this time, the maximum production had been below 4,000MW.
(A2) Monthly minimums
Looking across the bottom of the chart, we see that the minimum level of aggregate production from wind is typically in the 2% to 3% range (of installed capacity at the time).
1) However on occasions it has been as low as 1% and sometimes as high as 8%.
2) These are all instantaneous values that occurred at some point during the month.
3) For May 2022 this low point of only 258MW actually occurred only 4 days prior to the new all-time maximum
(a) As documented as a ‘short term wind lull’
(b) Truly it did vary from famine to feast over a relatively short space of time!
—
What’s also worth noting, in terms of monthly minimum, was:
1) the standout low point for monthly average capacity factor … being back in June 2017 with the longer-lasting ‘Wind Drought’ that occurred through that month.
2) whilst that’s the deepest and most sustained lull we’ve seen in the actual metered data for wind output, the analysis completed for Appendix 27 in GenInsights21 suggests that there have been deeper and more geographically spread ‘wind droughts’ over the (only!) 16-year history of wind speed readings we analysed from the BOM.
… for more information about this, watch from the ~40 minute mark in this recording of the presentation we gave to Smart Energy Council in April 2022.
(A3) Monthly capacity factor
One other major observation we can make is that the monthly average capacity factor is clearly oscillating less around the 30% long-run average mark as the installed capacity of wind farms, and geographical diversity, grows.
(B) How long will this record last?
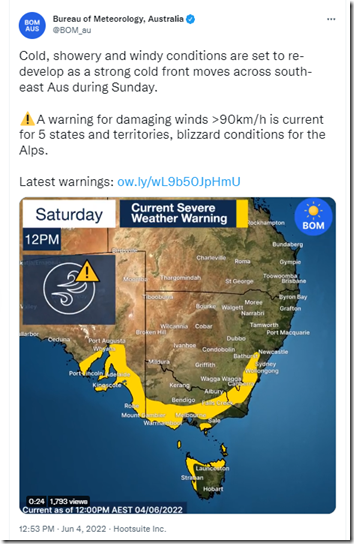
Coincidentally I did notice this warning from the BOM earlier today about a ‘warning for damaging winds >90km/h’ across the southern part of the NEM for tomorrow (Sunday 5th June 2022):
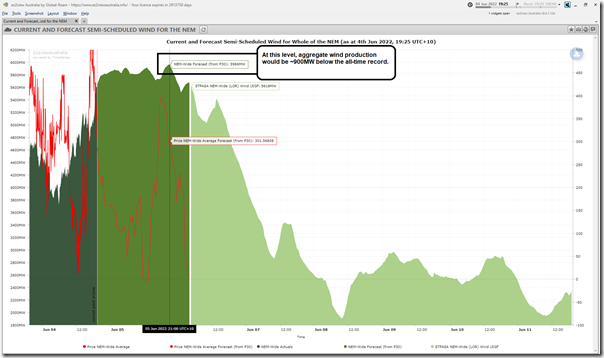
We’ll have to wait to see what tomorrow will bring – if AEMO’s current forecast come to fruition (as seen in this snapshot from ez2view at 19:25) we’ll see levels close to 6,000MW tomorrow evening:
Stay tuned…


Leave a comment