I noted last week, as it was all happening, that it would take a number of days to more comprehensively work through the in’s and the out’s of what happened in the Queensland region last week with the heatwave, extreme demand, storms, LOR2 (and almost LOR3) Lack of Reserve Condition, Reserve Trader and so on… which means in elapsed time we might be still looking backwards in March 2022, given everything else we have on the go.
However today:
1) I thought I would get started; and
2) I’ve created this ‘Headline Event’ to capture the significant articles written about what went on, as more articles are progressively added.
With apologies to some readers, what follows in these articles will be quite Queensland-focused – though it’s important to remember (as Allan highlighted here last Friday and Linton earlier today about Negawatts in Victoria) there were some quite interesting things happening elsewhere as well!
In this article I look entirely at the wholesale supply-side of the equation, using the enhanced ‘Bids & Offers’ widget we released with ez2view v9.1 as part of the transition to Five Minute Settlement, and which has continued to evolve since that time.
1) What’s captured here is v9.3.3.107,
2) But there is a v9.4 release that will be with us soon, as well, with a few further enhancements (including some early release widgets for clients to explore).
This quick broader summary is intended to be the stepping stone to other articles that will follow later, looking at specific aspects of (wholesale) supply-side involvement over the ‘Heatwave Week’.
(A) Aggregate view of true bids ‘as dispatched’
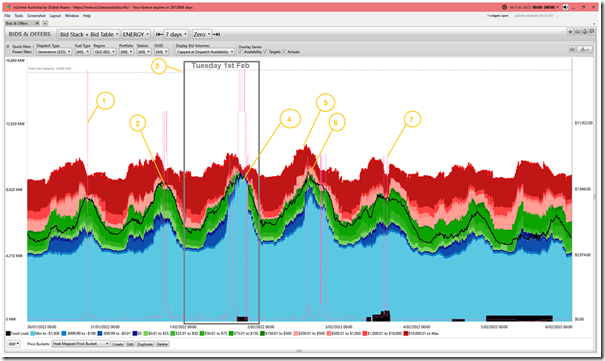
Let’s first start with this summary overview of how bids were assessed by NEMDE and dispatched for every five-minute period up until the 24:00 dispatch interval ending Saturday night 5th February 2022:
(Remember to click on any image here to open a larger view)
With respect to the numbering added to the image:
1) There was a single price (to $N at HH:MM) on Sunday 30th January 2022.
(a) At that point we see the aggregate dispatch (i.e. the black line) just above the ‘green’ and ‘blue’ bid ranges (i.e. into the capacity offered at or above $300/MWh).
(b) … it’s useful to keep this in mind to keep the later volatility in context.
2) On Monday evening, 31st January we saw more volatility present.
(a) In this case, there is clearly more ‘pink’ bid volumes below the black line, which helps to explain why the pricing was high for longer.
(b) Also notable that total dispatch (i.e. black line) was higher than was the case on Sunday evening, and ‘true’ capacity offered to the market at any price (e.g. taking into account availability of solar and wind resource) was higher than Sunday, but not to the same extent.
3) There was a small increase in Maximum Capacity of all units in QLD coincident with the start of Tuesday 1st February.
4) Through the afternoon/evening of Tuesday 1st February we clearly see the sustained volatility in the price trace overlaid on the bid.
5) Capacity offered at any price peaked on Wednesday 2nd February around 14:05 at 11,329MW
(a) but even at that point in time there was almost 4,700MW unavailable across all fuel types …
(b) so a collective peak availability of approximately 71% across the entire plant mix
(c) that’s the highest point for availability of plant through the week, and it only lasted a brief period.
(d) In the fuel type summaries below, look for the ones that contributed most to this peak (and hence were not there at other times)
(e) The pricing volatility in QLD on Wednesday 2nd February began at 14:30 … but at this point availability had fallen to 10,966MW (i.e. already down 363MW).
6) The dispatch of all wholesale supply-side options peaked at 14:30 (coincident with Wednesday’s first spike) and fell off quite rapidly after that time as a result of several factors, including rapidly falling demand.
7) There was also volatility on Thursday 3rd February (at 14:00 and 14:55), coincident with a drop in aggregate Available Generation.
With this introduction out of the way, let’s now dive in deeper …
(B) Bids ‘as dispatched’ by Fuel Type
… we’ll now use the same time-range (i.e. 7 days to 00:00 ending Saturday night 5th February 2022). Remember that all times are NEM Time.
(B1) Bids ‘as dispatched’ for coal units
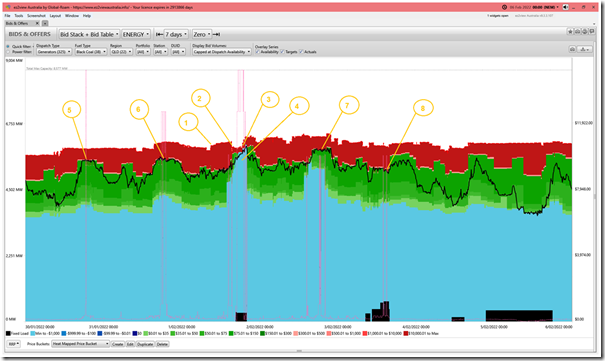
Here’s a view of the chart above, but filtered down to just the 22 coal units that are operational in QLD currently:
With respect to the numbering:
1) Last week I noted that there were three coal units out of action at the start of the day,
2) and then Tarong Unit 2 tripped prior to 15:15 on Tuesday afternoon
(a) Remembering Allan’s reminder (that it’s aggregate MW capacity that’s more important than number of units from a supply/demand point of view), note that the aggregate Available capacity from all coal units in QLD hit a low point of 5,911MW during this period
(b) With reference to the aggregate Max Capacity of 8,577MW that means:
i. Aggregate availability of 69% across all coal units – which unfortunately coincided with a time of extreme demand in the QLD region; and
ii. A total of 2,666MW of coal-fired capacity unavailable.
iii. The week-long span of this available capacity above shows that it was fairly consistent (in being lower than would be hoped) for this summer period.
(c) It’s worth noting that the MaxCap of the four units offline through that period adds up to only 1,971MW:
i. This was KPP_1 (781MW) + CPP_4 (420MW) + CALL_B_2 (385MW) + TARONG#2 (385MW)
ii. … which implies that there were other factors at play contributing to the other (695MW) of unaccounted for unavailability.
(d) This is something that might be explored later … with two thoughts provided initially:
i. For thermal units including a boiler-steam cycle, ‘Maximum Capacity’ often represents peak capacity achievable in shorter bursts when taking pre-heaters out of service and other operational changes (i.e. can be done at times, but undesirable from an efficiency standpoint).
ii. Efficiency is particularly important to consider during the hot+humid conditions … which are known to limit heat transfer efficiency and so the maximum capacity achievable …
>> Note that we’ve written before about how high temperatures affect capability of most technology types
>> We explored this in more detail (including any changing pattern in recent years in Appendix 18 within the broader GenInsights21 release.
3) This unit returned to service on Tuesday evening (18:30), prior to the end of the volatility.
4) During this period of volatility on Tuesday:
(a) Not only did aggregate Available Generation drop (due to the trip); but also
(b) The percentage of capacity available was shifted to bid at the –$1,000/MWh Market Price Floor
i. presumably because the generators knew that they needed to run and the price was ‘guaranteed’ to be high, so they may as well switch to ‘price taking’ mode.
ii. with readers urged to remember that it is impossible to ‘know’ a participants motivation, but that does not stop many people guessing (us included)!
5) On Sunday’s spike to the MPC at 18:40 30th January, we see that all ‘green’ bids were utilised
(a) But there was another ~550MW of capacity offered up around the MPC that was not dispatched for that period.
(b) In other words, not the same type of behaviour seen on Tuesday when supply/demand was tighter.
6) It was a similar picture for Monday’s volatile periods (31st January 2022).
7) On Wednesday 2nd February the volume of capacity bid in green and blue increased, almost to the same extent as on Tuesday.
8) By Thursday 3rd February, behaviour had (in aggregate) reverts to more like Sunday and Monday. Indeed, the timing of the spikes (14:00 and 15:00) is prior to the shift of volume to lower price bands that evening.
Some of these themes are similar as we look at other fuel types below …
(B2) Bids ‘as dispatched’ for gas units
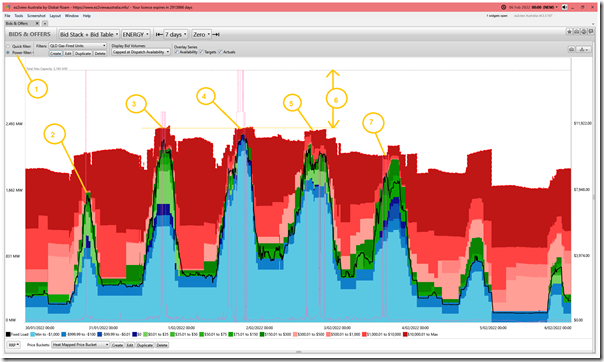
Here’s a similar summary of bids for gas-fired units:
With respect to the numbering:
1) In this case I have used a ‘Power Filter’ to construct the view of all gas plant in the ‘Bids & Offers’ widget in ez2view.
2) On Sunday 30th January, a significant volume of capacity was shifted from more expensive (i.e. reds) bid price ranges down to less expensive (greens and blues) for the expected ramp in output – and subsequent price spike at 18:40 – around the sun setting.3)
3) On Monday 31st January, we see volume shifted to green and blue bid bands, and available generation capacity increase to coincide with the peak times in demand.
4) On Tuesday 1st February (just as was the case for the coal units) almost all available gas-fired capacity was shifted to the blue (i.e. $0/MWh and below) price bands to ensure they were operational for the tightest periods of the supply-demand balance.
(a) This was much more the case than on Monday or Wednesday.
(b) Aggregate volume dispatched (i.e. under the black line) was significantly higher, as a result.
5) On Wednesday 2nd February there is a cycle in capacity bid in the green/blue (i.e. lower) price ranges.
6) Across the peak periods for Monday, Tuesday and Wednesday, the total volume of capacity made available increased from the otherwise lower points:
(a) Typically this represented between 2,400MW and 2,460MW capacity available at any price.
(b) With aggregate Maximum Capacity of 3,165MW across all of these units…
i. This meant aggregate availability around 77% during these peak periods;
ii. With something like 715MW still unavailable.
(c) Others have noted elsewhere that the Swanbank E outage was one of the factors contributing to the tight supply-demand balance.
(d) However this gap, and the fact that the Swanbank E MaxCap is 385MW highlights that (i.e. with the 330MW difference) there were also other factors at work in reducing gas capacity available.
(e) Again, we suspect that the hot+humid conditions were responsible for limiting maximum capacity achievable at a number of these gas-fired plant.
(B3) Bids ‘as dispatched’ for liquid units
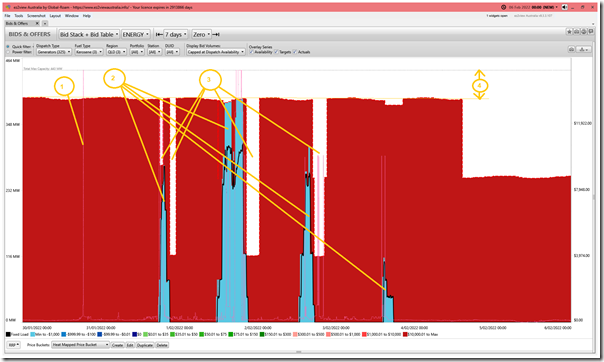
This grouping of units is the 3 units at Mt Stuart. Others (like Oakey) can be dual fuel, so are aggregated under ‘gas’ above because that’s generally the cheaper mode of operation.
With respect to the numbering here:
1) On Sunday 30th January, the price spike occurred at 18:40 with no change in bid (capacity prices at the $15,100/MWh Market Price Cap at the RRN).
2) For the following 4 days, we see capacity shifted to the –$1,000/MWh Market Price Floor at the RRN and dispatch resulting during most of the the periods of volatility … with one notable ‘miss’ being 18:35 and 20:10 on Wednesday 2nd February 2022.
3) Through this period we see a number of periods where aggregate capacity dips:
(a) i.e. where 1 or 2 units were unavailable during periods (including the ‘miss’ noted above on Wednesday evening 2nd February).
(b) We’ve not looked into the rebid reasons at this point to try to understand why.
4) In aggregate we see capacity bid into the market varying, but at about 395MW at any price:
(a) Compared to the aggregate MaxCap of 443MW this means an unavailability of approximately 48MW;
(b) Again presumably the effect of the hot+humid conditions.
(c) This translates to an aggregate availability during these periods of 89%.
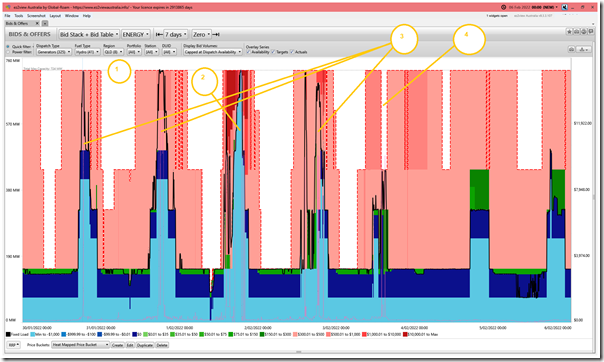
(B4) Bids ‘as dispatched’ for hydro units
This category shows only discharge from hydro units – no matter whether backed by pumped storage (i.e. Wivenhoe) or not (i.e. Kareeya and Barron Gorge):
With respect to the numbering:
1) At many points through this 7-day period, we see aggregate capacity bid from these hydro units up to the aggregate MaxCap:
(a) In this case, we see that the hot & humid conditions did not present the same type of challenge as alluded to for the thermal units above in terms of reaching peak capability.
(b) Obviously hydro units are affected by the weather in different ways!
2) As was the case for the other units above, most capacity was bid down to –$1,000/MWh for Tuesday 1st February 2022 to meet the tightest period of the supply/demand balance.
3) This was not so significantly done for Sun 30th, Mon 31st Jan or Wednesday 2nd February.
4) For the afternoon period of volatility on Wednesday 2nd February, W/HOE#2 unit was also unavailable (we’ve not explored rebid reasons to see if we can understand why).
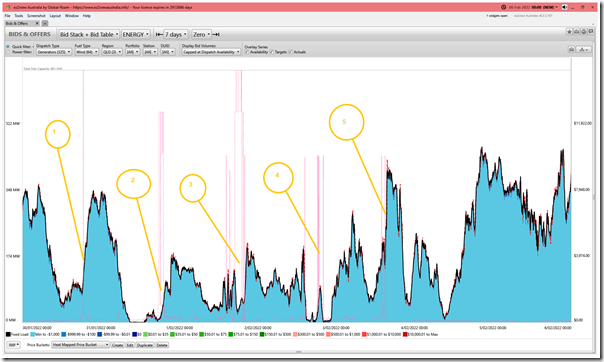
(B5) Bids ‘as dispatched’ for wind units
As noted in this prior article late on Tuesday 1st February, the 2 Large Wind Farms in QLD saw their output capability suffer during the periods of volatility through the week.
Here’s the filtered view in ‘Bids & Offers’ in ez2view:
Again with the annotations:
0) Not noted on the chart, but useful to note as background that bids remained down at –$1,000/MWh for the whole of the week
1) On Sunday 30th January, the price spike (to $15,100/MWh at 18:40) …
(a) was at a time when AWEFS availability was only 107MW of the 661MW aggregate Maximum Capacity (16% availability)
(b) immediately preceded a rapid ramp up in output … which was presumably one factor (of a number) in meaning the price spike was short lived.
(c) In the details, useful also to note the actual output was 21MW higher than AWEFS thought it might be … i.e. an illustration of the rapid ramp up.
2) On Monday 31st January the availability (only 1%) was the worst of any of the periods of volatility.
3) On Tuesday 1st February the output was a bit more up-and-down through the afternoon/evening (as was Market Demand, but perhaps not coincident), but still at a quite low level.
4) For Wednesday 2nd February, the spikes in price coincided closely with lulls in the wind.
5) On Thursday 3rd February, the wind production was more significant (~200MW – so availability of 30%).
—
Whilst it’s true that there were other factors that were much more significant in delivering the extreme volatility seen through this particular week (i.e. in 2022), the extremely low levels of wind harvest that coincided with extremely high levels of demand were, to us, both:
1) Not very surprising; but also
2) Another useful reminder of the broader need for many to do some serious, significant modelling of what the future might hold:
(a) as the rate of development of wind capacity across the NEM accelerates into what the AEMO now sees as ‘most likely’ in terms of the rapid closure of coal and the rapid ramp in renewables capacity
(b) as the Clean Energy Council petitions ‘100% renewables by 2030’ as a 2022 Federal election issue.
That’s one of the reasons why we invested some much time and effort through 2021 in exploring the actual reality of historical speed wind diversity across 16 years of history – now compiled in Appendix 27 ‘Exploring wind diversity’ as part of the broader GenInsights21 release.
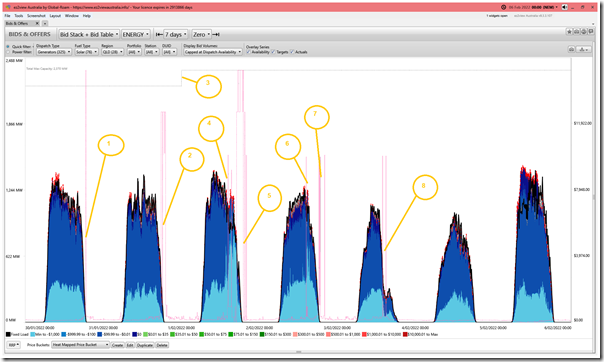
(B6) Bids ‘as dispatched’ for solar units
Here’s the analogous filtered view for ’Large Solar’ plant in ‘Bids & Offers’ in ez2view:
With respect to the numbering here:
1) The main Sunday evening price spike (to $15,100/MWh at 18:40) was at the point the sun had set:
(a) with the aggregate output from all Large Solar farms across QLD down at only 11MW
(b) whilst that is quite obvious in the chart, what’s perhaps more important to be remarked upon is the rapid decline in output (e.g. over 700MW decline in a 60 minute period).
(c) These types of ramp events, and some uncertainties about exactly when they are going to happen, were the spur for detailed analysis presented in Appendix 15 (about ‘Aggregate Scheduled Target’) and Appendix 16 (about ‘Forecast Convergence’) inside of the broader GenInsights21 release.
2) On Monday 31st January 2022, the picture was much the same … again the prices spiking towards the end of the diurnal solar decline.
3) There’s a step change increase in aggregate Maximum Capacity shown at the start of Tuesday 1st February stemming from the 148MW Blue Grass Solar Farm hitting the AEMO’s Production systems (output is still some ways away, perhaps).
4) Through the afternoon of Tue 1st February we see earlier price spikes (such as 14:25 and 15:30) coincident with sudden declines in aggregate output (presumably due to cloud cover or storms) superimposed on the more macro pattern of afternoon decline in output.
5) Then into the evening of Tue 1st February (from ~17:10) we see the price spikes become more consistent as solar fades down to zero more rapidly, coincident with Underlying Demand remaining strong.
6) In the afternoon of Wednesday 2nd February there’s also a spike (at 14:30) … again coincident with rapid drop in output (again, collective cloud cover presumably?)
7) The evening series of price spikes of Wednesday 2nd February (from ~18:30) are later than on Tuesday, and begin at the point where Large Solar is almost completely spent for the day.
8) As noted above, the volatility of Thursday 3rd February arrived a little earlier than some might have expected (~14:00) – but this chart shows a rapid and early drop in aggregate output (clouds or storms?) was one of the contributing factors.
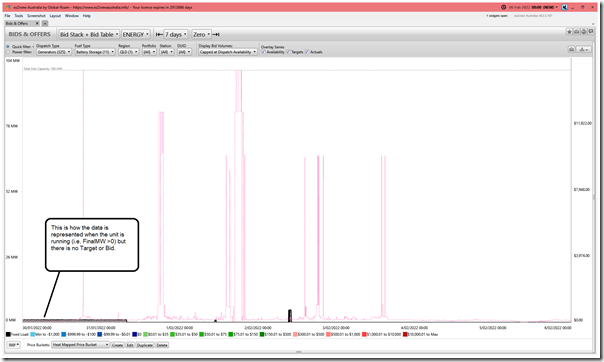
(B7) Bids ‘as dispatched’ for battery units
There’s only one battery in the AEMO Production Systems in QLD at the moment … Wandoan South BESS … and this is still in the stages of commissioning so did not contribute anything significant during the week:
… that’s all for this article today.
In the next article will start to have a look at demand-side (and embedded) factors…


Leave a comment