
Tuesday 1st February and Wednesday 2nd February, 2022, saw high Queensland electricity demand put pressure on electricity supply. On both days temperatures soared with uncomfortable humidity levels pushing apparent temperatures towards 40 degrees Celsius.
Supply was stretched due to over 2GW of coal-fired capacity being unavailable. Further details, and other aspects were noted in this Summary view of supply-side contributions on WattClarity.
This article – Part A – reviews how rooftop PV output varied and considers its influence on Queensland demand, with particular focus on the 1st and 2nd of February, 2022.
Queensland’s underlying demand
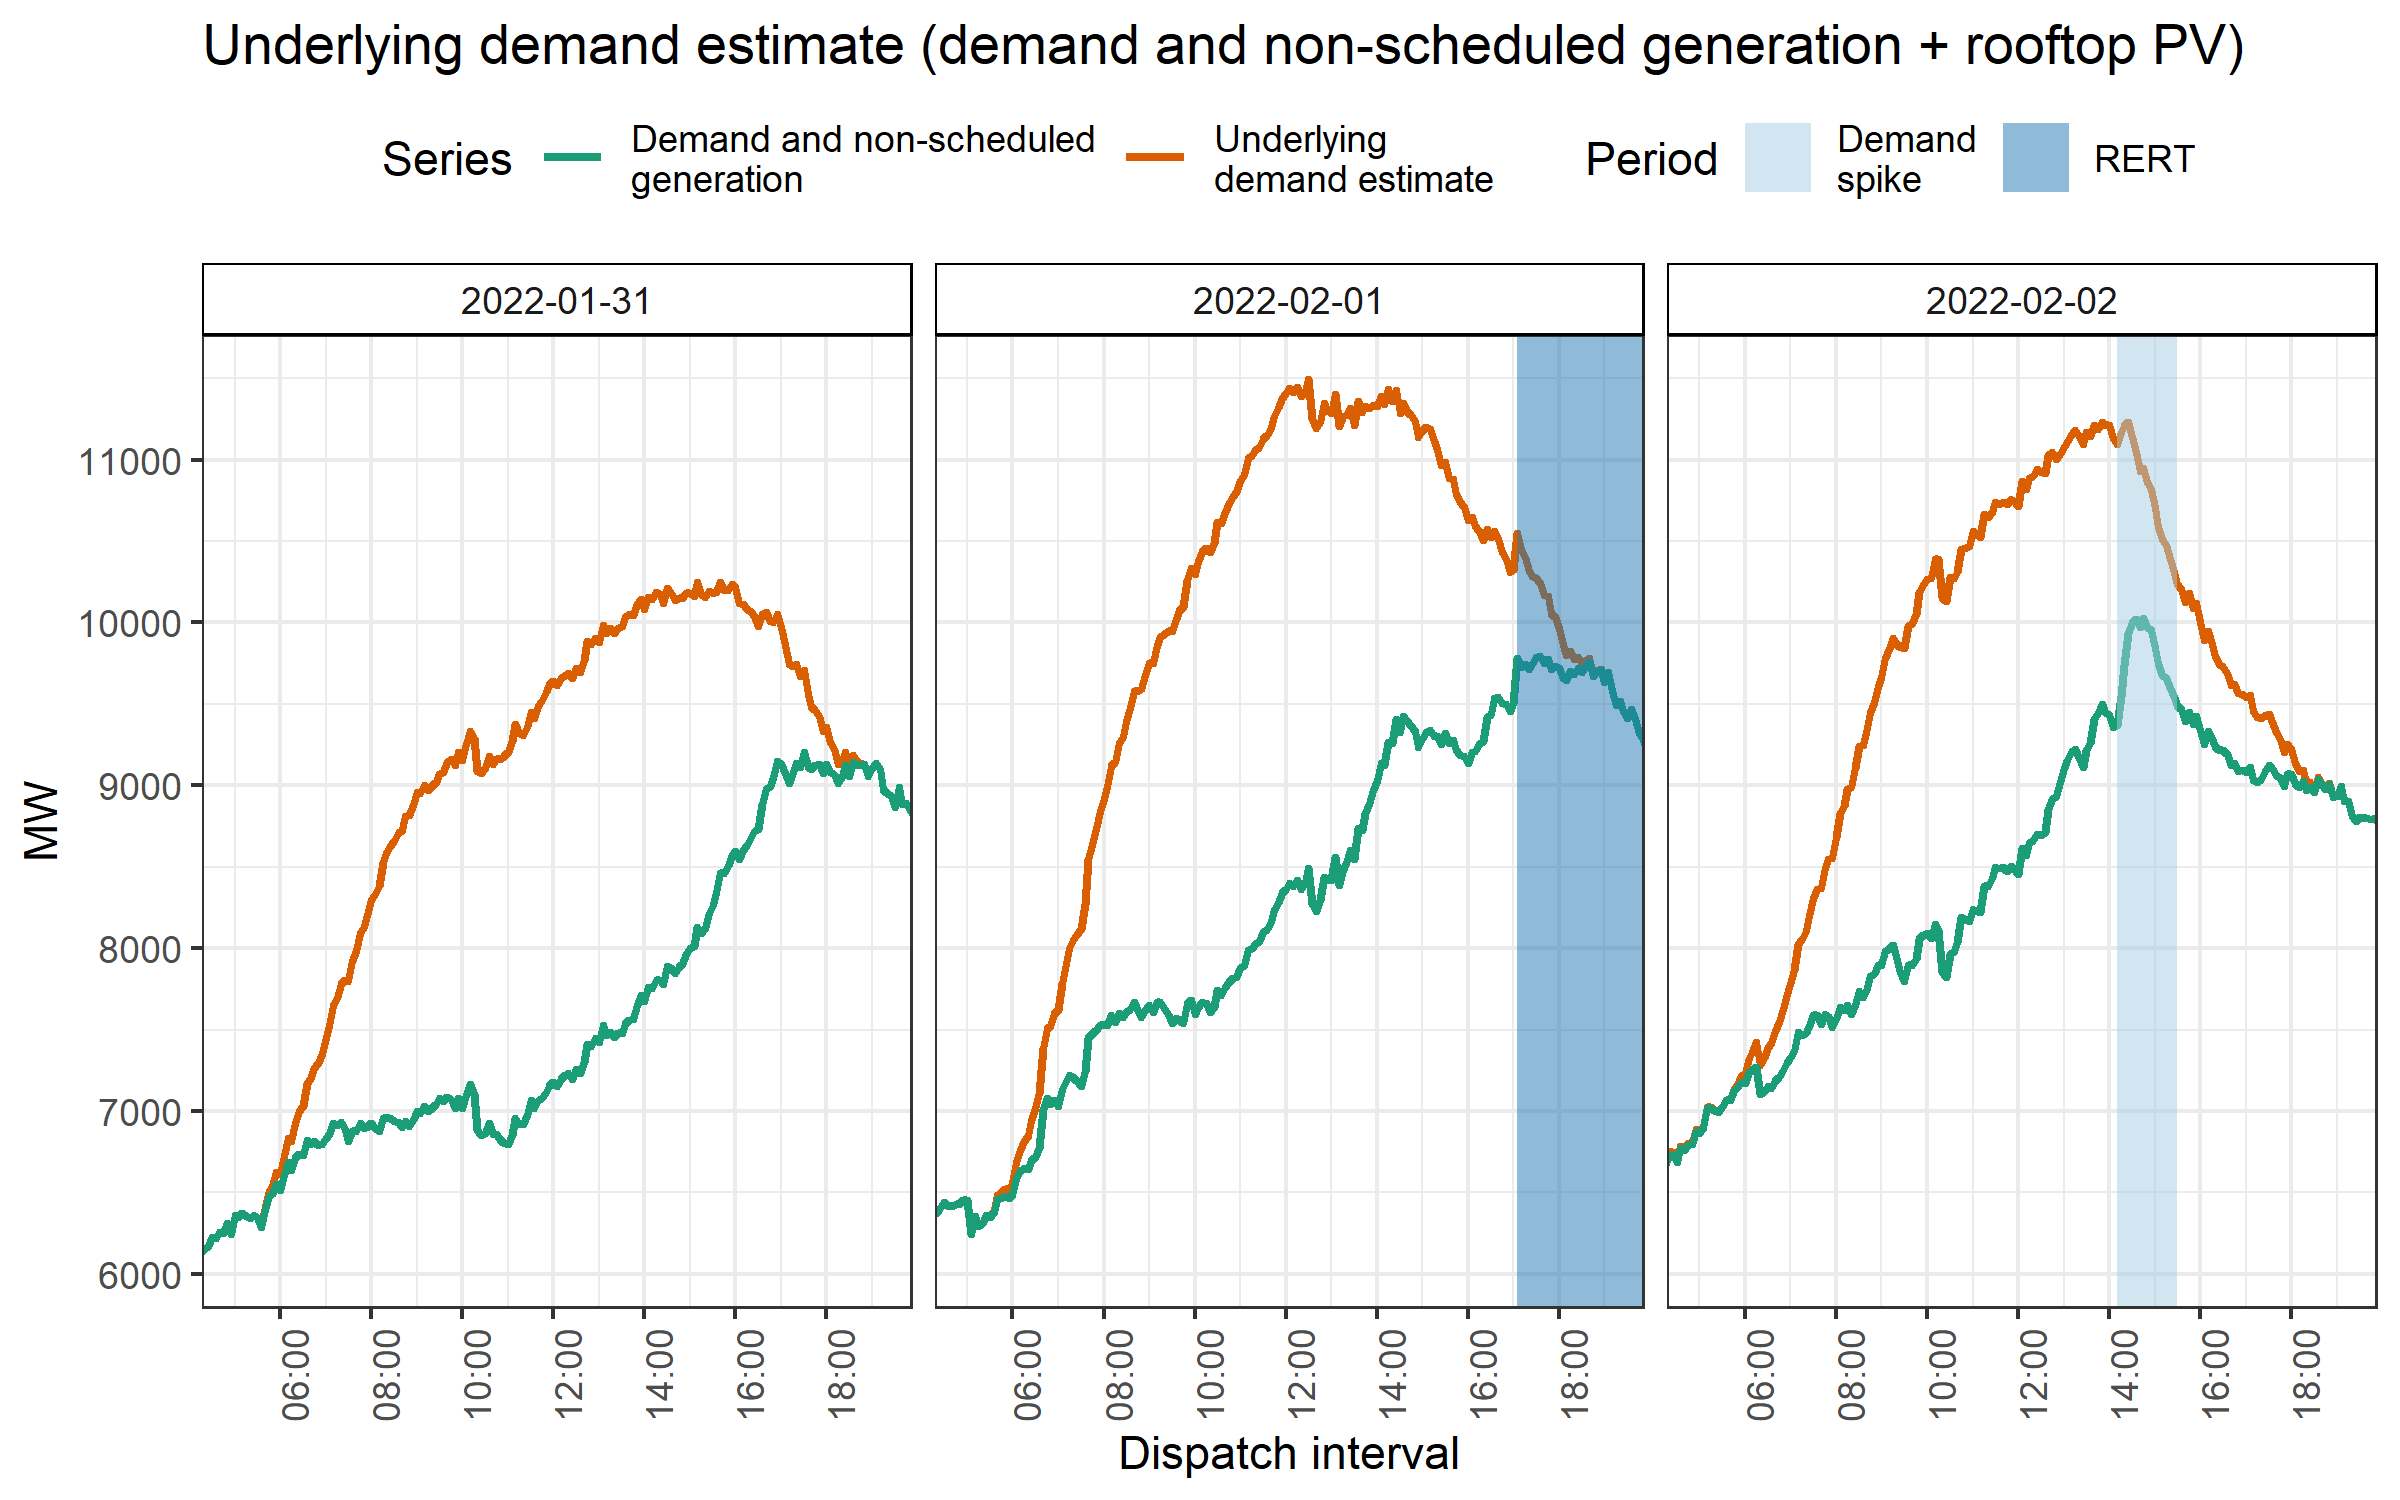
To start, let’s take a look at underlying demand in Queensland over Monday, Tuesday and Wednesday. For this analysis our estimate of underlying demand is composed of grid “demand and non-scheduled generation” and behind-the-meter rooftop PV from the APVI (interpolated to each dispatch interval).
In the figure below, we can see that demand levels on Monday the 31st were subdued relative to Tuesday and Wednesday.
Tuesday the 1st, the centre tile in the figure below, saw the highest underlying demand of the three days, reaching 11,500 MW near midday.
Wednesday the 2nd saw the highest grid demand of the three days, helped by a considerable spike in grid demand attributed to rooftop PV.
Tuesday overview
On Tuesday storms including a ‘super cell’ thunderstorm formed in the afternoon from about 2:30pm (14:30) and caused extensive damage around the south east of the state.
The storms brought down powerlines and flung vegetation into the network and coincided with a car hitting a power pole to exacerbate the extent of the outages.

And in a 6:30 pm Facebook update Energex estimated that more than 24, 000 customers were without power.
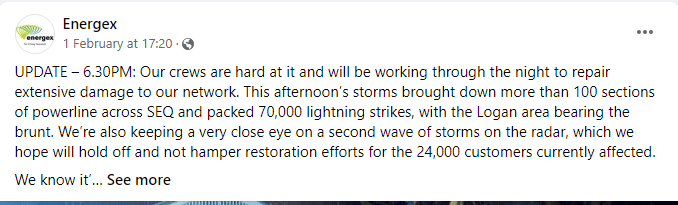
Logan City, which was hit hard, was left with 2,104 customers without power.

Tuesday’s storms didn’t last too long at their peak intensity, from around 4pm the weather warmed again and this muted demand reductions that were anticipated with the cool weather that the storms brought.
Later in the afternoon, reserve contracts to reduce demand were activated across dispatch intervals 17:05 to 21:30. The RERT period, highlighted in blue in the chart above, captures the time when there was a steep decline in rooftop PV (the area between the orange and green lines) as the sun set.
Wednesday overview
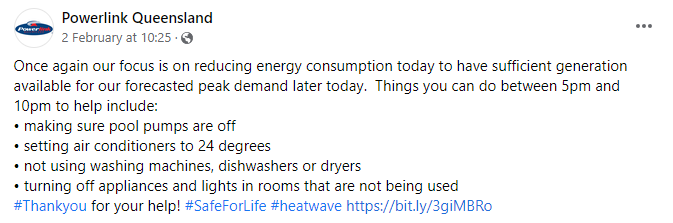
On Wednesday the 2nd, the supply-demand outlook for the afternoon was not as tight as the day before. Nonetheless, high temperatures and high humidity driving uncomfortable outside air conditions remained in the weather forecasts.
In the morning, 10:25 am, Powerlink repeated their appeal from the day before to reduce electricity consumption between 5pm and 10pm.
Wednesday’s underlying demand reached a high point at about 14:00 (2pm), after rising less steeply than the day before.
Soon after 14:00 on Wednesday storms developed again and thick clouds led to a dramatic decline in rooftop PV output. This period, on Wednesday the 2nd, is highlighted in light blue in the chart above and evolved as follows:
- Grid demand rose by close to 650 MW in half an hour from 14:10 to 14:35. Although the storm brought cooler temperatures, the evolution of the weather meant that the clouds preceded their cooling effects – consumer demand had not yet reduced by the same level as the rooftop PV reduction and a spike in grid demand and non-scheduled generation resulted.
- Grid demand remained high for another 10 minutes, to 14:45.
- Grid demand decreased back down to more excepted levels, down about 530 MW, over the next 45 minutes to 15:30.
A closer look at PV demand and temperatures on Tuesday and Wednesday
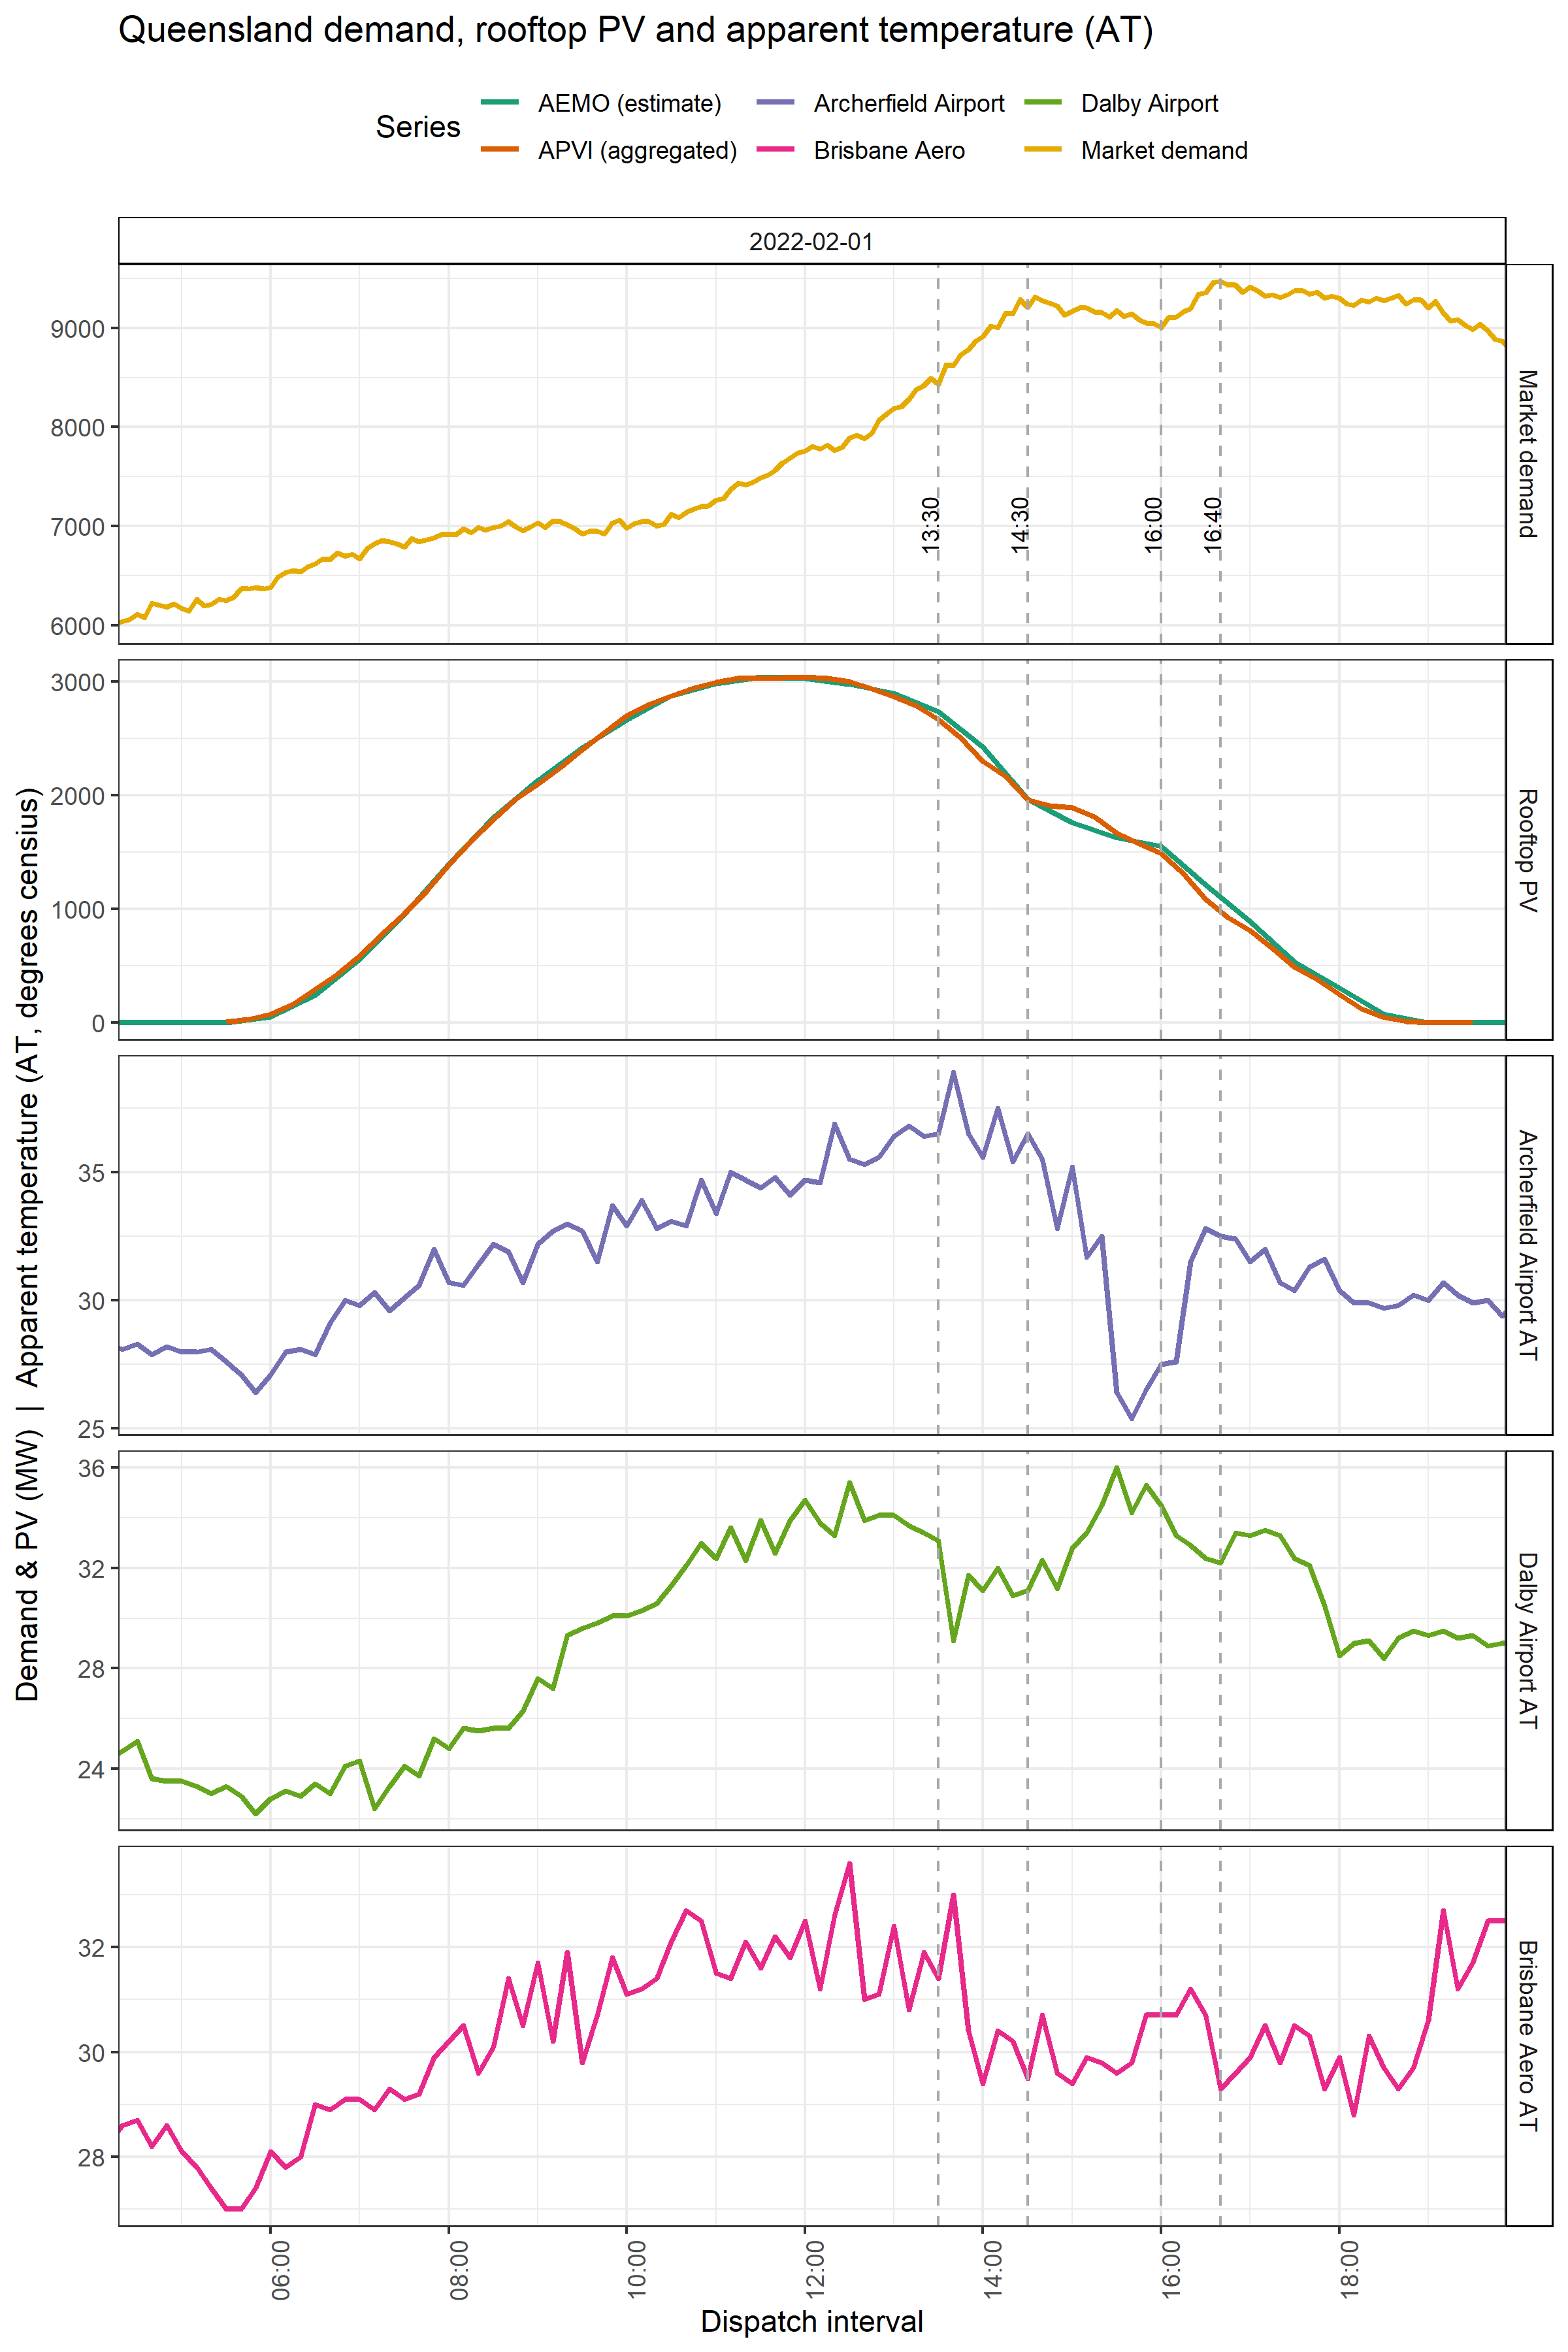
In the figures below we chart three variables:
- Market demand. The demand level to be met at each dispatch interval by the market. This is field ‘totaldemand’ in NEM market data databases which represents demand at the Regional Reference Node that is to be met by local scheduled and semi-scheduled generation and interconnector imports, excluding the demand of local scheduled loads and the allocated interconnector losses but including the demand met by Wholesale Demand Response.
- Rooftop PV. This includes the AEMO ‘measured’ estimate of rooftop PV and the aggregate of the 2-digit postcode-level output estimates from the APVI.
- Apparent temperature at Archerfield, Dalby, and Brisbane airports. The apparent temperature takes into account wind speed and humidity to estimate how hot the weather outside feels. Brisbane airport is selected for representativeness of Brisbane near the coastline, Archerfield is selected for representativeness further away from the coastline yet in the south of Brisbane. Dalby is selected as it is used by AEMO to issue temperature alerts for Queensland generators, its position is about 170 km west of Brisbane.
Temperatures, rooftop PV and market demand on the 1st
On Tuesday the 1st air temperatures at all three locations started to drop just after 13:30. Dalby appears to have been less affected – temperatures recovered and surpassed the earlier maximum by 15:30.
At Archerfield, a steady cooling began after 13:30 and included a change in wind direction from the west to the north east bringing cooler coastal air. At 15:00 the cooling sped up to drop the apparent temperature 10 degrees in the space of 40 minutes. Yet the reprieve was only partial as temperatures rose again between 15:40 and 16:30 to feel like 32.5 degrees, although only to levels experienced earlier that morning.
Temperatures closer to the coast at Brisbane Airport weren’t as high as Archerfield to begin with. From a high point of 33.5 (apparent temperature) the cooling had concluded by 14:00 and didn’t see the same resurgence of the hot weather, possibly due to north easterly sea breeze winds which persisted into the evening.
Between 13:30 and 14:30 rooftop PV reduced (in association with developing cloudiness) and contributed to an increase in market demand.
On Tuesday the 1st the declining rooftop PV output almost stopped between 14:30 and 16:00, suggesting the sky was clearing in some parts of the state and this was mitigating the effect of the setting sun. This aligned with an easing of market demand from its former peak at 14:30.
From 16:00 the rooftop PV started to decline again, in association with the setting sun and this would have helped the market demand to rise again to the highest level of the day at 16:40. This coincided with the resurgence of warm weather measured at Archerfield.
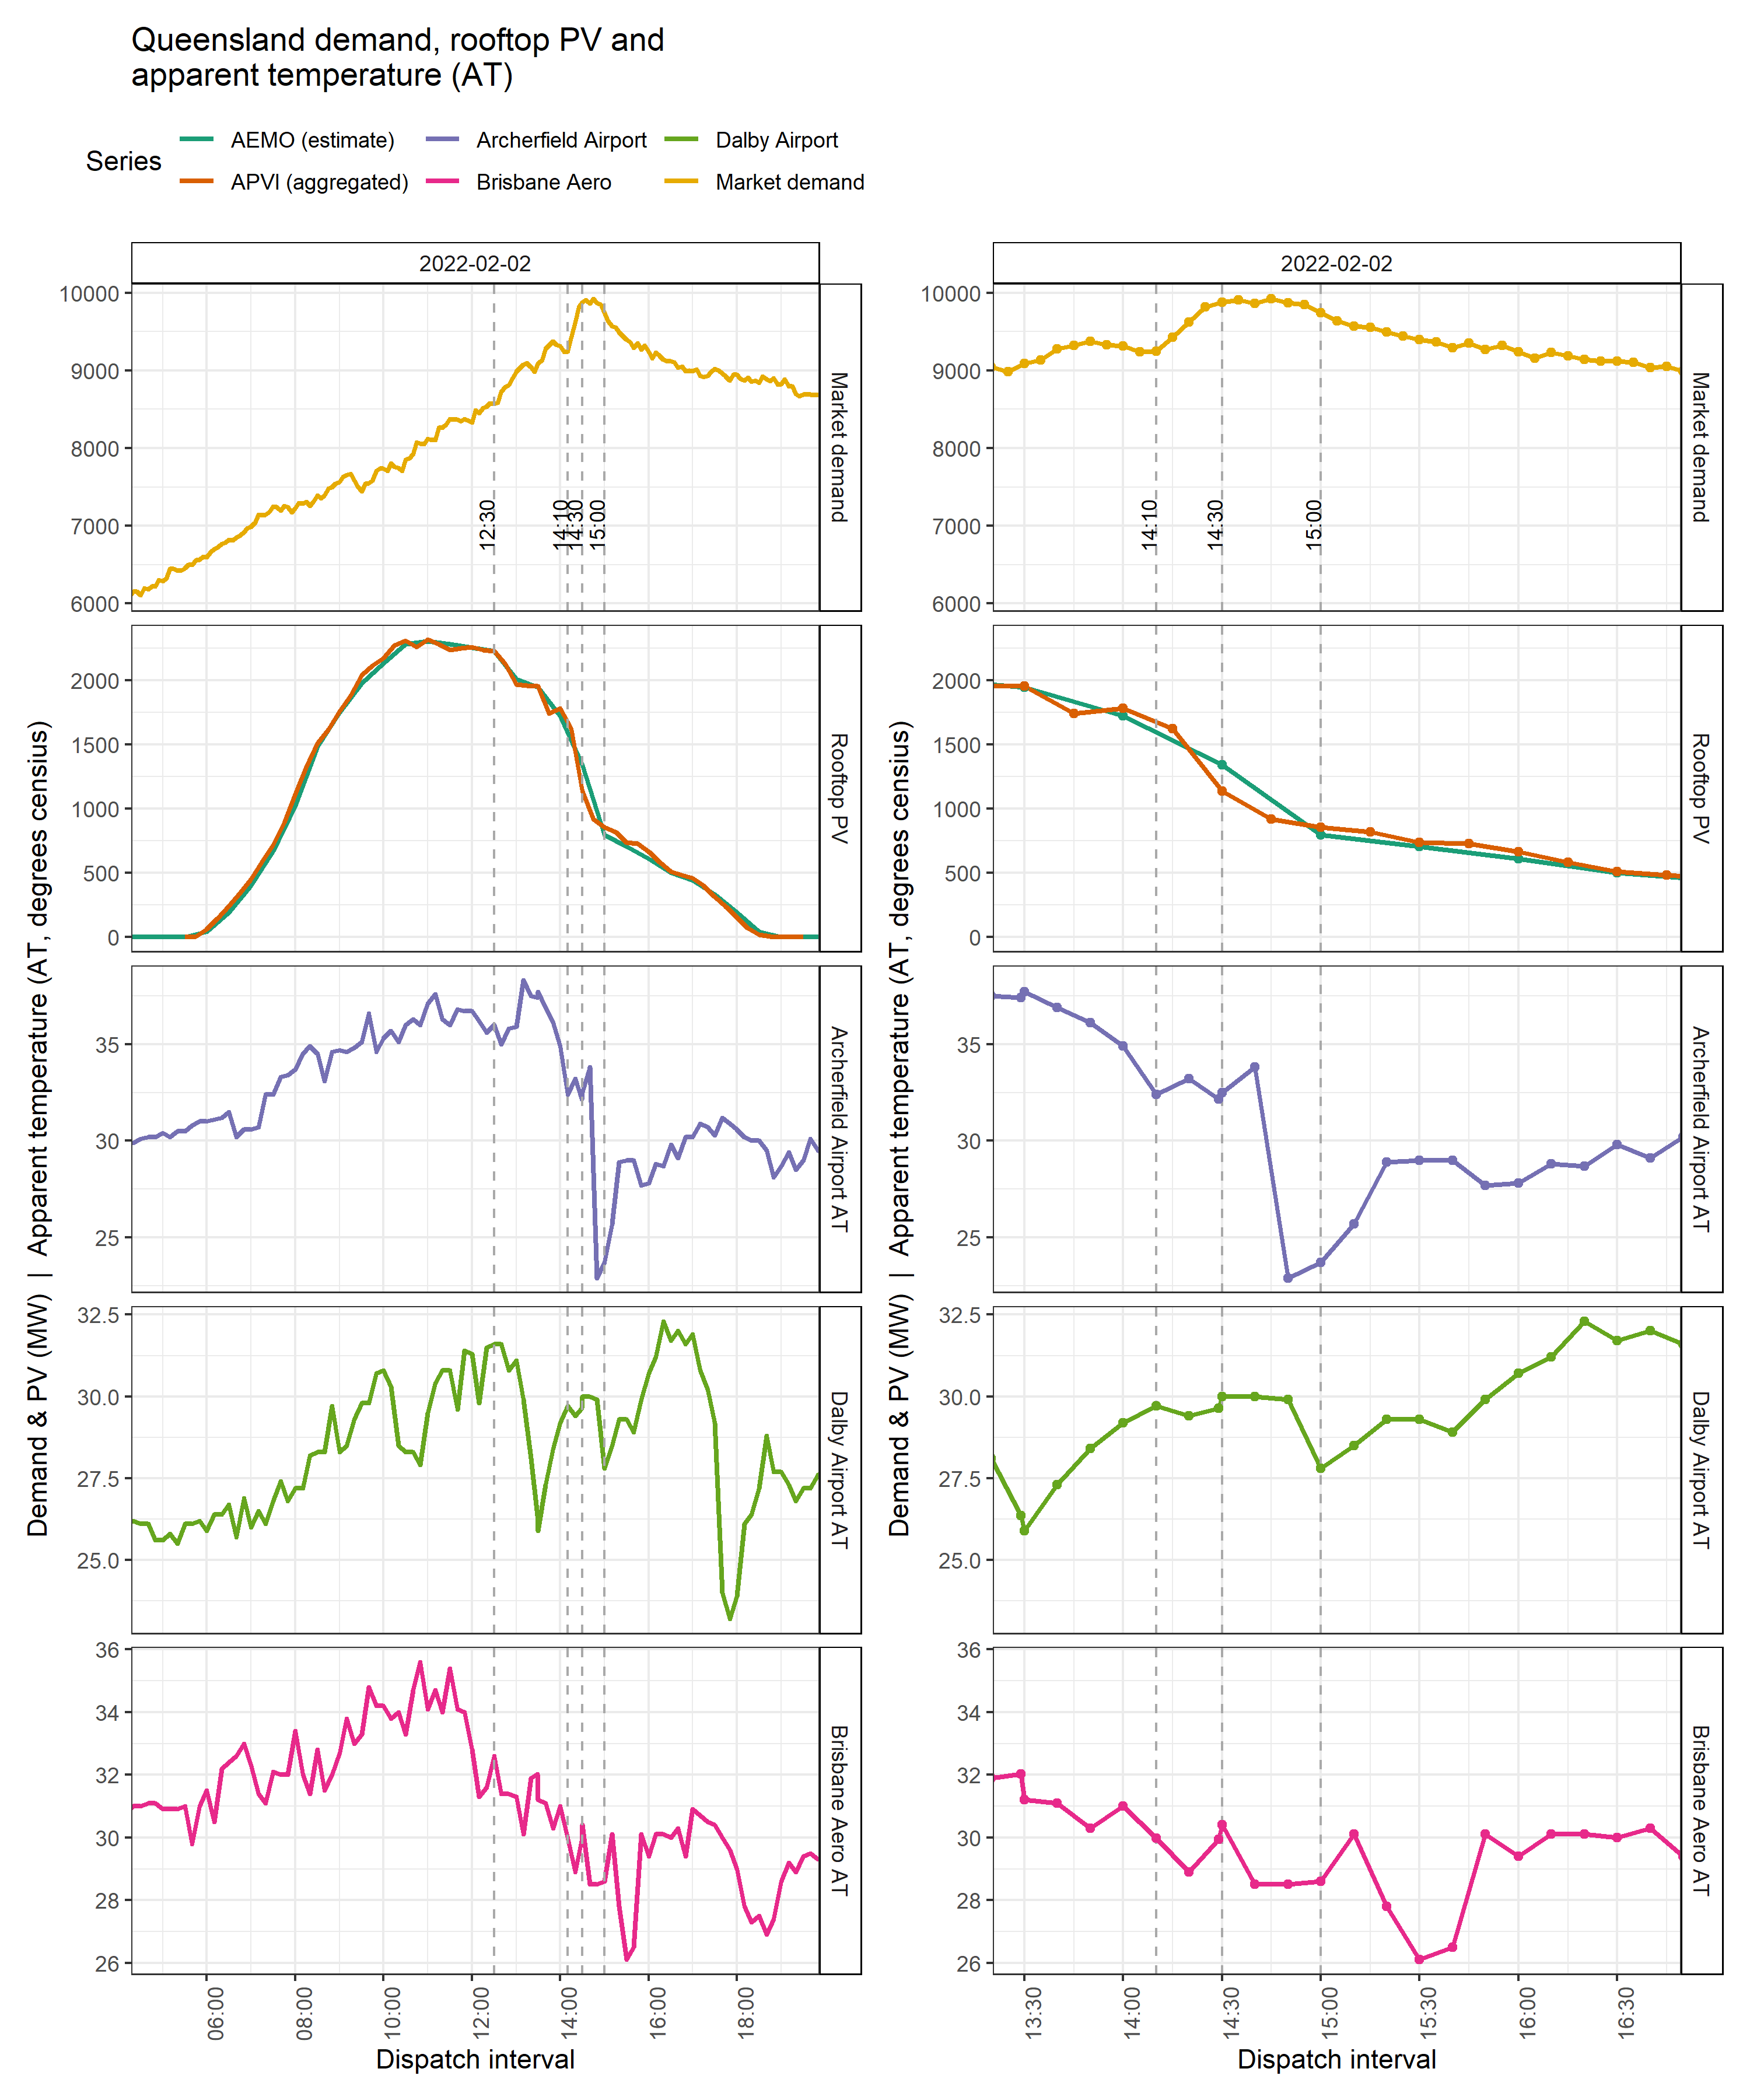
Temperatures rooftop PV and market demand on the 2nd
On Wednesday the 2nd the change in apparent temperature was most dramatic at Archerfield. Even more dramatic was the preceding spike in demand that occurred around 14:30.
The figure below charts demand , rooftop PV and temperatures, and includes a zoomed-in view of values during the demand spike.
The heat had reached a peak around 13:00 before declining be more than 10 degrees in the space of 10 minutes from 14:40.
This drop in temperature from 14:40 was roughly 20 minutes later than the drop in regional rooftop PV.
Key events, from the perspective of changes in market demand were:
- Market demand rose 660 MW in the half hour from 14:10 to 14:35. In relative terms this is as big one of the largest coal-fired generating units in Queensland.
- The drop in rooftop PV over this period was approximately 700 MW.
- Although the storm brought cooler temperatures, the evolution of the weather meant that the cloud shadows preceded their cooling effects – consumer demand had not yet reduced by the same level as the rooftop PV reduction. In fact, almost the entire drop in rooftop PV was seen as a spike in market demand.
- As with grid demand discussed earlier, market demand remained high for another 10 minutes, to 14:45.
- From a high point of 9924 MW at 14:45, market demand decreased back down to more excepted levels, down about 530 MW, over the next 45 minutes to 15:30.
- This decrease in market demand aligned with the decline in apparent temperature at Archerfield.
List of key of events around Wednesday 2nd’s demand spike
| Time | Description |
| 12:00 – 14:00 | Temperatures at Brisbane Airport were gradually dropping. |
| 14:10 | Market demand had backed down 121 MW, from an earlier peak, to 9,250 MW. |
| 14:10 – 14:35 (25 minutes) | There was a drop in rooftop PV over this period of approximately 700 MW.
Market demand rose by 660 MW. |
| 14:35 – 14:45 (10 minutes) | Market demand remained high. |
| 14:40 – 14:50 (10 minutes) | Archerfield temperatures plunged 10 degrees in 10 minutes. |
| 14:45 – 15:30 (45 minutes) | From a high point of 9,924 MW at 14:45, market demand retreated, down about 530 MW over the 45 minutes to 15:30. This decrease in market demand aligned with the decline in apparent temperature at Archerfield, yet lagged temperature by 5 minutes. |
We’ll leave it there for now.
In the next article in this 2-part series we will delve into sub-regional differences in weather and rooftop PV, focussing on Brisbane and surroundings.
I didn’t think the weather conditions were at all exceptional for this time of the year in SE QLD where most of the demand was. Yes, I am including humidity. I am not saying it wasn’t challenging weather conditions, I am just saying this normal for this time of the year. The poor design and insulation of most of the houses in the SE, combined with climate change is going to make things worse in SE QLD.
Of course the unbalanced and uncompetitive grid in QLD just makes things worse. If QLD had a similar amount of wind based generation as it does solar, then prices would be so much lower.