
Events in Queensland, particularly Tuesday’s rollercoaster ride, justifiably draw most NEM-watchers’ attention this week, as well as a record number of on-the-day WattClarity articles.
But for this post I thought it would be worthwhile running quickly and sequentially through Monday’s price events in the southern NEM states, to draw out why the NEM can be so damn difficult to predict, even on the day, and some of the traps in taking the market’s “predispatch” (PD) forecasts too literally.
These forecasts result from a formal and mandatory process where market participants’ latest bids and offers for the current trading day (and after 12:30 pm, the next trading day) are combined with AEMO’s best current projections of demand, renewable resource availability and network conditions and run through essentially the same dispatch algorithm used to schedule the real time spot market. This produces projections of spot prices, generation dispatch levels, interconnector flows etc collectively referred to as “predispatch forecasts”. Up to one hour ahead, PD produces forecasts at 5 minute resolution (PD5). For the balance of the PD forecast window, resolution is half-hourly (PD30). The process is an important component of the overall NEM design and is intended to give participants constant feedback on the outlook for prices and dispatch levels for their assets, which they may then react to by rebidding.
But predispatch can’t forecast everything, and by stepping through Monday from the perspective of a hypothetical Victorian spot-watcher (VSW), we can see why this is so.
9am outlook (NEM dispatch interval 08:00)
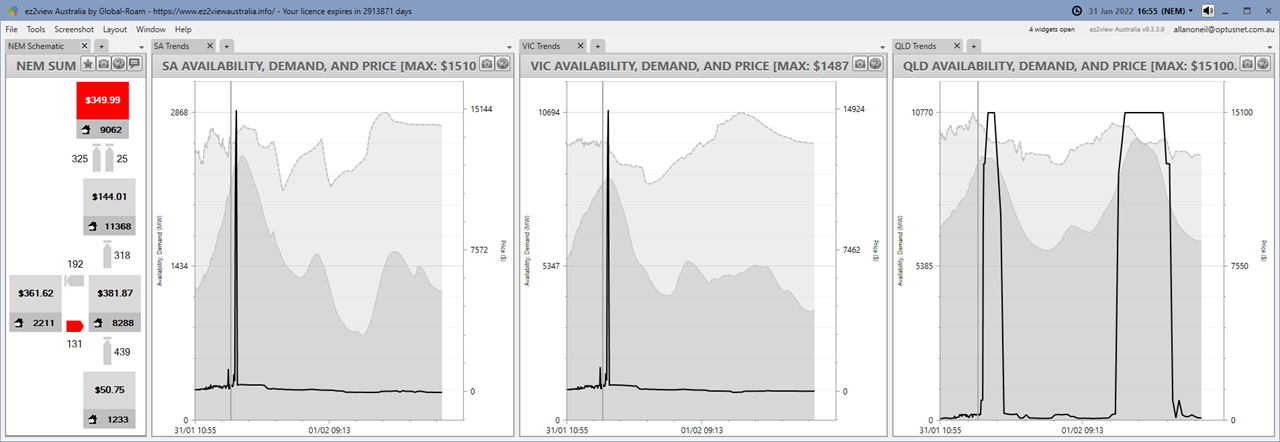
At the start of the day, which was hot and humid in the south (but nothing unusual for any visiting Queenslanders), predispatch was indicating evening peak price spikes to the market cap in three states – Queensland, Victoria and South Australia:
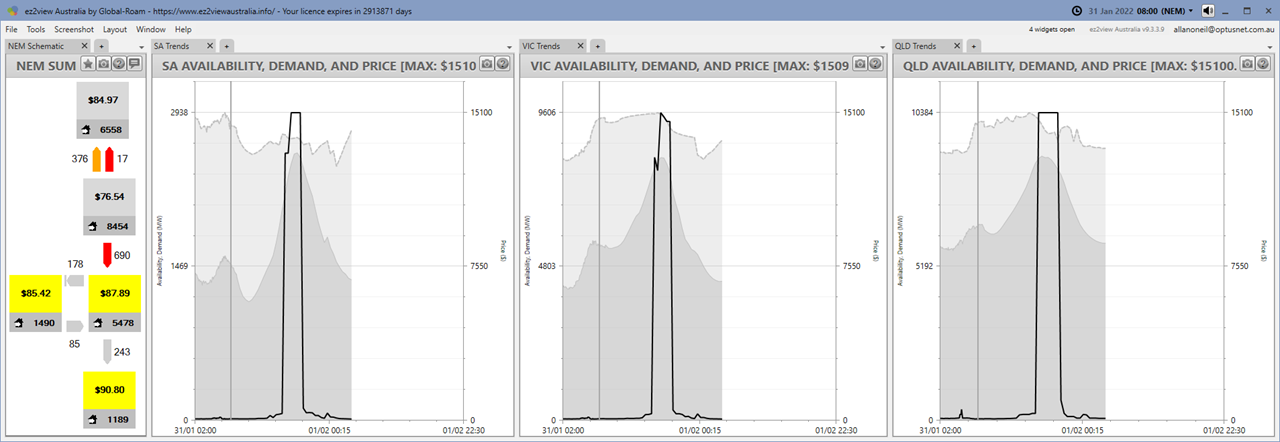
In this ez2view window [click on the graphic for a larger view], the chart lines show recent actual and PD forecast prices, with demand and generation availability the darker and lighter grey areas respectively. On the left is a schematic of NEM prices, demand and inter-regional flows for the current 0800 dispatch interval. Interconnector flows or limits are not included in the regional demand and generation data in these charts.
The duration of the forecast price spikes was around 1.5-2 hours in South Australia and Victoria and 2-2.5 in Queensland.
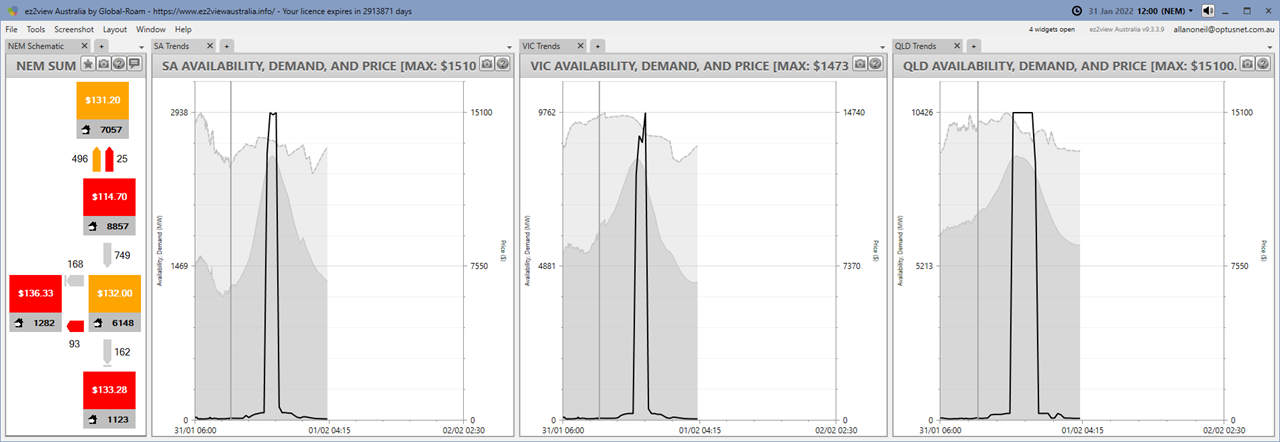
1 pm (NEM DI 12:00)
Four hours later, the picture had changed only a little with the forecast spike duration dropping in the south but extending slightly in Queensland:
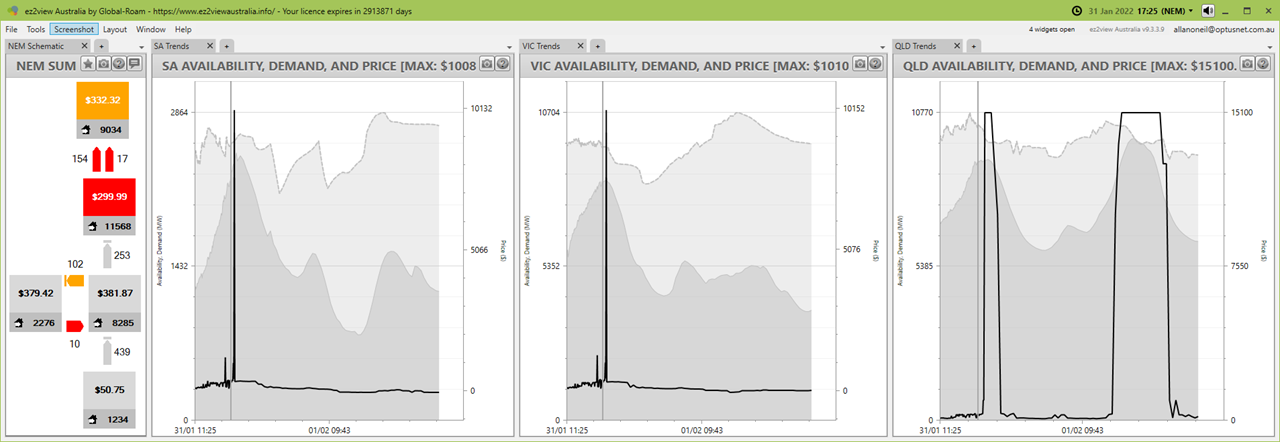
5pm (NEM DI 16:00)
Four hours later again:
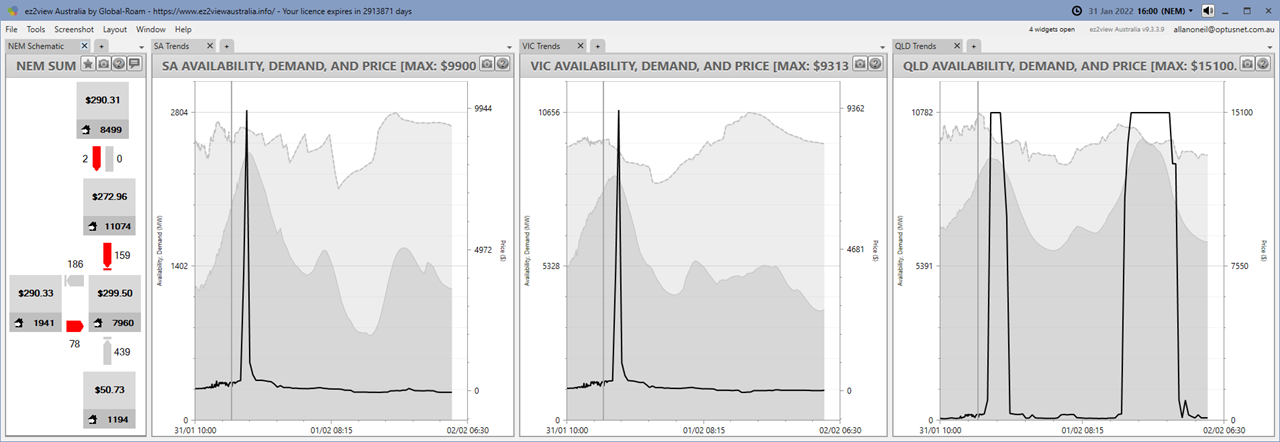
By now the following trading day (Tuesday 0400 – Wednesday 0400) has come into predispatch, with a very big event forecast for Queensland that day. But with VSW sticking parochially to Monday’s outlook for the south, the forecast spike has narrowed further to just one thirty minute forecast* near the price cap.
* As Marcelle Gannon has explained here on WattClarity, and Paul McArdle has repeatedly emphasised, in the switchover to 5 minute settlement, there is a potential trap lurking in the 30 minute PD forecast data outside the first hour (which is run at 5 minute granularity). The 30 minute forecasts are actually run using only bid, offer and demand forecast data for a single 5 minute interval within each half hour, and what might be happening in the other five intervals is somewhat opaque.
We can also see on the left that mainland prices are all approaching $300/MWh, which is traditionally where we start to see price volatility kicking off. However our Victorian spot-watcher, who we’ll assume would prefer not to see high prices, may by now feeling more sanguine about the price outlook, because the spike seems to be evaporating as supply and demand evolve and market participants rebid.
5:05pm (NEM DI 16:05)
Then stepping forward just 5 minutes, more sanguine again – now the forecast spikes have vanished from the southern states (note the scale change on the forecast charts):
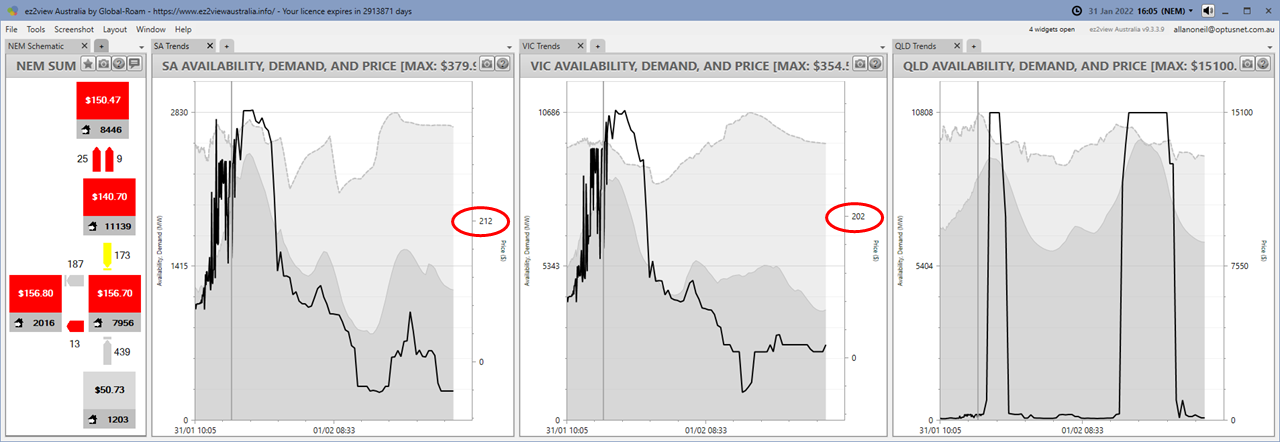
Even the current spot price has dropped back.
At this point (probably much earlier) our spot-watcher has no doubt also looked at price sensitivity forecasts – an add-on to the predispatch process – to get a sense of volatility risks:
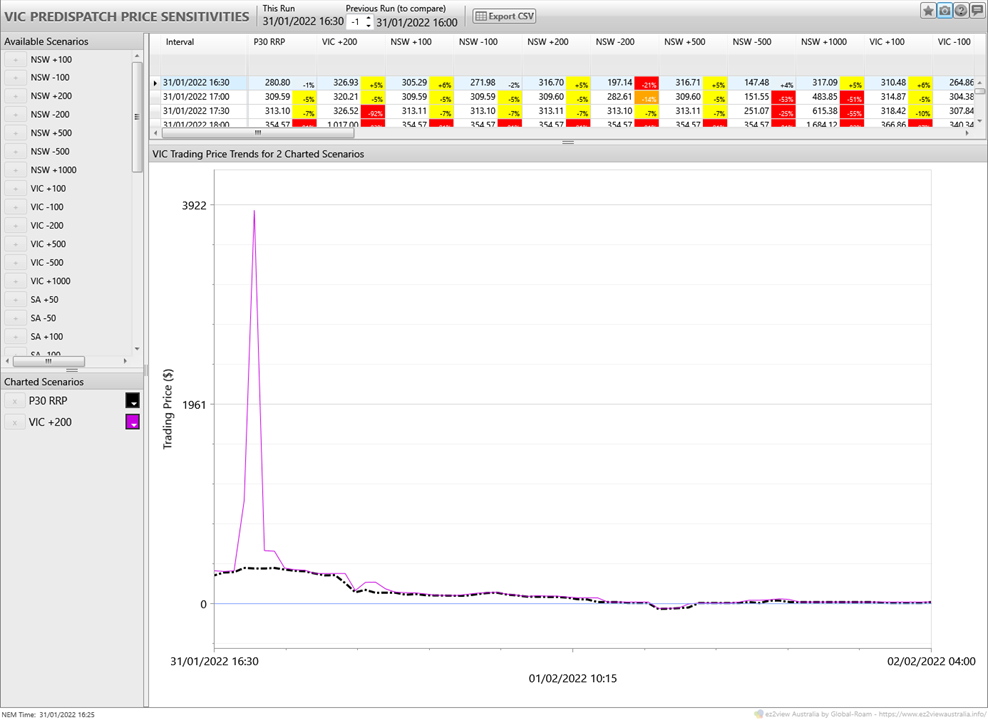
Charted above are the (30 minute) PD forecast and a version run with Victorian demand higher by 200 MW across the board, which would be enough to return some volatility to the price forecast – so the risk of high prices certainly hasn’t evaporated altogether.
5:25pm (NEM DI 16:25)
Still, 20 minutes later, things still look OK to VSW through the evening peak in the main predispatch view:
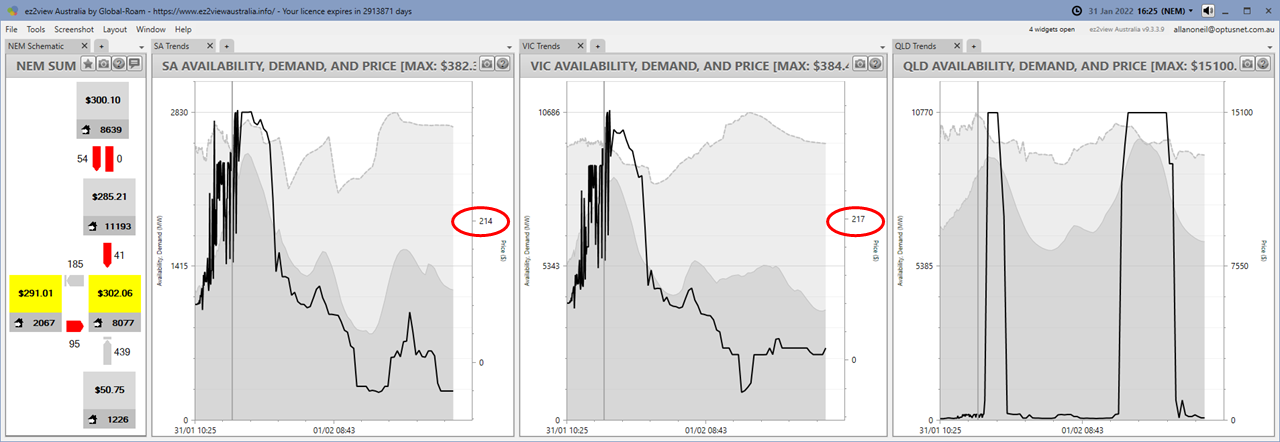
Even the Queensland spike has narrowed a bit, with its start time delayed in the more granular 5 minute PD5 forecast.
5:30pm (NEM DI 16:30)
But just as VSW might have been preparing to pack up, 5 minutes later along comes a surprise:
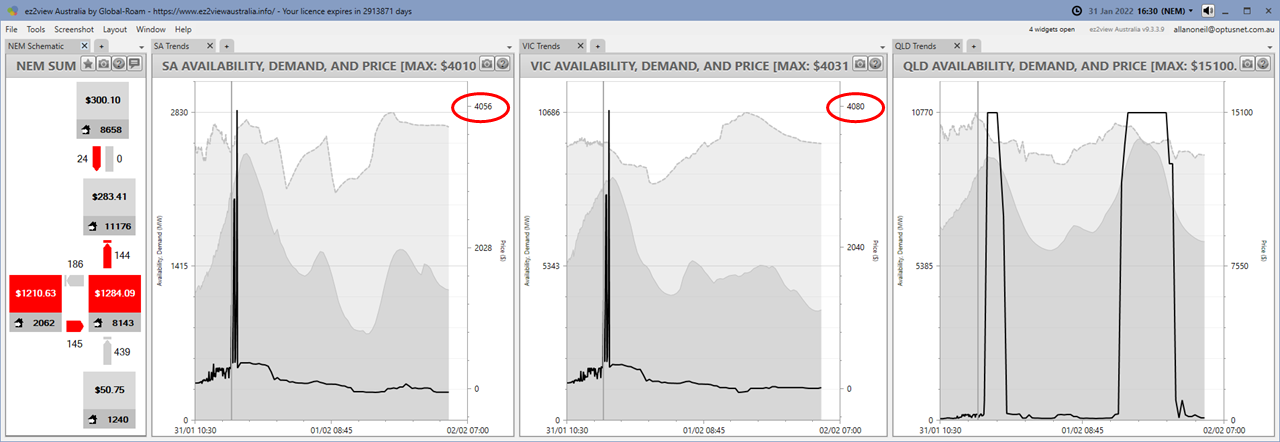
Suddenly the south has current prices over $1000/MWh and near-term forecasts up to $4000. What’s going on?
A quick check of the forecast demands for SA and Vic shows no material change. What about large scale renewable availability levels? If they drop faster than forecast, that can take out low cost supply and raise prices. But recent 5 minute actuals and successive hour-ahead forecasts show nothing much in Victoria (RHS) and only slow steady and reasonably small changes in South Australia (LHS):
But after some head-scratching, VSW might notice something on those little NEM schematic charts in the earlier predispatch views – here they are side by side for dispatch intervals 16:25 and 16:30:
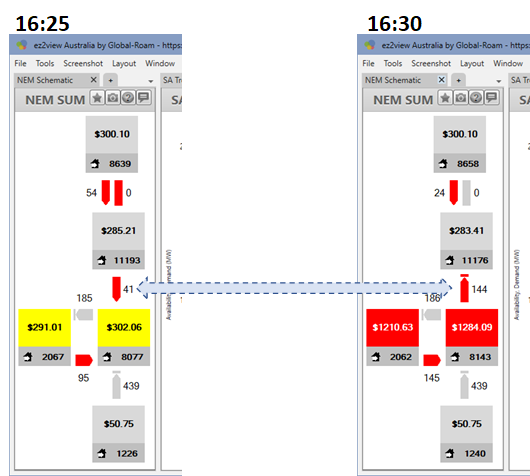
I’ve highlighted the change because it’s still not that obvious, but the flow on the VNI interconnector has flipped around from importing into Victoria, to exporting into New South Wales, and more importantly, the export is counterprice, from (now) higher priced Victoria to lower priced New South Wales. Why’s that?
At this point VSW might well decide to check the ez2view interconnector widget for VNI:
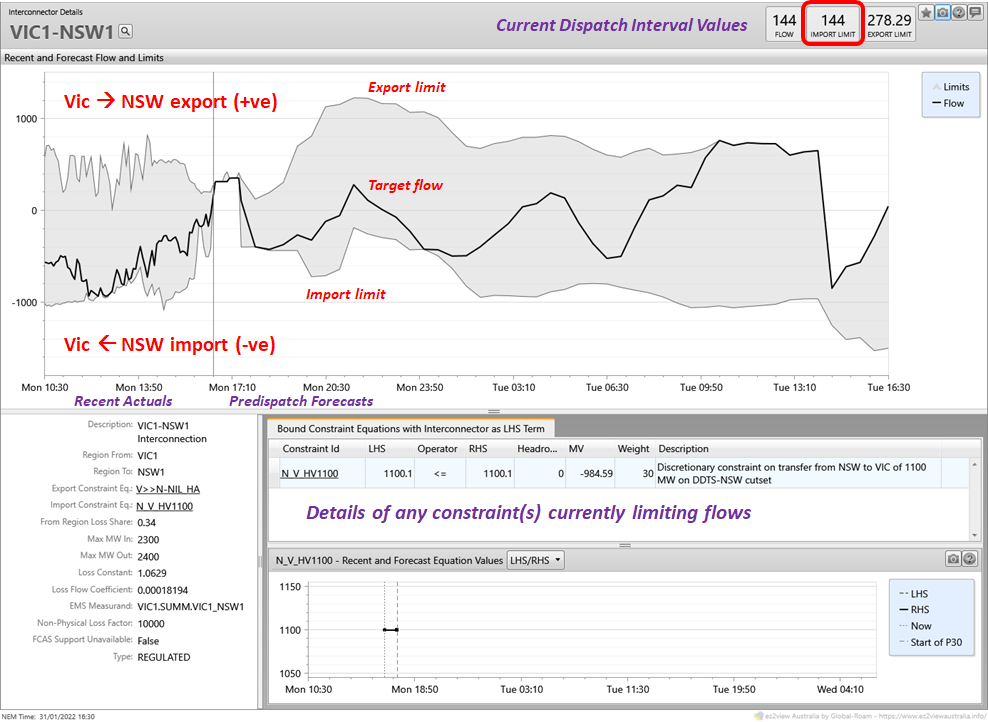
There’s a lot here but the key things are highlighted. A constraint has bound the interconnector flow, with the Import limit – which for the maximum flow into Victoria would usually be a negative number – actually being +144 MW, meaning forced export into NSW. The offending constraint is unusual as well – from the fact that its chart lacks any historical values we can infer that this is the first dispatch interval in which it’s been invoked. And the constraint description starts with “Discretionary constraint”. Whose discretion?
The rest of the constraint description is more technical. Without going into detail, what it actually does is limit to 1100 MW the total flows into Victoria from New South Wales and Snowy Hydro’s Murray generators (physically located in New South Wales but treated as Victorian generation for NEM purposes). Murray alone has a generating capacity of 1500 MW so clearly this constraint can significantly limit supply into the southern states. But why has it suddenly appeared like this?
5:45 pm (NEM DI 16:45)
15 minutes later VSW gets a (partial) answer in the form of a market notice from AEMO:
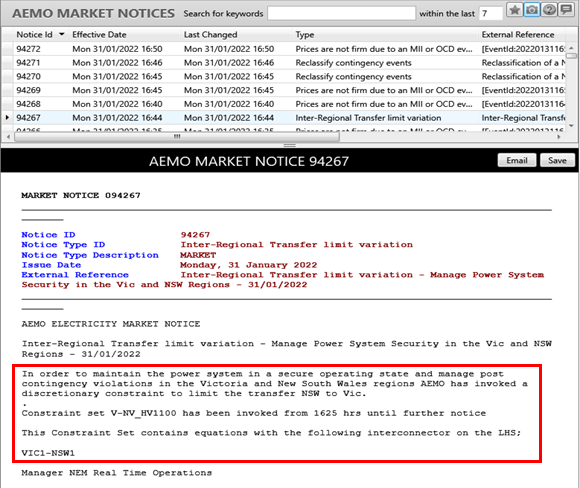
Still fairly obscure and non-specific, but (long story short), AEMO continuously runs system security checks on flows across the power system, and has detected an issue. The dispatch process normally runs with hundreds of constraints which are designed to keep the system secure against any single credible contingency, but despite this the background checking (or “online contingency analysis”) has revealed a security risk not captured by any of the currently invoked constraints. In response AEMO has manually applied a “discretionary” constraint to manage this risk. Unfortunately we don’t seem to get any further details of what the issue is and why this particular constraint was chosen – we just see its effect.
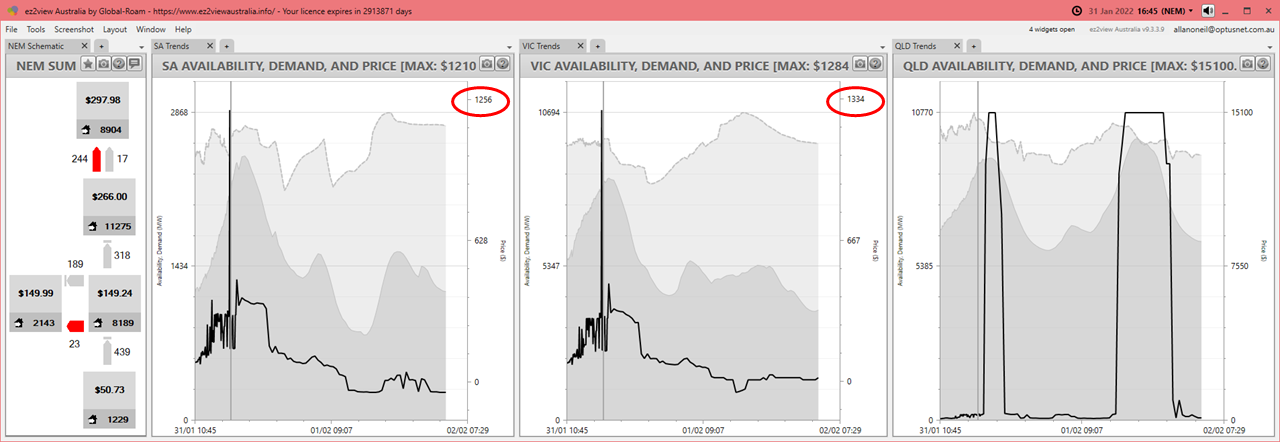
Even so, things seem to have settled, despite the sudden limitation on supplies from Murray and NSW, after that one five minute spike to ~$1,200/MWh. The price outlook still seems relatively benign in the south, at least compared to Queensland (again, note the different scales on the three charts):
10 minutes later (NEM DI 16:55)
But VSW is now on the alert, and a couple of DIs later, forecast price spikes to $15,000/MWh territory reappear for Victoria and South Australia. Obviously with reduced available supply from NSW and Murray, it would take less of a blip on the demand or supply sides to send prices soaring:
6:25pm (NEM DI 17:25)
Half an hour later, the forecast spikes are still there; but VSW maybe takes some heart from the fact that the forecast Queensland spike still hasn’t started – perhaps those in the south won’t either:
But ten minutes later, no such luck. The actual price goes to $13,000/MWh levels, beating Queensland to that landmark (a dubious honour):
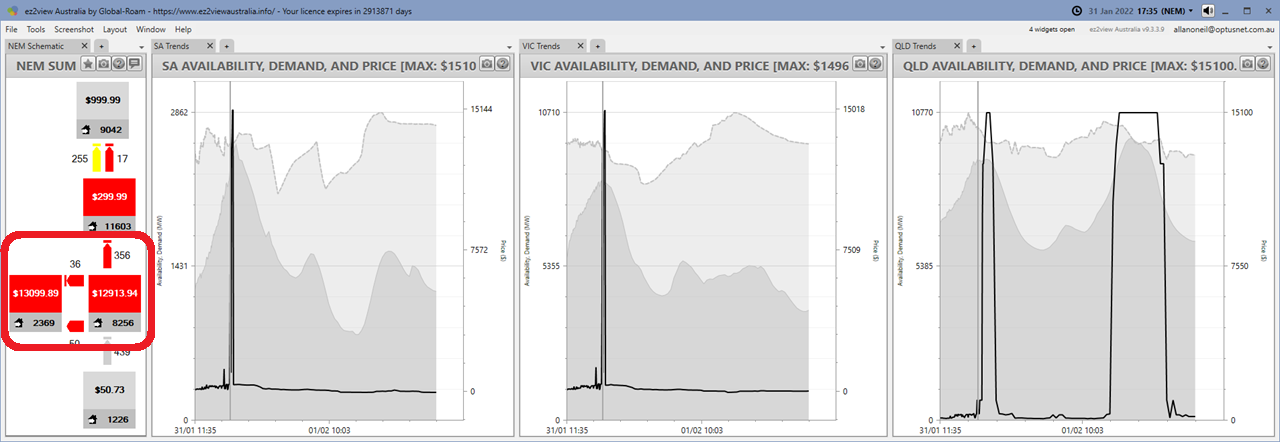
Notable on the schematic for the current dispatch interval at left is that the constraint on VNI flows is actually forcing over 350 MW out of Victoria, with the price at $12,914/MWh, into New South Wales at $299.99/MWh. This would be generation from Snowy’s Murray station having been bid to maximise output at high Victorian prices, but with only 1100 MW of that output actually able to flow south because of the constraint, the dispatch process has to ensure that the rest flows northwards into New South Wales (by reducing generation dispatched in that region).
If it strikes anyone as strange that the dispatch process chooses energy priced at $12,913/MWh over $299.99/MWh, it’s because that process uses offer prices to dispatch the market. If Snowy Hydro is offering Murray’s generation at (say) $0/MWh or-$1,000/MWh, that energy will be selected over a generator in New South Wales offering at $299.99/MWh. But because Murray is located in the Victorian NEM region, it is paid the Victorian spot price. Happy days. That Victorian spot price is meanwhile being set by some much more expensive offers in Victoria or South Australia that Murray generation can’t displace because of the discretionary constraint on southward flows. But Snowy’s party won’t last long, because an additional automated “negative residue management” constraint will soon be applied to the VNI interconnector to prevent counterprice flows like this. At that point the dispatch process will have to wind back Murray’s output towards 1100 MW.
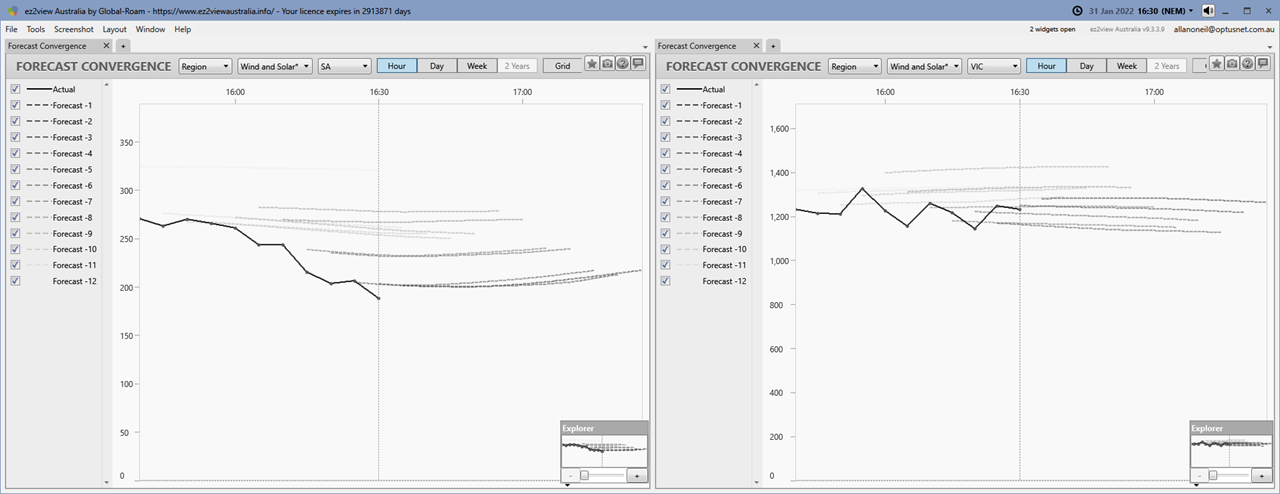
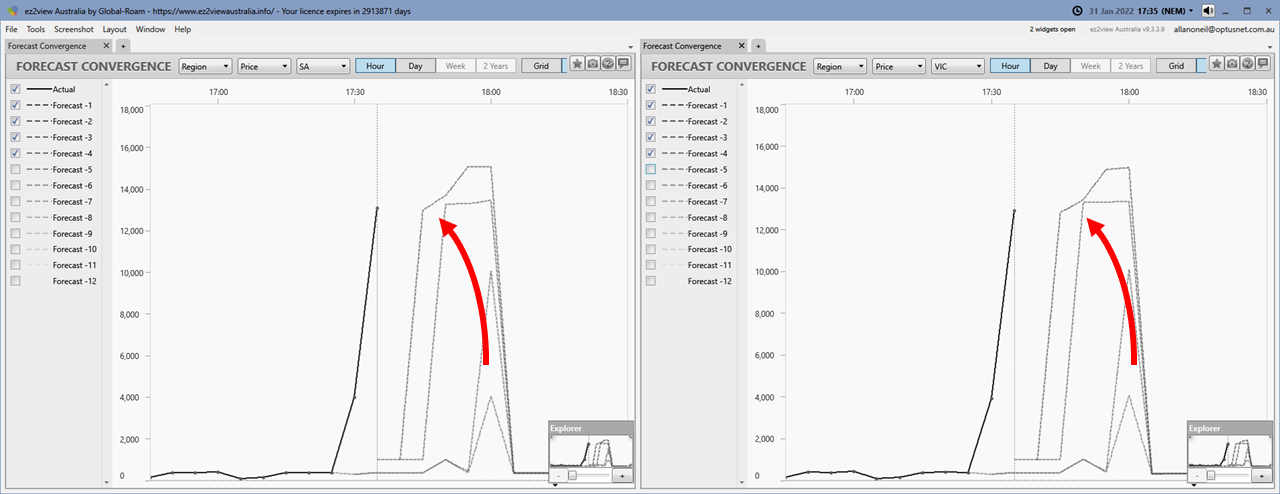
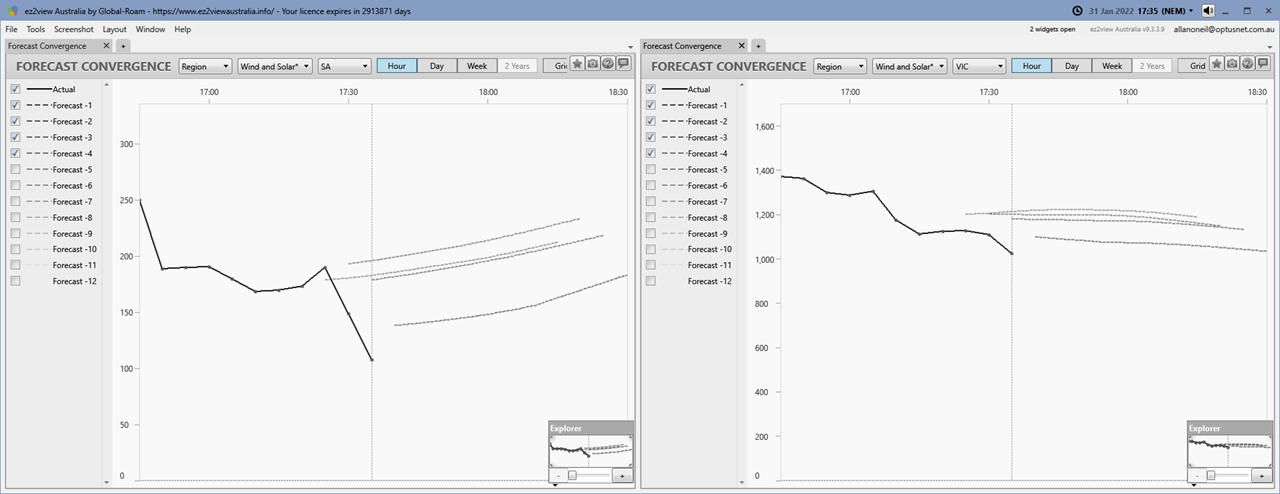
A quick look at recent successive 5-minute PD price forecasts in a forecast convergence view shows how the high prices in these forecasts have grown and shifted forward in time over the last twenty minutes or so:
And looking again at a similar view for large scale renewables availability might also concern VSW because actual availability (solid lines) now appears to be tracking downwards much faster than the forecasts (dashed lines) fed into the predispatch outlook, meaning that high prices might go even higher or for longer than forecast:
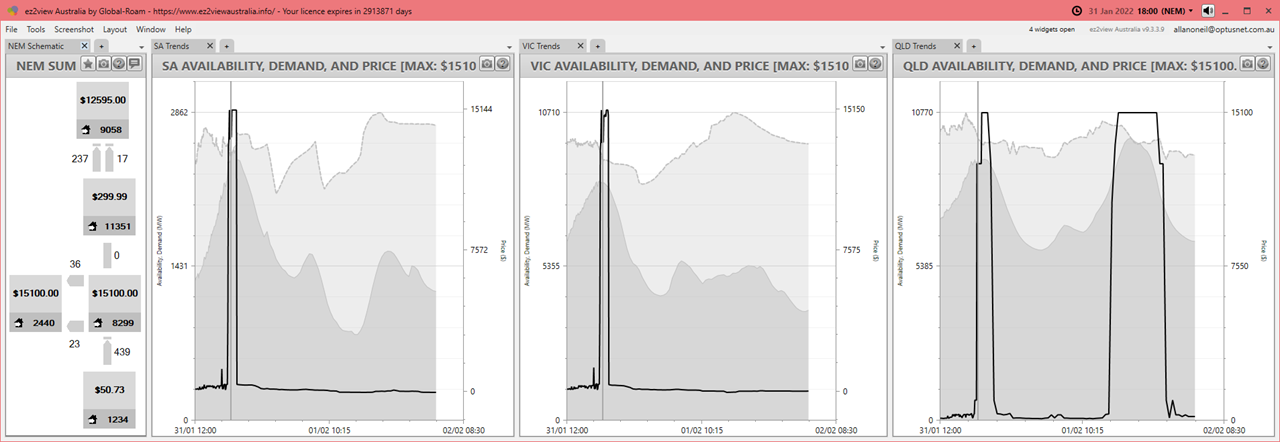
7pm (NEM DI 18:00)
By now there have been thirty minutes of five-digit prices in the south, with more forecast to come. VSW is getting quite depressed, this is not a competition with Queensland that they want Victoria to win:
The recent trajectory for large scale renewables availability in Victoria has indeed not been favourable, and further decline is forecast (the sun is getting lower after all):
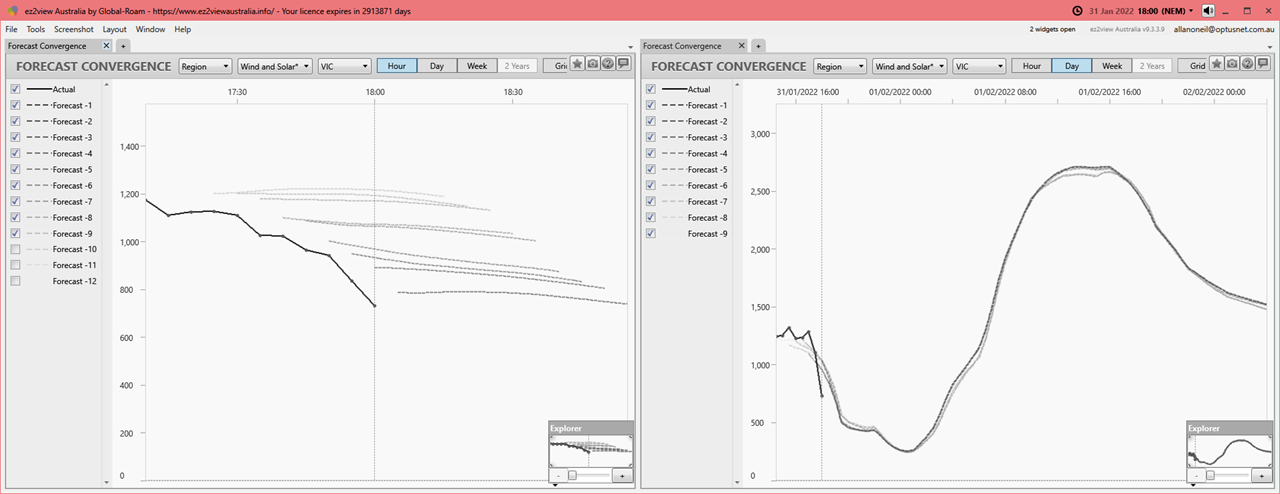
(Five minute actuals and forecasts at left, 30 minute values at right)
But 5 minutes later, southern prices are suddenly down below $300/MWh again:
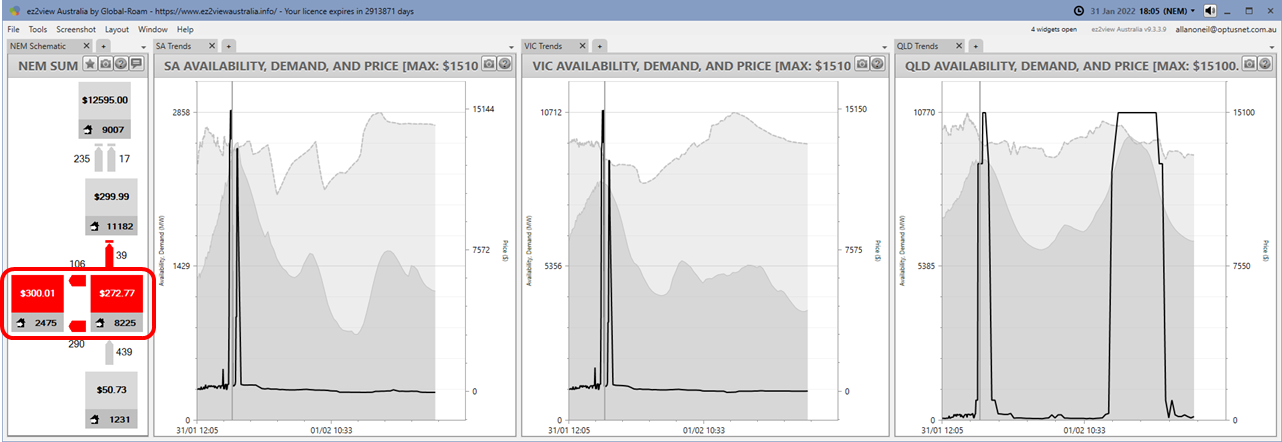
And checking what Murray generation has done over the last few dispatch intervals explains why:
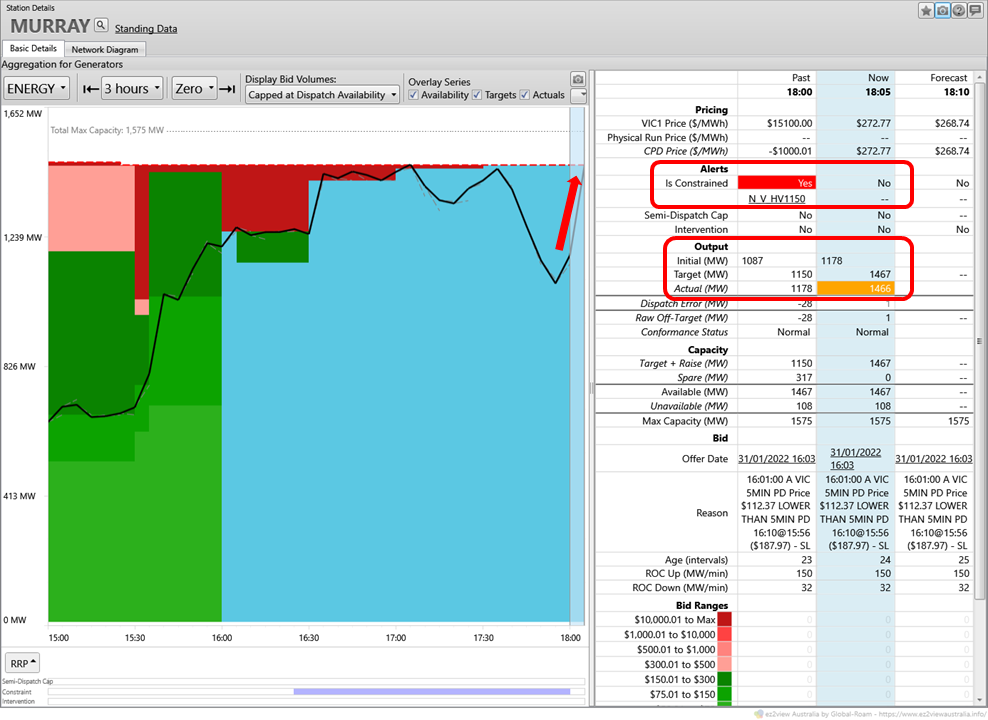
At 18:05 the constraint holding back its generation from Victoria lifted, and output – offered at the market price floor of -$1,000/MWh – was able to climb back up close to capacity, with most of that now flowing southwards. (In real time, VSW would not have been able to see details like Murray’s bid prices, but its output and the effect of the constraint would have been visible.)
At this point VSW breathes a sigh of relief and heads home – well, from home office to lounge room – after a long day, although still pondering the mysteries of discretionary constraints.
Final thoughts
Outcomes for this day were a good illustration of what the NEM’s predispatch processes can and can’t do. Overall, the forecasts for both Queensland and the southern regions were good indications of volatility risks in those states. The changes in those forecasts through the day – particularly those we focused on in the south – can be frustrating for onlookers like VSW. But forecasts are only as good as their inputs allow, and apart from the inevitable variability in weather – which is increasingly driving both the demand and supply sides of the market – there are numerous complexities in the NEM which can’t always be forecast. Unexpected system security risks not captured by the standard sets of constraints that AEMO and the network operators spend a lot of time and care devising, and the on-the-spot responses to those risks, are just one example.
============================================================================================================
About our Guest Author
 |
Allan O’Neil has worked in Australia’s wholesale energy markets since their creation in the mid-1990’s, in trading, risk management, forecasting and analytical roles with major NEM electricity and gas retail and generation companies.
He is now an independent energy markets consultant, working with clients on projects across a spectrum of wholesale, retail, electricity and gas issues. You can view Allan’s LinkedIn profile here. Allan will be sporadically reviewing market events here on WattClarity Allan has also begun providing an on-site educational service covering how spot prices are set in the NEM, and other important aspects of the physical electricity market – further details here. |
Can you do a similar explainer about why so much energy from NSW is being exported into Victoria against a price gradient? For example at 16:10 NEM time on Sunday 6 February 624 MW was exported from NSW with a high price to Vic with a low price (according to the AEMO website). This is now occurring quite often, and it’s a much larger quantity than we would expect than just from the far western NSW solar farms.
Good observations Malcolm. This is almost certainly to do with the N^^N_NIL_3 or X5 constraint that featured in a couple of articles here a while ago (https://wattclarity.com.au/articles/2020/12/casestudy-followup-x5-constraint/).
Essentially that constraint can choose between curtailing generation in SW NSW by 1 MW or swinging flows between Vic and NSW by 10 MW as long as the price difference is less than about $100/MWh. So we see plenty of situations like the one you highlighted.
But I agree it would probably be useful to summarise the impacts it has been having, and why, in a follow-up piece sometime, now that it’s been in operation for a while.
Allan.