Having looked specifically at Callide and Yallourn (coal-fired stations) on Saturday afternoon, I thought (at the time) that I might as well use the same ‘MT PASA DUID Availability’ widget in ez2view to have a look more broadly at how the performance of the broader fleet of generators has been tracking against expectations provided at the start of Quarter 2 (i.e. last run 18:00 on Wednesday 31st March 2021).
I started to do this back then but did not get finished … but thought I would quickly throw together the snapshots I’d taken on Saturday afternoon to share with you now.
1) Readers should note that in the discussion below ‘now’ should mostly be read as applying Saturday afternoon (i.e. when the snapshots were taken); and
2) These are provided below with minimal discussion (except for coal), but as something that might be referred back to later.
(A) All coal (Scheduled) units
Earlier last week (on Wednesday 16th June) I had noted how the ‘Availability of Black Coal units has suffered through Q2 2021’ – which has been one of the reasons for the heightened volatility that we’ve seen through Q2 2021.
1) Time permitting, valued guest author Allan O’Neil will be having a closer look at some of the other factors as well.
2) Allan already started with ‘An Appetiser’ yesterday.
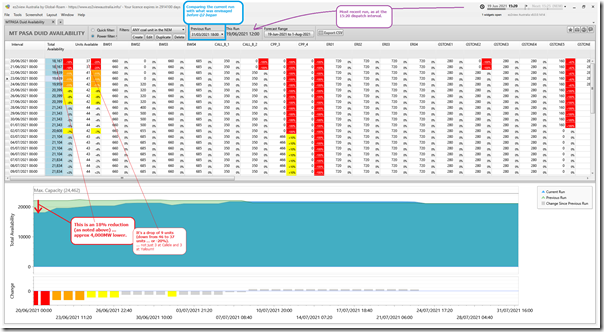
There are currently 48 x remaining coal units in the NEM … 38 of these black coal in NSW and QLD, plus 10 x brown-coal units in VIC. We’re part-way through a deeper dive into how availability performance has changed over the past 2.5 years since we released the GRC2018 in the up-coming issue of GenInsights21 and will look forward to sharing a lot more there.
For now, I’ve attached a snapshot from ez2view v8.0.0.1414 (which was released on 1st April 2021):
As noted earlier, you won’t find this widget (and other new ones) in ez2view version 7 (the legacy version – that we’ll be switching off for Five Minute Settlement on 1st October 2021).
At the time this snapshot was taken, the ‘current run’ for MT PASA DUID Availability was still for 12:00 today. Compared with the last run of Q1 2021 (i.e. 18:00 on Wednesday 31st March 2021) we can see:
Observation 1) For the first two days shown in this current run (i.e. Sunday 20th and Monday 21st June) we see the current run has an expected available generation capacity that’s approximately 4,000MW lower (i.e. am 18% drop) than what was forecast at the end of Q1;
Observation 2) Which equates to 9 units fewer in service:
2a) That’s 37 units now compared to 46 units at the end of Q1;
2b) There are 6 x headline units:
(i) Callide B2, C3 and C4 … as we have been reporting
(ii) Yallourn 2, 3 and 4 … as we have been reporting
2c) Plus there are another 3 units (in net terms) out at this point that were not expected to be out at 31st March 2021
(B) All gas (Scheduled) units
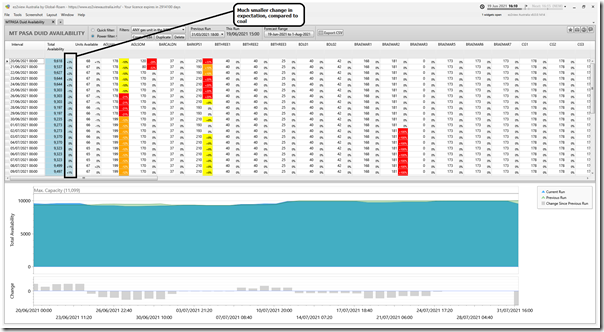
I then thought it would be of interest to flip the view and explore all gas-fired units in the NEM, and specifically changed outage expectations:
Observation 3) As we can see, there’s not been as large a change in expectations – at least in terms of Available Generation.
3a) Note that this only shows expected availability, not how the units would bid, or how they would be dispatched.
3b) For instance, units manage any energy constraints (e.g. availability of gas) in how they bid.
(C) All liquid (Scheduled) units
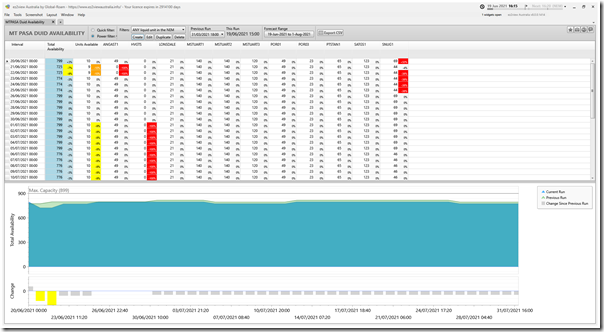
Here’s the same view for Liquid-Fuelled plant:
Observation 4) In percentage terms, the change in expectation for Availability of Liquid-Fuelled plant is lower than it is for coal.
(D) All hydro (Scheduled) units
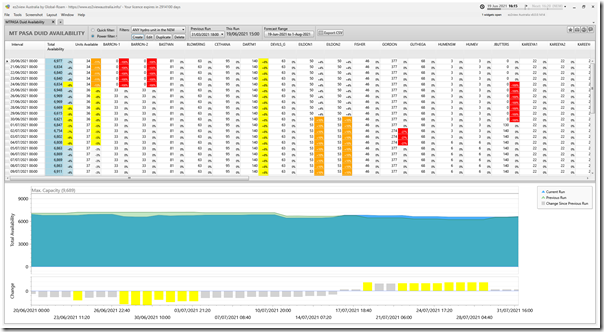
Here’s a view for all of the hydro plant in the NEM:
Observation 5) In percentage terms, the change in expectation for Availability of hydro plant is lower than it is for coal.
5a) As for gas (and liquid) worth noting that this shows expected availability at any price;
5b) In particular, hydro units use bidding behaviour to manage energy constraints (limits on available water in storage).
(E) All battery (Scheduled) units
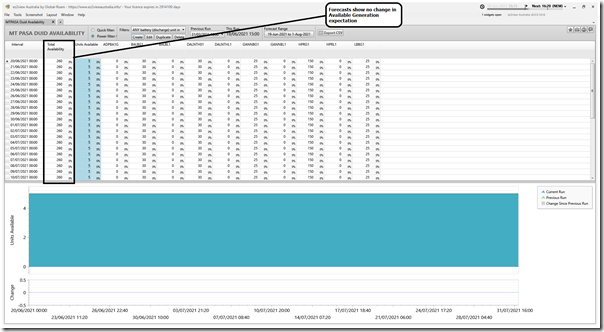
Here’s a view for all 5 existing battery units.
Observation 6) There is zero change in expectations!
6a) In the 12-week look-ahead shown in the window, the forecast availability sits at 260MW and does not change
6b) There’s also no change in expectation shown compared with what was bid at 31st March 2021
6c) Indeed, in zooming out (not shown here) for 3 years into the future there is no dip shown, and no change in expectations.
Now, before we start down the path of ‘batteries being magic wands‘ I thought I would take a closer look, as something did not intuitively make sense with this….
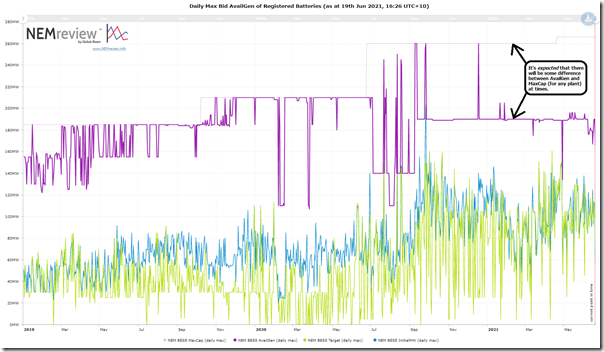
So I looked historically at ‘Daily Maximum Available Generation’ for batteries (with this query) in NEMreview v7 to see a more nuanced picture compared to the idealised view above:
Observation 7) Historically there has clearly been a change in AvailGen from one day to the next (more like what we would expect)
7a) … indeed, we see that the Aggregate AvailGen for a day has almost never been at full 260MW for any day in the past 12 months since June 2020.
7b) I’ve not got time to delve into this (may well be to do with ‘State of Charge’) but just added here as a caution to reading too much into the figures bid by the batteries into MT PASA.
(F) All wind (Semi-Scheduled) units
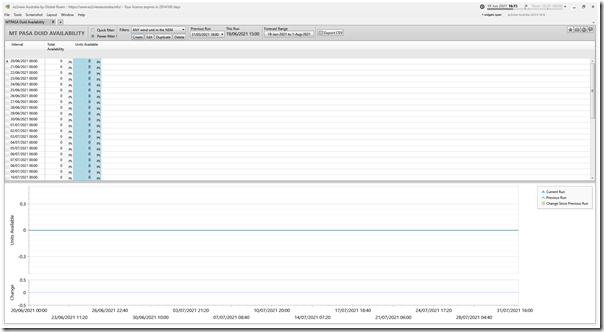
Moving onto the Semi-Scheduled units, starting with Wind Farms, we unfortunately are all a victim of ‘the Invisible Man‘ here:
As noted in this coincident article today, it’s great that AEMC passed a rule change largely approving what had been suggested by ERM Power in their rule change proposal (with clients now benefiting from the ‘MT PASA DUID Availability’ widget in ez2view, for instance) … but why, oh, why, did the rule change not also extend to Semi-Scheduled assets?
Seems to be a sort of ‘shoot self in foot’ instance that does not really reflect where the market is headed for the future?
(G) All solar (Semi-Scheduled) units
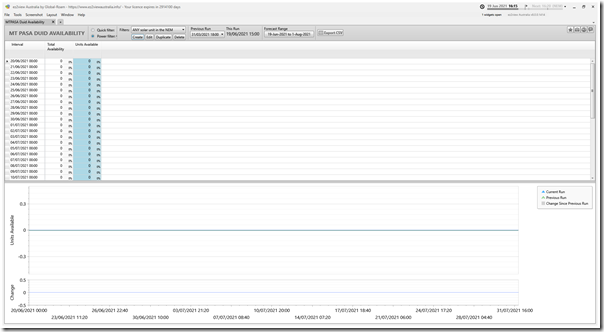
We see ‘the Invisible Man‘ also at work for Large Solar Farms … as if they will never have to undergo scheduled maintenance?


Sorry for the very belated comment Paul but having done some similar analysis recently on coal units for Q2 2022 I came to this post. I can’t see that there would have been much material value or meaning to inclusion of semi-scheduled generation in these datasets, so I think the rule change was sufficient. While including S/S capacity might have shown some small variations in maximum capability of wind and solar farms (eg known maintenance on a few wind turbines here and there), or commissioning profiles on newer farms, these variations would be dwarfed by uncertainty in future sun and wind levels, so information on maximum output of any wind or solar farm, let alone the whole fleet would be of very limited value. The STPASA forecast availability datasets based on ~1 week’s weather forecast, and also incorporating known capacity restrictions, seems as much as one could or should expect.