It’s been a period recently with weather impacts on electricity supply systems in the news – not only in the NEM but also in Texas (unfortunately again) and in other places.
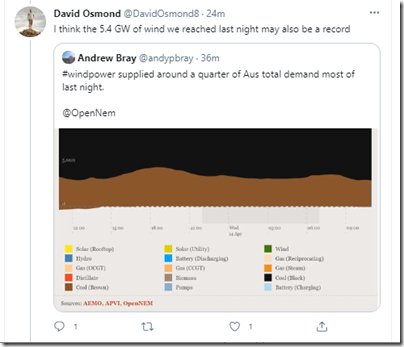
David Osmond posted this question on Twitter today:
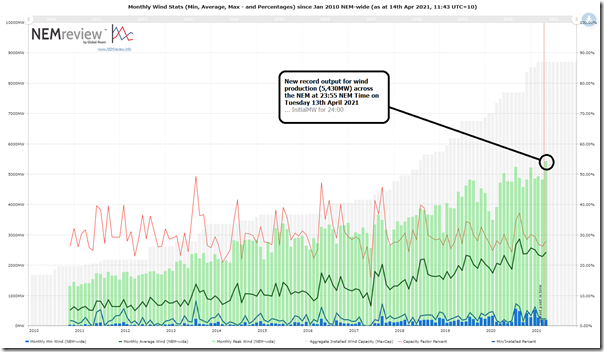
By opening up this pre-prepared query in NEMreview v7 I was able to quickly determine that this was in fact the case:
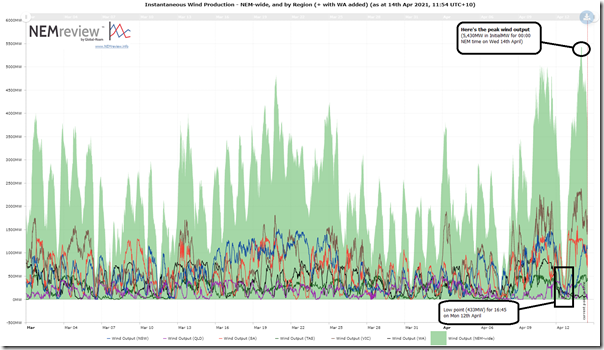
Here’s more of a zoomed-in view of NEM-wide instantaneous production (query is here, for those with a licence), but also broken down for each of the 5 regions (and with wind production in the SWIS in Western Australia added in for good measure):
Worth noting a couple points for the different types of readers here on WattClarity (including some at either end of the Emotion-o-meter):
(A) Peak Output
In both charts we can see the peak output we achieved in the middle of last night (5,430MW at 23:35 on Tuesday 13th April 2021) was a new all-time record, which surpassed the previous peak of 5,242MW in August 2020.
With installed capacity of 8,703MW (i.e. sum of the ‘MaxCap’ for all Wind Farms in AEMO’s Production Systems) that represents an instantaneous capacity factor of 62% at the time.
(B) Average Output
As more capacity is added to the grid we see that the monthly oscillations of average capacity factor are dampening and that the average is ending up around 30%.
This is not really a surprise (as 30% has been a number often quoted in these terms) as it is a function of the increasing diversity of wind harvest, as wind farms are built in new areas. Readers need to keep in mind that this average is also somewhat reduced by the commissioning processes that mean that full output lags the addition of the full capacity in the AEMO’s NEM registration systems.
(C) Minimum Output
However, for those who are keen to think of diversity as some kind of ‘magic wand’ the inclusion of minimum output (and minimum monthly capacity factor) should provide real evidence that this is just not the case.
We can see in the first chart above that the highest monthly minimum capacity factor through 2020 was down at 7.3% for the month of September, with a number of months in the 1-2% range. This is not a surprise for us (and should not be a surprise to anyone)….
… no matter how much wind capacity is built in the NEM (or where it is built), there will always continue to be be times when the aggregate output is a very low percentage of installed capacity. We’d better get much, much better at planning for these ‘wind droughts’.
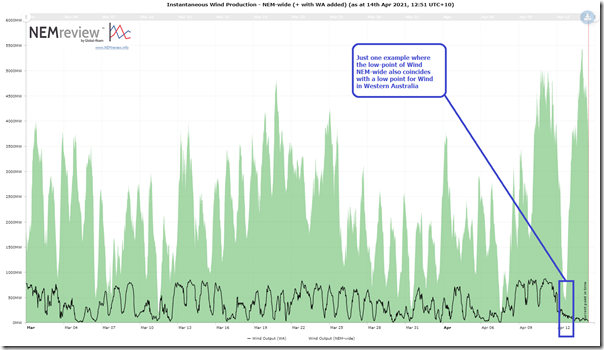
The second chart is a bit busy, with all of the region summaries on them, so I have removed each of the individual NEM regions but have retained Western Australia to highlight just how difficult it will be to find wind generation patterns that are truly anti-correlated – ‘just’ random correlation (i.e. correlation co-efficient = 0) is not sufficient for wind generation to have any significant capacity benefit:
Under 2 days before the NEM set the new ‘highest ever’ record record for wind production across the NEM (i.e. 16:45 NEM time on 12th April*) we saw a low point below 500MW aggregate consumption (instantaneous capacity factor of 5% – so reasonably high for a low point!) – which coincided with a low point for wind production in Western Australia (at least for the data we collect – we don’t invest much time watching the WEM, so might have missed some new wind farms there?):
* note on that particular occasion I have not looked at the timing of the cyclone, and possible high-speed cut-out there. There are plenty of other coincident low points we can see in the 40-day stretch shown on this chart.
(D) Exploring further in GenInsights21 … pre-order your copy now
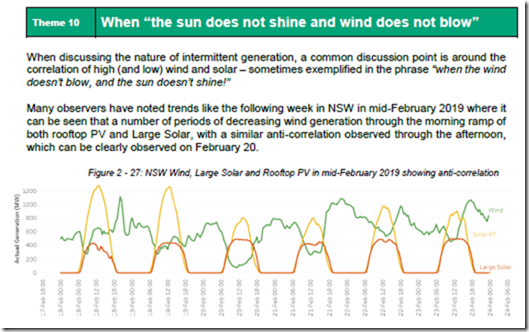
When we (working with Jonathon Dyson’s team at Greenview Strategic Consulting over two year ago) compiled the massive Generator Report Card 2018, we included a specific focus on exploring the question – what happens when ‘the sun does not shine and wind does not blow’?
This was Theme 10 in Part 2 of the 180-page analytical component of the 530-page GRC2018.
Coincidentally, I saw Cornwall Insight also publish a short note on the topic under ‘NEM wind generation: Do birds of a feather flock together?’ last Thursday 8th April, presenting very similar results to what we published in the GRC2018 two years ago. It’s great that others are also helping to extend awareness of these challenges!
Since the release of the GRC2018 we have updated and extended the statistical component in the GSD2019 and then the GSD2020 (also with a Data Extract).
We are now in the process of updating the analytical component with the intention of releasing during Q3 2021 as ‘Generator Insights 2021’. For ‘GenInsights21’ we are already on the way to massively extending the work we did in the GRC2018 to explore and analyse diversity challenges, and will look forward to having that component released – along with a diverse range of others.
We’d invite those who want to pre-order now.
We won’t process your payment until you’ve been provided with access to the PDF copy of GenInsights21 (and a hard-copy has been delivered to you). We currently expect to do this in Q3 2021.
—-
That’s all I have time for in this article.


Too bad the max output is worthless.
The minimum reliable output (choke point) is what matters and that is usually in the sub 2% (sub 300MW) range.
Just 2 weeks ago on 31 March wind power generation across the NEM dropped to just 268MW out of an installed capacity of 8100MW.
Breaking a few records recently with renewables due to the weather I see-
“Persistently low electricity prices below their cost of generation required AEMO to direct South Australian gas-powered generations on for system security for a record 70 per cent of the quarter,”
https://www.msn.com/en-au/money/markets/solar-panels-cooler-summer-drive-power-prices-into-negative-territory-in-south-australia/ar-BB1g8v17