The couple of price spikes seen in the QLD region today (Saturday 10th April) reminded me that I was going to take advantage of the additional ‘next day public’ data the AEMO publishes* early each morning to see more of what happened in the QLD region at 14:35 on Friday 9th April – when the price spiked to $14,995/MWh … a very similar price to what we saw this afternoon!
* Although, it should be noted that it would be much better if the AEMO also published ‘next day’ (as their documentation says is the policy) the P5 predispatch data for AvailGen and Targets for individual DUIDs. Instead we have to wait a longer period (currently) for the AEMO to publish this data on more of a batch basis. The start of 5MS later this year will make this data gap even more significant.
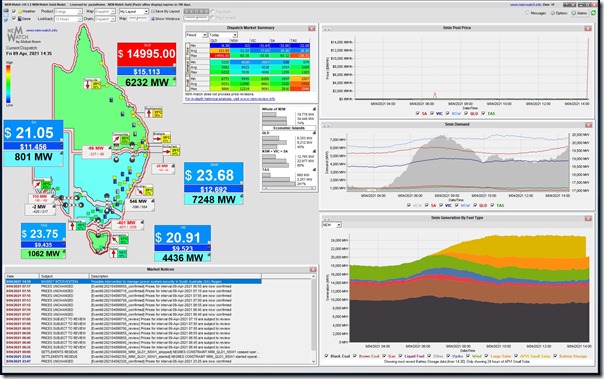
Here’s a snapshot of the price as automatically captured from one of the display copies of NEMwatch v10 entry-level dashboard we have running in our office:
(A) Looking backwards at Friday 9th April 2021
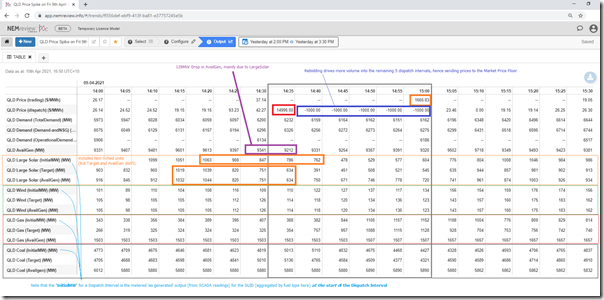
Using this trend query compiled in NEMreview v7 we’ve extracted this tabular view of some of the key data from the QLD region:
As we also saw in today’s price spikes, one of the significant factors contributing to the price spike was the sharp drop in capability (and hence output) of Large Solar plants across the QLD region.
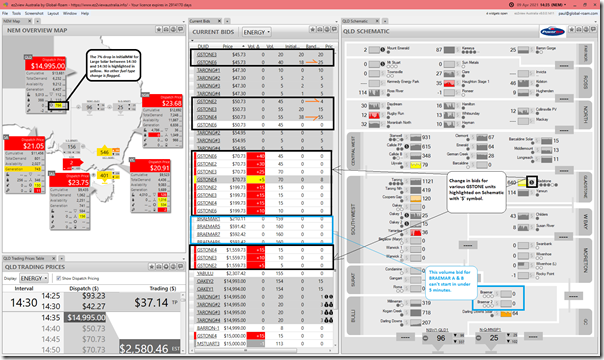
Pulling together a few widgets in ez2view we can see more details:
In particular
1) Thankfully, the reconfigured ‘NEM Map’ widget (from v8.0.0.1411 including aggregate generation by fuel type for each region) makes the drop in Large Solar production relatively easy to spot, even in real time.
2) Remembering that the ‘Current Bids’ widget scrolls well off the snapshot taken, and is filtered just for QLD units, we see that there was really not much ‘spare’ capacity able to be dispatched at short notice with the sudden (and unexpected) loss in solar production. This helps us understand why the price spiked so high unexpectedly.
3) Also worth noting that there was pricing volatility in FCAS pricing as well (initially R60 to $14,912.07/MWh – which was also the case in today’s spikes as well).
(B) Broader implications
In the Generator Report Card 2018, which we released 23 months ago now, we wrote about how ‘the NEM is becoming increasingly dependent on the weather’:
This was Theme 6 within Part 2 of the 180-page analytical component within the 530-page GRC2018.
What we saw (both yesterday and today) seems to be a timely reminder about the challenges we’ll need to work through collectively as the energy transition progresses.
————-
Stay tuned to learn more about the steps we are taking to update this very well received inaugural collaboration between our team at Global-Roam and Jonathon Dyson’s team at Greenview Strategic Consulting!


Leave a comment