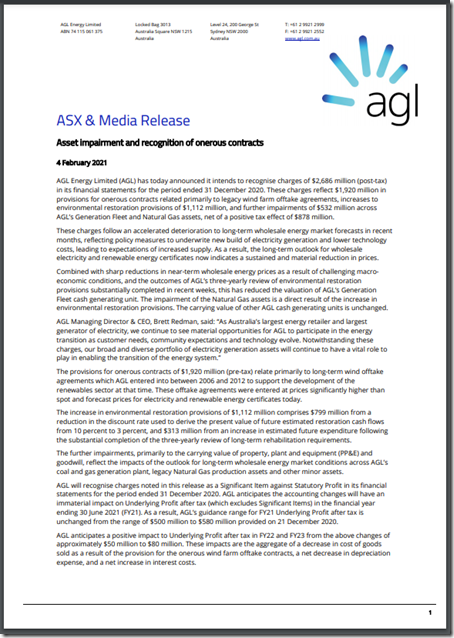
This morning we see that AGL Energy has released the following ASX & Media Release that contains some large numbers:
The impairment of $2,686,000,000 is broken down into four categories:
Line Item #1) $1,920,000,000 in provisions for ‘onerous contracts related primarily to legacy wind farm offtake agreements’
… with it later noted that:
‘The provisions for onerous contracts of $1,920 million (pre-tax) relate primarily to long-term wind offtake agreements which AGL entered into between 2006 and 2012 to support the development of the renewables sector at that time. These offtake agreements were entered at prices significantly higher than spot and forecast prices for electricity and renewable energy certificates today. ’
Line Item #2) increases to environmental restoration provisions of $1,112,000,000
Line Item #3) further impairments of $532,000,000 across AGL’s Generation Fleet and Natural Gas assets
Line Item #4) somewhat offset by net of a positive tax effect of $878,000,000
I’m posting just this now, primarily as I have a sense that this will be referred back to later in future articles…
(A) Coverage elsewhere
Here’s a quick look at some of the commentary I can find elsewhere … in a list that will be updated as time permits:
(A1) On Mainstream Media
In the AFR I’ve spotted ‘AGL blows $1.9b on wind’ and ‘AGL Energy hit by $2.69b of write-downs’ – and related to what follows below ‘Origin warns on energy markets profits’ and ‘NSW-SA cable project in doubt as rule change rejected’ in a busy morning at the news desk.
In the Australian, ‘AGL warns of $2.7b writedown’, and ‘Origin downgrades guidance, AGL takes giant writedown’, and ‘AGL’s Brett Redman will need courage to fix its mess’
In RenewEconomy ‘AGL in massive $2.7 billion writedown, Origin also hit by lower power prices’ and ‘How AGL lost nearly $2 billion from its early push into wind farms’ – and related to what follows below ‘Transmission projects in doubt after AEMC rejects financing rule change’.
For the In Queensland website, Sean Parnell and John McCarthy wrote about ‘Energy cash cows running dry as green deals leave $2 billion hole in AGL profits’, tying in looming pain for the QLD Government-owned generators (Stanwell, CS Energy and CleanCo) … or perhaps more directly the QLD State Budget, which is relying on dividends from these.
In SMH and the Age, Emma Koehn writes how ‘‘Sustained’ reduction in energy prices prompts $2.7b writedown at AGL’ here.
In PV Magazine, David Carroll writes how ‘Wind farm contracts prove costly for AGL’.
Elsewhere?
(A2) On Social Media
The following links to discussions on social media might help some readers:
(a) On LinkedIn this morning I posted this comment.
(b) On Twitter this morning I also posted this comment … and also noted threads by Gavin Dufty and Simon Holmes a Court and Oscar Archer and Tennant Reed on 5th Feb, and there will be others…
… and there will no doubt be others here and elsewhere.
(B) Quick, and cursory, exploration
Amongst the thoughts that pop into my hear is the recollection of the chart I’d posted only last Friday showing ‘Average spot prices through 2020 were down at levels not seen for many years’ – so I thought it might be worth sharing them … even though they have not been thoroughly thought through or checked (so reader beware)!
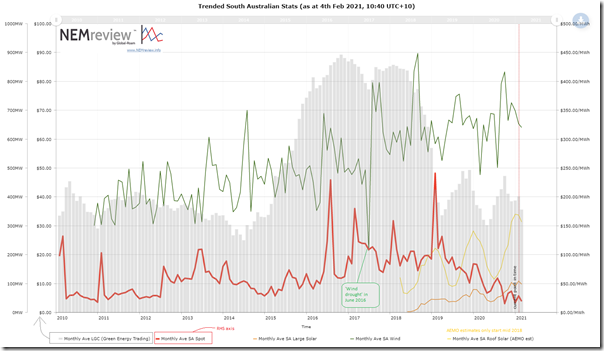
Using this query in NEMreview v7, we can see also that spot LGC prices are well down on the peaks of a couple years ago:
We could perhaps(?) infer from the AGL statement above that the higher prices (around $80-$90 per LGC) were more like the ones baked into the commitments of 10 years ago … or maybe it is because the forecast is LGC prices will continue falling further from the point where they are today?
We’ve noted before on WattClarity how the ‘wind correlation penalty’ has driven returns for wind farms down quite steeply – such as:
1) on 28th July 2020 with ‘Revenues for Wind Farms (and Solar Farms) in the NEM take a hit’ following a Vestas forum – which used VWA Price data from the earlier GSD2019.
2) on 10th September 2020 with ‘Comparing spot revenue performance across wind farms’ in conjunction with the CEC’s Wind Industry Forum webinar series.
One of the reasons why average spot prices have fallen so much (and, in some cases, VWA Prices have fallen further for wind farms) is because of the increased incidence of negative prices that the market has been encountering – with incidence in 2020 a step further up on 2019 and so on (here’s year-on-year Q2 comparison). I wonder about the extent to which the cost impairment at AGL is related to any lack of negative price exclusion clauses in the offtake contracts that AGL notes were entered into between 2006 and 2013?
Thankfully, having just released the Generator Statistical Digest 2020 this week, we’re able to quickly pull out the electronic copy and have a look at how some of the older wind farms have been bidding, and if the pattern has changed as the incidence of negative prices has escalated:
B1) Hallett 1 Wind Farm
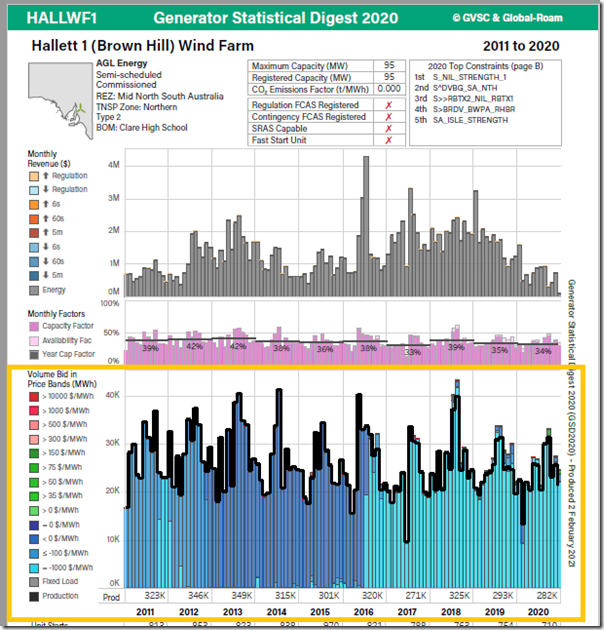
Here’s an excerpt from the ‘A’ Page for Hallett 1 Wind Farm, which is one of the ones we understand that’s associated with AGL Energy. Look at the ‘Volume Bid in Price Bands’ chart, which shows total volume offered in bid price ranges.
The colours are predominantly blue (i.e. at or below $0/MWh), and primarily at the light blue (i.e. down at –$1,000/MWh) colour – and this pattern has been the case for the 10 years shown. There was a change mid-2016 moving the bulk of the volume to –$1,000/MWh which has largely persisted since that time.
There are some (difficult to see) green and red smudges at the top of some bars at recent times – but there is no obvious large* change in bidding behaviour (i.e. when viewed at this macro level) which might be inferred as an effort to avoid the the increasing incidence of negative prices that we have seen in 2020 in South Australia (and in all regions, really).
* note that this is not saying that HALLWF1 has not at all tried to avoid negative prices (I’m pretty sure I have seen discrete dispatch intervals roll through in real time where output was very low when prices were negative) – but moreso that the approach taken has not been as obvious as the case below, at a macro level
B2) Tailem Bend Solar Farm … not an AGL asset
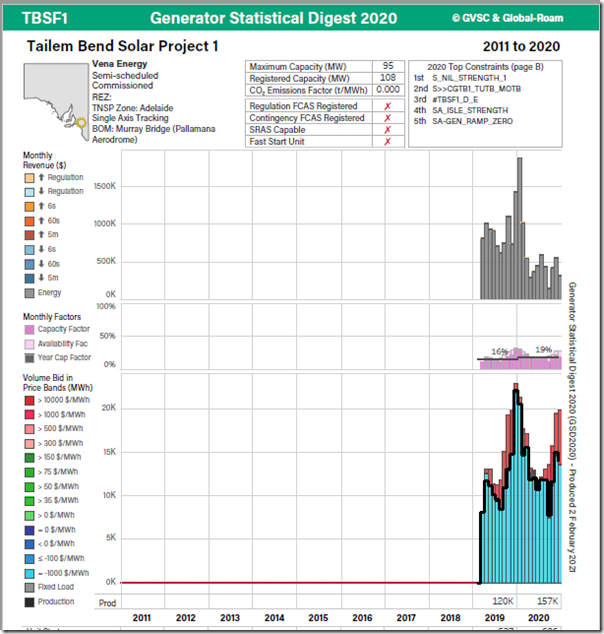
To help clarify for readers what we might be looking for in relation to ‘bidding to avoid negative prices’ I’ve added in here the same excerpt for the Tailem Bend Solar Farm:
Readers should note that this Solar Farm is not associated with AGL Energy … and clearly nor is it one that’s been operating prior to 2019 … and it’s not a wind farm (the focus of the AGL announcement).
Rather, I’ve pulled this up as a clear comparison.
In contrast to HALLWF1 above, we can clearly see a sizeable volume at TBSF1 bid ‘out of the money’ (up in the red bands) in almost all of the months of 2019 and 2020 – which we surmise has been their attempt to avoid all of the negatively priced trading periods.
B3) Comparing the outcomes of the different bidding behaviours (TBSF1 against HALLWF1)
In Monday’s article ‘Using the GSD2020 to explore operating patterns across generation types’, Marcelle gives a pretty clear explanation of how to use the GSD2020 to review the outcome of the bidding behaviour above that should be helping both units avoid negative prices in South Australia.
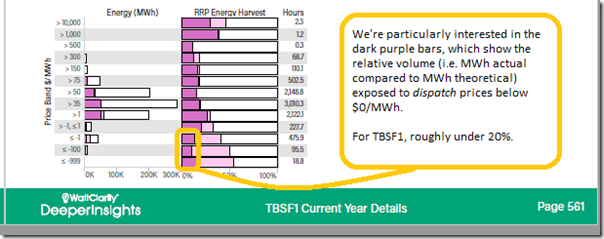
This features the ‘RRP Energy Harvest’ widget on the ‘B’ Pages inside of the GSD2020, which looks at data on a dispatch interval basis (note Marcelle’s comments about how the 5/30 issue affects this). Here is what we see for the ‘price harvest’ for TBSF1:
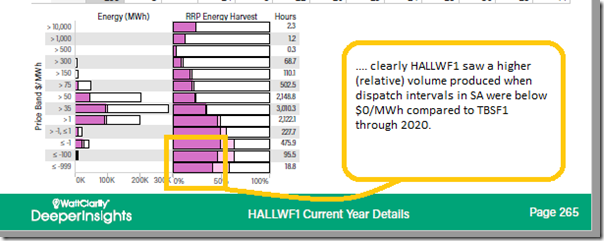
Let’s compare this to HALLWF1 … which shows a higher exposure to negative prices. The dark purple bars show the output in these dispatch price ranges (whereas the light purple show the availability – not so important in this particular question):
So it seems fair to conclude that TBSF1 will have been more effective at avoiding negative trading prices through 2020 compared to HALLWF1.
Perhaps we can conclude that the split/conflicted incentives between AGL Energy (paying the Generator Owner, but getting paid wholesale) and the Generation Owner (getting paid by AGL Energy, and presumably not being exposed to wholesale spot even at negative prices) has ended up producing some expensive outcomes for AGL in this impairment.
(C) Two quick observations
Two big points jump out at me related to this announcement:
Observation #1) The huge size of the impairment today should be a reminder to everyone that the costs of making poor contracting decisions can be quite large … topical, given the spike in interest in (for instance) Energy Users signing up directly with renewable PPAs.
Observation #2) It’s a common refrain (by energy user advocates and others) that ‘customers end up paying for everything’ … especially in relation to market reform deliberations. However…
2a) … this is one case where it is the AGL Energy shareholders that are paying for the (what some might see as ‘poor’, in hindsight) decisions made ~10 years ago in contracting with what appears to be turning out as an incorrect view of the future.
(i) It might be that some of the other long-time retailers will make similar announcements at some point?
(ii) Though painful for shareholders in this instance, this is one reminder of the benefits of a competitive market.
2b) I also noted the coincident AEMC announcement today that they would not allow network companies to drag forward cost recovery on Project Energy Connect. To what extent is this another reminder of:
(i) some key differences between the regulated approach in the (monopoly) network sector and the competitive approach in the generation sector;
(ii) and (perhaps?) some inherent risks that might underlie possible moves to introduce ‘Capacity Markets’ or ‘Ahead Markets’ as part of the ‘NEM 2.0’ market reform process
i.e. where a central body acts as monopoly single buyer of capacity that is not needed till some future point in time – hence where customers might wear (more of?) the risk on two sides:
1. Too much capacity … and customers pay for the contracts
2. Not enough capacity … and customers pay with high spot prices (and possibly lights out)?


The tax refund offsets nearly half of the (projected) PPA losses, so it could be said that taxpayers are somewhat subsidising the wind industry, through AGL.
There could also be some element of bluff from AGL in an attempt to warn off other market entrants, otherwise known as competition. Most people are fully expecting NSW prices to jump when Liddell closes.
Others in the hole with overpriced PPAs include the ACT, VIC and QLD governments and Snowy because of their exposure to renewable PPAs.
Expect the RE lobby to spin this as a government failure somehow.