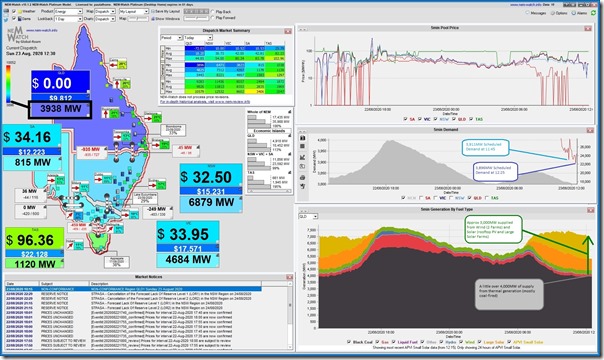
Following on from the NEM-wide record wind article yesterday, here’s another milestone captured in this snapshot from the NEMwatch v10 entry-level dashboard at 12:30 today:
We see in the deep blue colour shown in the demand for the Queensland region (3,938MW in the 12:30 dispatch interval) that it’s right down the bottom of the historical range used to colour this data series. Annotated on the image, are two lower points:
1) At 11:45 the dispatch Scheduled Demand was 3,911MW
2) At 12:25 the dispatch Scheduled Demand had fallen further to 3,896MW.
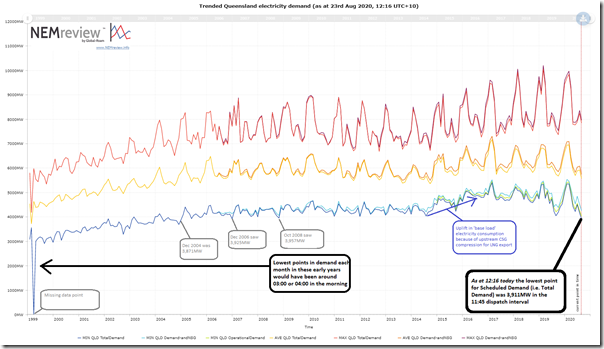
Obviously talk about ‘all time minimum’ is a bit artificial in relation to electricity consumption, as we could always go back to the time when Banjo Patterson rode his horse and cart to find a point where electricity consumption was zero. So I checked quickly using this trend query from NEMreview v7 in order to see how long it had been since the Scheduled Demand* was as low as this:
* note that AEMO is increasingly talking about ‘Operational Demand’ (which might be described as ‘Grid Demand’ or ‘Demand the AEMO can easily see’) to talk about demand records these days – but ‘Scheduled Demand’ (which might be called ‘Market Demand’) still has its applications, not the least of which that it’s the only measure that existed in the early years of the demand. See here for the detailed explanation about the different ways in which demand is measured and described.
I might have missed some low points in my quick eyeball scan, but it appears to me that the low levels of demand today are lowest seen since late in 2004, which:
1) Is obviously 16 years ago.
2) Furthermore it should be remembered that the low point in demand back at those points in time would:
(a) probably have been occurring in the very early hours of the morning; or
(b) possibly on days like Christmas day if the weather was cool.
.
The Queensland ‘duck’ (as in ‘duck curve’) is getting hungry…
PS1 later on Sunday 23rd Aug:
We see that the Scheduled Demand dropped a little lower – down to 3,889MW in the 13:15 dispatch interval on Sunday 23rd August.


Leave a comment