On Saturday I posted this 12th Case Study in a series looking at a single dispatch interval on 28th September 2018 (one of only 5 cases of large* collective over-performance in the 7-year period to the end of 2019.
* with ‘large’ collective over-performance being measured as Aggregate Raw Off-Target across all Semi-Scheduled units being below –300MW.
Today we’re publishing this 13th Case Study of the series, looking at one of the 93 instances of collective under-performance seen in the same period.
(A) Background context
Remember that we identified a total of 98 discrete instances where aggregate Raw Off-Target across all Semi-Scheduled units was either above +300MW (representing collective under-performance) or, much less commonly, under –300MW (representing collective over-performance relative to AEMO’s expectations, seen in the Dispatch Target).
There was a smattering of only 10 cases through 2013, 2014, 2015, 2016, 2017 and through until August 2018. However thereafter (to the end of 2019) there was a sharp escalation of extreme incidents – as seen in the following chart: 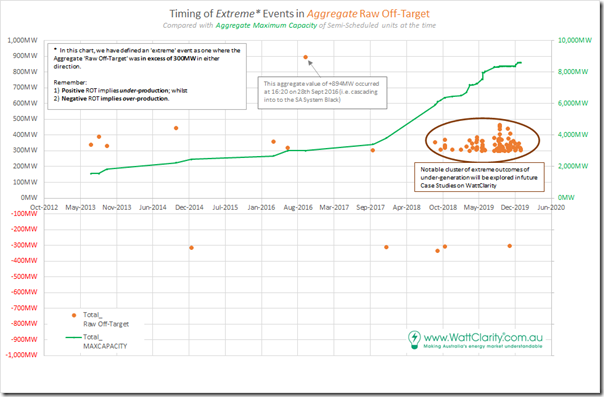
Note also that we have not yet looked into 2020 data, which will be the focus of the GSD2020 (so we can’t comment on whether the trend from 2019 has continued to grow).
We’re doing this given a push from the AER Issues Paper, but moreso inspired by the deliberations by the (now defunct) COAG Energy Council and (under threat?) ESB relating to ‘NEM 2.0’. Note that these case studies deal with imbalance in the Dispatch Interval timeframe, but readers should understand that there are other challenges that ‘NEM 2.0’ also needs to resolve, including:
Other Challenge #1) Within the dispatch interval timeframe, energy-related services focused on frequency maintenance and response to contingencies;
Other Challenge #2) Relating to ‘firmness’ of supply in the broader forecast horizon; and
Other Challenge #3) Others that we bundled into a ‘keeping the lights on’ services in our discussions in the Generator Report Card 2018 (for instance, in relation to System Strength).
In preparing these focused Case Studies, we’re seeking to understand why and what the implications are of this escalation. … so let’s look at this particular event:
(B) Summary results for Friday 28th September 2018
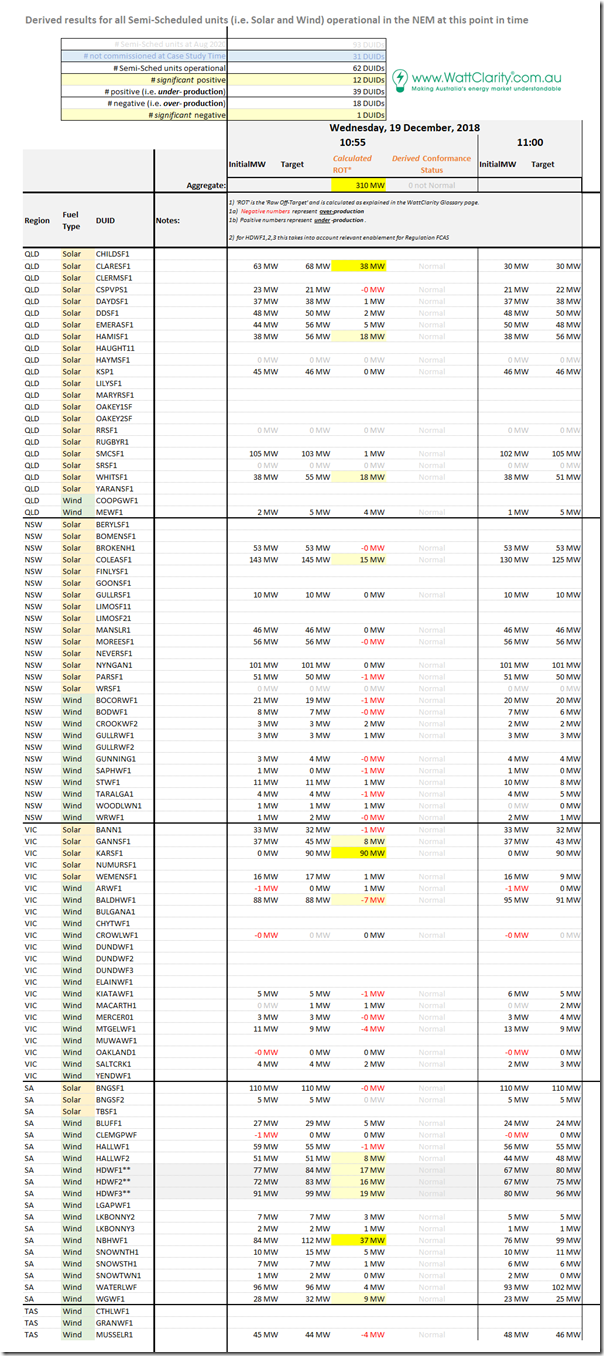
Here’s the same tabular framework of results for individual Raw Off-Target performance of all 62 x Semi-Scheduled units that were operational at the time.
Note that this is 5 more units then were registered for 29th September 2018 (under 3 months beforehand). We’ve reached the period where the growth in installed capacity climbed rapidly, coincident with the rise in extreme cases of aggregate Raw Off-Target (as we’re working through these case studies, we’re striving to understand the linkages):
In summary from this table, we can see the following:
1) Of the 62 DUIDs registered at the time, there are more than double the number under-performing (39DUIDs) as there are over-performing (18 DUIDs).
2) Of the units highlighted as having Raw Off-Target greater than 6MW (a threshold that is one of the inputs in determining Conformance Status for a unit), we see the split is even more unbalanced:
(a) 12 DUIDs flagged as under-performing by at least 6MW (with 3 of these under-performing by more than 30MW); whilst
(b) Only 1 DUID flagged as over-performing by at least 6MW.
3) Furthermore, we see that this is probably the first of the Case Studies where large discrepancies of solar farms play a significant role.
(C) Results for individual DUIDs
Once again we use the ‘Unit Dashboard’ widget in ez2view (and the ‘Time Travel’ powerful rewind functionality) to review what some of the core stats were for this point in time for each of the units flagged as having significant Raw Off-Target:
(C1) Three DUIDs showing major under-performance
We’ll start with the three DUIDs that show Raw Off-Target of greater than 30MW, a quite significant deviation for an individual unit:
(C1a) Clare Solar Farm (38MW under-performance) ‘went the wrong way’ in QLD Region
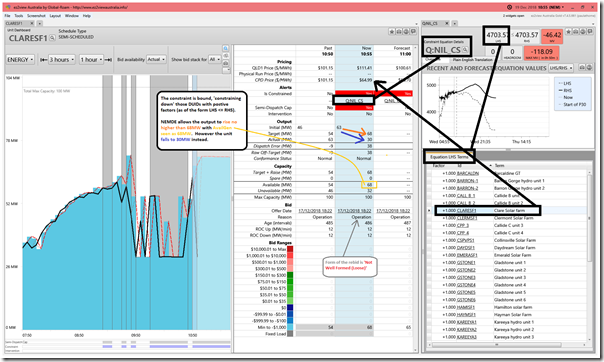
Here’s what the view for CLARESF1 looked like:
We see in this case that the unit is subject to the bound transmission constraint ‘Q:NIL_CS’ along with many other units in central and northern Queensland. This constraint is, in AEMO’s words about:
‘CQ-SQ transient stability limit (upper limit of 2100MW)’
… and is one illustration of the types of concerns I flagged here a month earlier.
1) Because of the effect of the constraint, the Connection Point Dispatch Price (i.e. CPD Price) for the unit drops below the Dispatch Price for the region – however CLARESF1 is well below that, with its bid down at –$1,000/MWh;
2) We see that ASEFS produces an Available Generation forecast of 68MW for this Dispatch Interval (we’ll come back to this below);
3) Because of how this unit bid the NEMDE process gives CLARESF1 a dispatch target of 68MW, which happens to be an increase (which might seem strange, given the constraint is now bound);
4) However we see that the unit reduces output instead (from 63MW down to 30MW) … so this is another example of a unit ‘going the wrong way’.
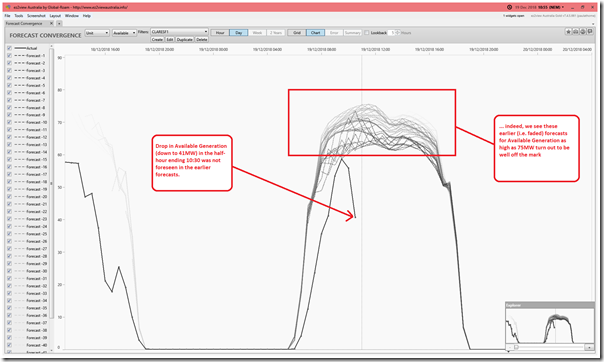
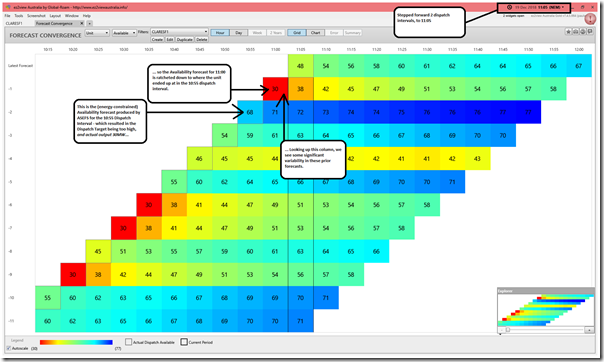
Opening up the ‘Forecast Convergence’ widget in ez2view to look at successive forecasts for (energy-constrained) Available Generation for the plant in the P30 predispatch forecasts, we see that the drop in capability (down to 41MW for 10:30) had not been forecast in the prior runs – and indeed that the plant had been under-performing the whole day compared with earlier forecasts:
Flipping to ‘Grid’ Mode and looking at the P5 predispatch forecasts (my understanding is that they use a different ASEFS process), I’ve also stepped the following snapshot forward 2 dispatch intervals (to 11:05) in order to see what unfolded afterwards;
We see significant variability in the forecasted (energy-constrained) Available Generation for the plant, suggesting intermittent cloud cover impacts or some other cause…
—-
Out of interest on the ‘Unit Dashboard’ image above, I’ve also highlighted that, in this case, the form of the rebid reason (which just says ‘Operation’) would be flagged as ‘Not Well Formed’ even with a looser parsing of the rebid reasons with respect to the AER’s Rebidding Guidelines that applied at the time. This is something we did for all rebids through 2019 in the ‘B’ Pages of the Generator Statistical Digest 2019, for instance.
(C1b) Karadoc Solar Farm (90MW under-performance) ‘failed to start’ in VIC Region
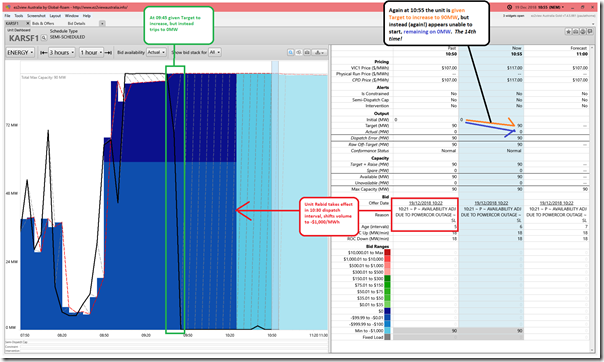
The situation here for KARSF1 is different, in that the unit (since it apparently tripped at 09:45) has been unable to get started in the 14 x dispatch intervals since that time:
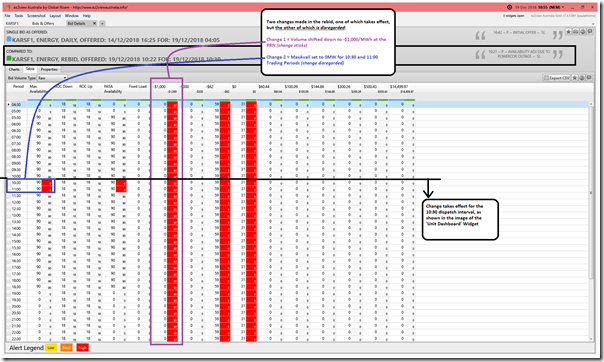
I notice the rebid, which took effect at 10:30 citing an adjustment in availability due to Powercor outage (i.e. the network they are connected to) and wonder why their Available Generation in is stuck at
Incidentally, I also see that the form of their rebid reason would be flagged as ‘Well Formed’ with a loose parsing of the rebid reasons with respect to the AER’s Rebidding Guidelines. So I’m guessing that:
1) the operator who submitted the rebid at the time had some background with Scheduled plant previously (so knew what the AER Guidelines were); but
2) did not know of the quirk in ASEFS (and AWEFS) that means that any changes to MaxAvail in the bid are just disregarded by NEMDE for Semi-Scheduled plant, which instead takes the (energy-constrained) availability from ASEFS (or AWEFS).
Can someone see an alternate explanation of what happened here? If so, please let me know – directly, or in a comment below.
(C1c) Hallett 4 ‘North Brown Hill’ Wind Farm (37MW under-performance) ‘went the wrong way’ in SA Region
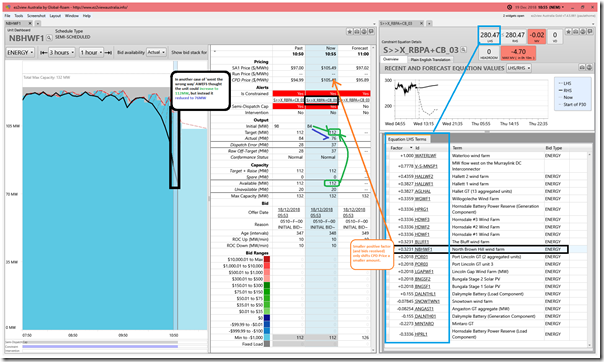
Third unit to show major under-performance was NBHWF1 in South Australia:
This is another case of ‘went the wrong way’. Given that this is the case, we’re learning that the first thing to do is to see what AEMO’s P30 predispatch forecast was showing in terms of the forecasts for (energy constrained) Available Generation capacity for the plant:
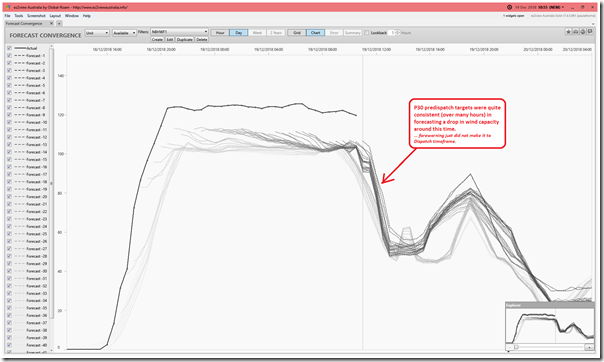
It’s clear that the P30 predispatch forecasts were quite persistent in forecasting a drop in output capability around, or slightly after, this time. We’ve seen this before in earlier case studies, and noted then that this can sometimes happen because of:
Reason 1) the disconnect between P30 methodology and the Dispatch process; and also
Reason 2) the fundamental difficulty in pinning down a precise time for a sudden drop in wind conditions.
(C2) 9 x other DUIDs under-performing, and 1 x DUID over-performing
For completeness here are the other 9 units which have been highlighted – listed from top to bottom in the table. Keep in mind that some here have deviations which (whilst not flagged as larger than 30MW) are close to 20MW and so still significant:
(C2a) Hamilton Solar Farm (18MW under-performance) in QLD Region
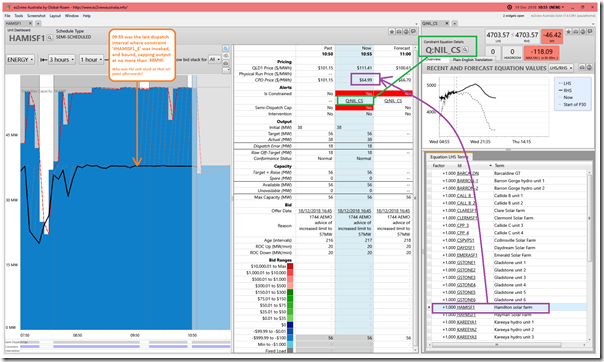
We see clearly here that the output of the plant had been stuck at 38MW for a couple hours, and yet NEMDE in dispatch continued to insist that it had the capability to increase up to 56MW:
The 10:55 dispatch interval was the 12th in a row where we saw a similar thing.
Prior to that time, the ‘#HAMISF1_E’ Constraint Equation had been bound, limiting the output of the plant to no more than 38MW. The 09:55 dispatch interval was the last one that this had been present for, but prior to that almost 10 days from the 10th December.
Was there some element of AEMO’s dispatch signal that was ‘lost in transmission’ at HAMISF1 that meant it missed the opportunity to increase its output over that hour-long period (missed revenue approximately $1,800 over that period)?
PS1 on Mon 31st Aug 2020:
A reader at Edify Energy clarified for me back on 17th August that ‘The off target is because of testing and [EPC contractor] were capping the plant at the PPC which was not being reflected in the SCADA and hence forecast in NEMDE.’
Apologies that it’s taken me a couple weeks to add this back in here.
.
(C2b) Whitsunday Solar Farm (18MW under-performance) in QLD Region
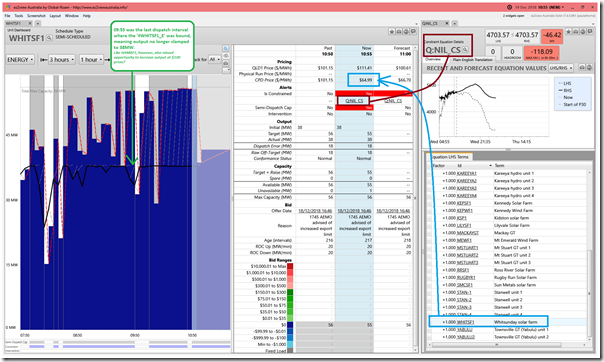
Interestingly here, we see that WHITSF1 (also in the Edify portfolio) is an almost identical carbon copy of the problem at HAMISF1:
In this case there were also 12 dispatch intervals where the unit missed the opportunity increase in output at healthy prices around $100/MWh.
Because they are so similar, I wonder if there is not some systems issue within the portfolio that led to this?
PS2 on Mon 31st Aug 2020:
See note above for Hamilton SF.
.
(C2c) Coleambally Solar Farm (15MW under-performance) in NSW Region
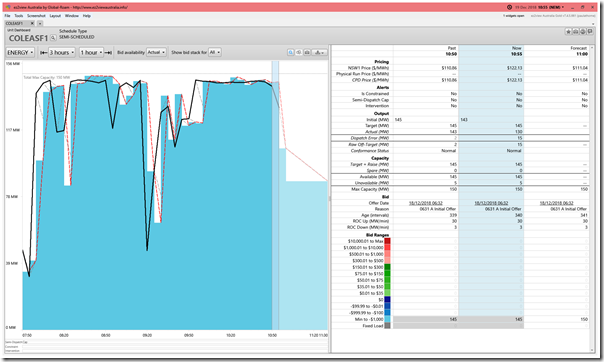
The COLEASF1 looks like a smaller case of ‘went the wrong direction’:
Without looking further, I suspect some cloud cover issue.
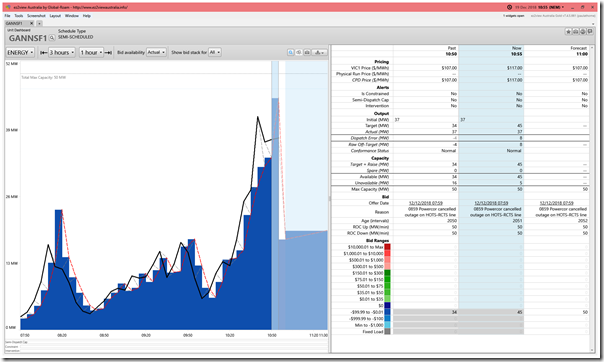
(C2d) Gannawarra Solar Farm (8MW under-performance) in VIC Region
The GANNSF1 is a smaller unit, only 50MW, so the difference looks larger on the chart here than it is in absolute terms:
Output has been climbing quite quickly, with ASEFS having some understandable challenges in staying 100% in synch with this.
—-
Also worth noting that the rebid shown here from 12th December would be flagged as ‘Not Well Formed’ even with a looser parsing of the rebid reasons with respect to the AER’s Rebidding Guidelines that applied at the time. This is because of the absence of the rebid reason.
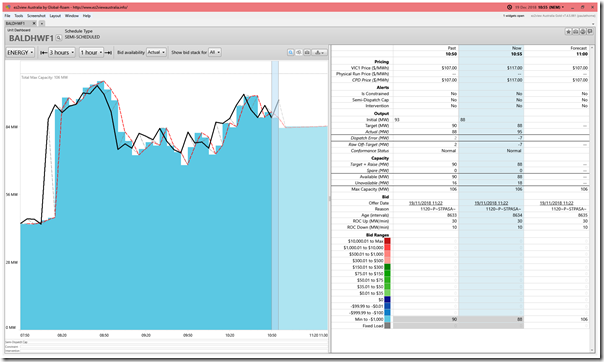
(C2e) Bald Hills Wind Farm (7MW over-performance) in VIC Region
BALDHWF1 was the only unit (of 13 in total) flagged as significant over-performance, but only at 7MW:
Not much needs explaining here.
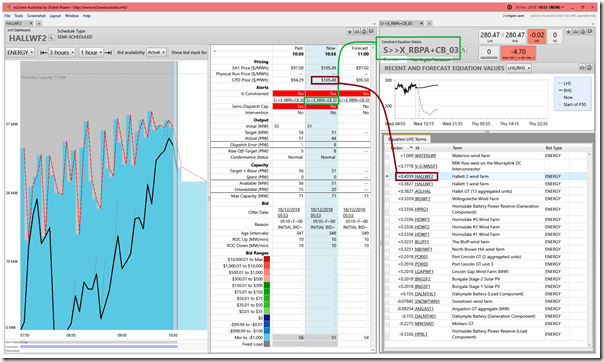
(C2f) Hallett 2 Wind Farm (8MW under-performance) in SA Region
Into South Australia with the HALLWF2 unit:
We see that the ‘S>>X_RBPA+CB_03’ Constraint Equation was bound, which is a result of outage on:
‘Robertstown-Para 275kV line and Robertstown CB6574 and CB6575’
This is seeking to cap collective contributions from a number of units – but affecting WATERLWF the most.
1) It does not have much effect on the dispatch target given to HALLWF2.
2) Rather, it just looks like NEMDE does not exactly pick a reduction in wind speed onsite.
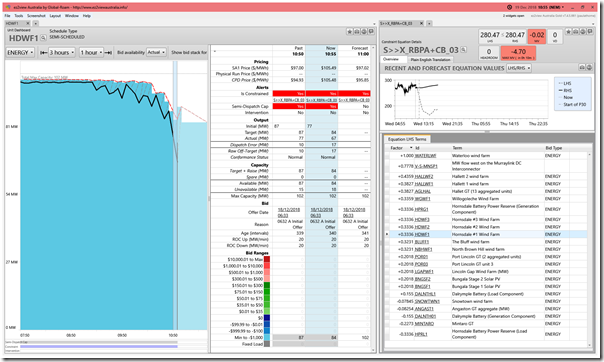
(C2g) Hornsdale 1 Wind Farm (17MW under-performance) in SA Region
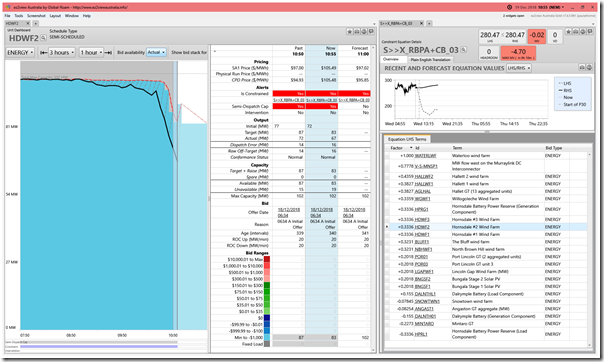
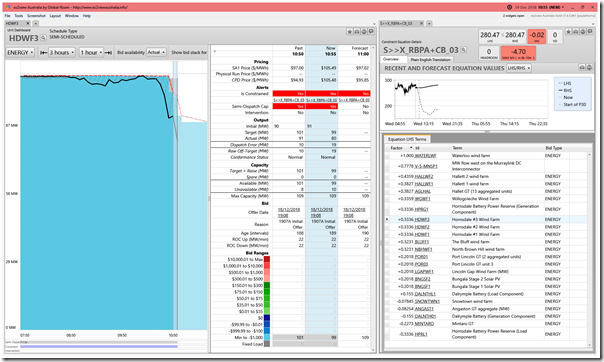
Collectively, there’s a 52MW under-performance across all three units (HDWF1 + HDWF2 + HDWF3) – these views suggest that NEMDE did not keep pace with the drop in wind speed:
We can also noted from these charts that this drop is not totally out of the blue (i.e. a drop in Available Generation is shown for the 11:30 trading period in all cases.
(C2h) Willogoleche Wind Farm (9MW under-performance) in SA Region
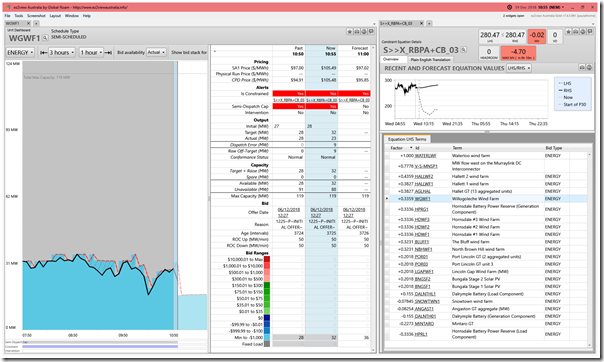
The WGWF1 unit seems just a smaller version of the same above:
—————
That’s all I have time for in this Case Study.


Leave a comment