
This article was originally posted on LinkedIn, where there are other comments.
With the resurgence of COVID-19 cases in Australia, we’re seeing a lot of interest in what this means for power demand. This article walks through the effects we’re seeing for the overall NEM, as well as state level.
NEM Total
First, we’ll have a look at actual operational power demand for the entire NEM. The first graph shows the daily average demand from March to date while the second shows the daily peaks. This year’s demand is plotted alongside last year’s demand.
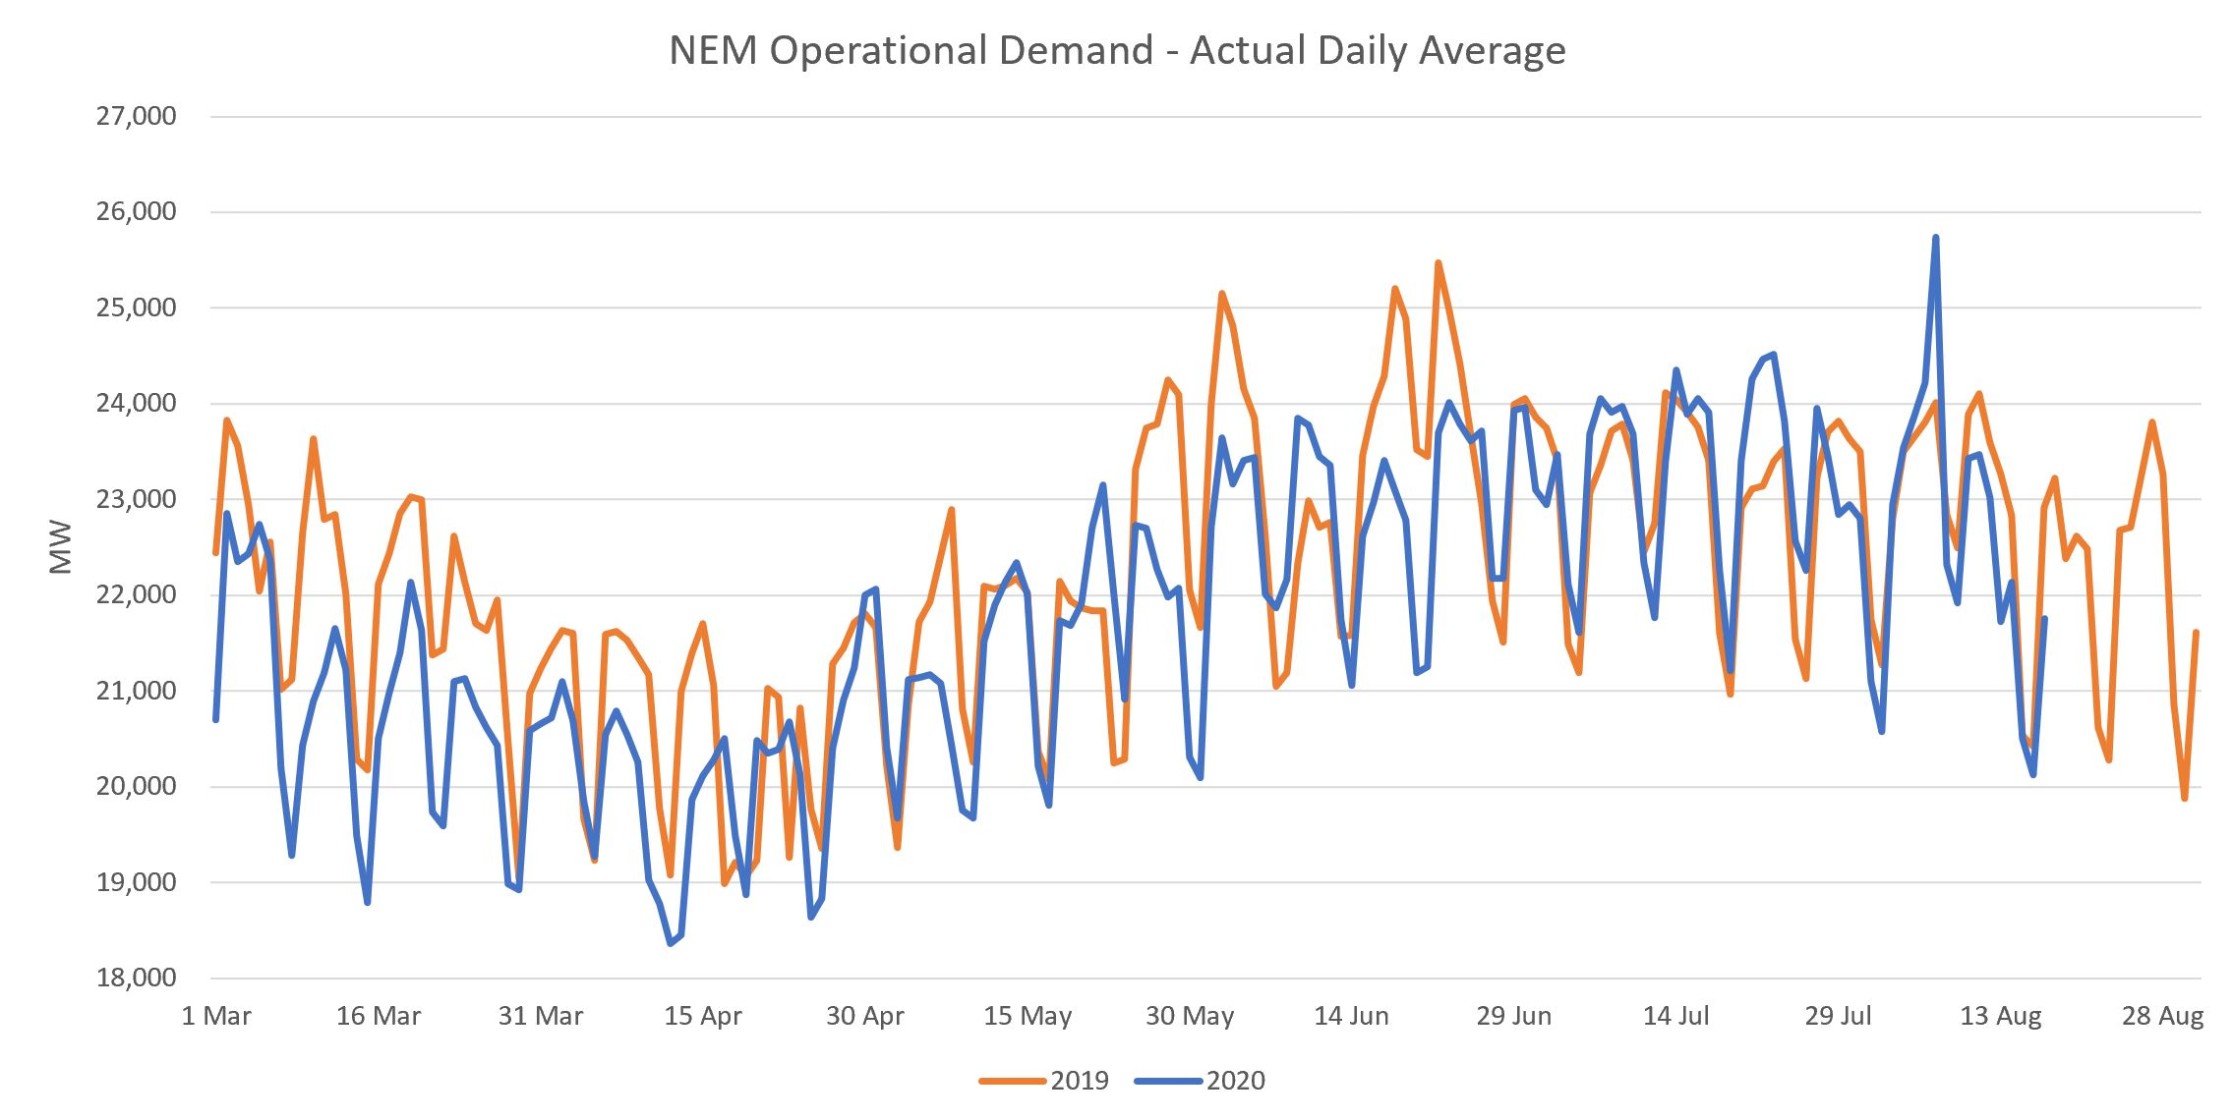
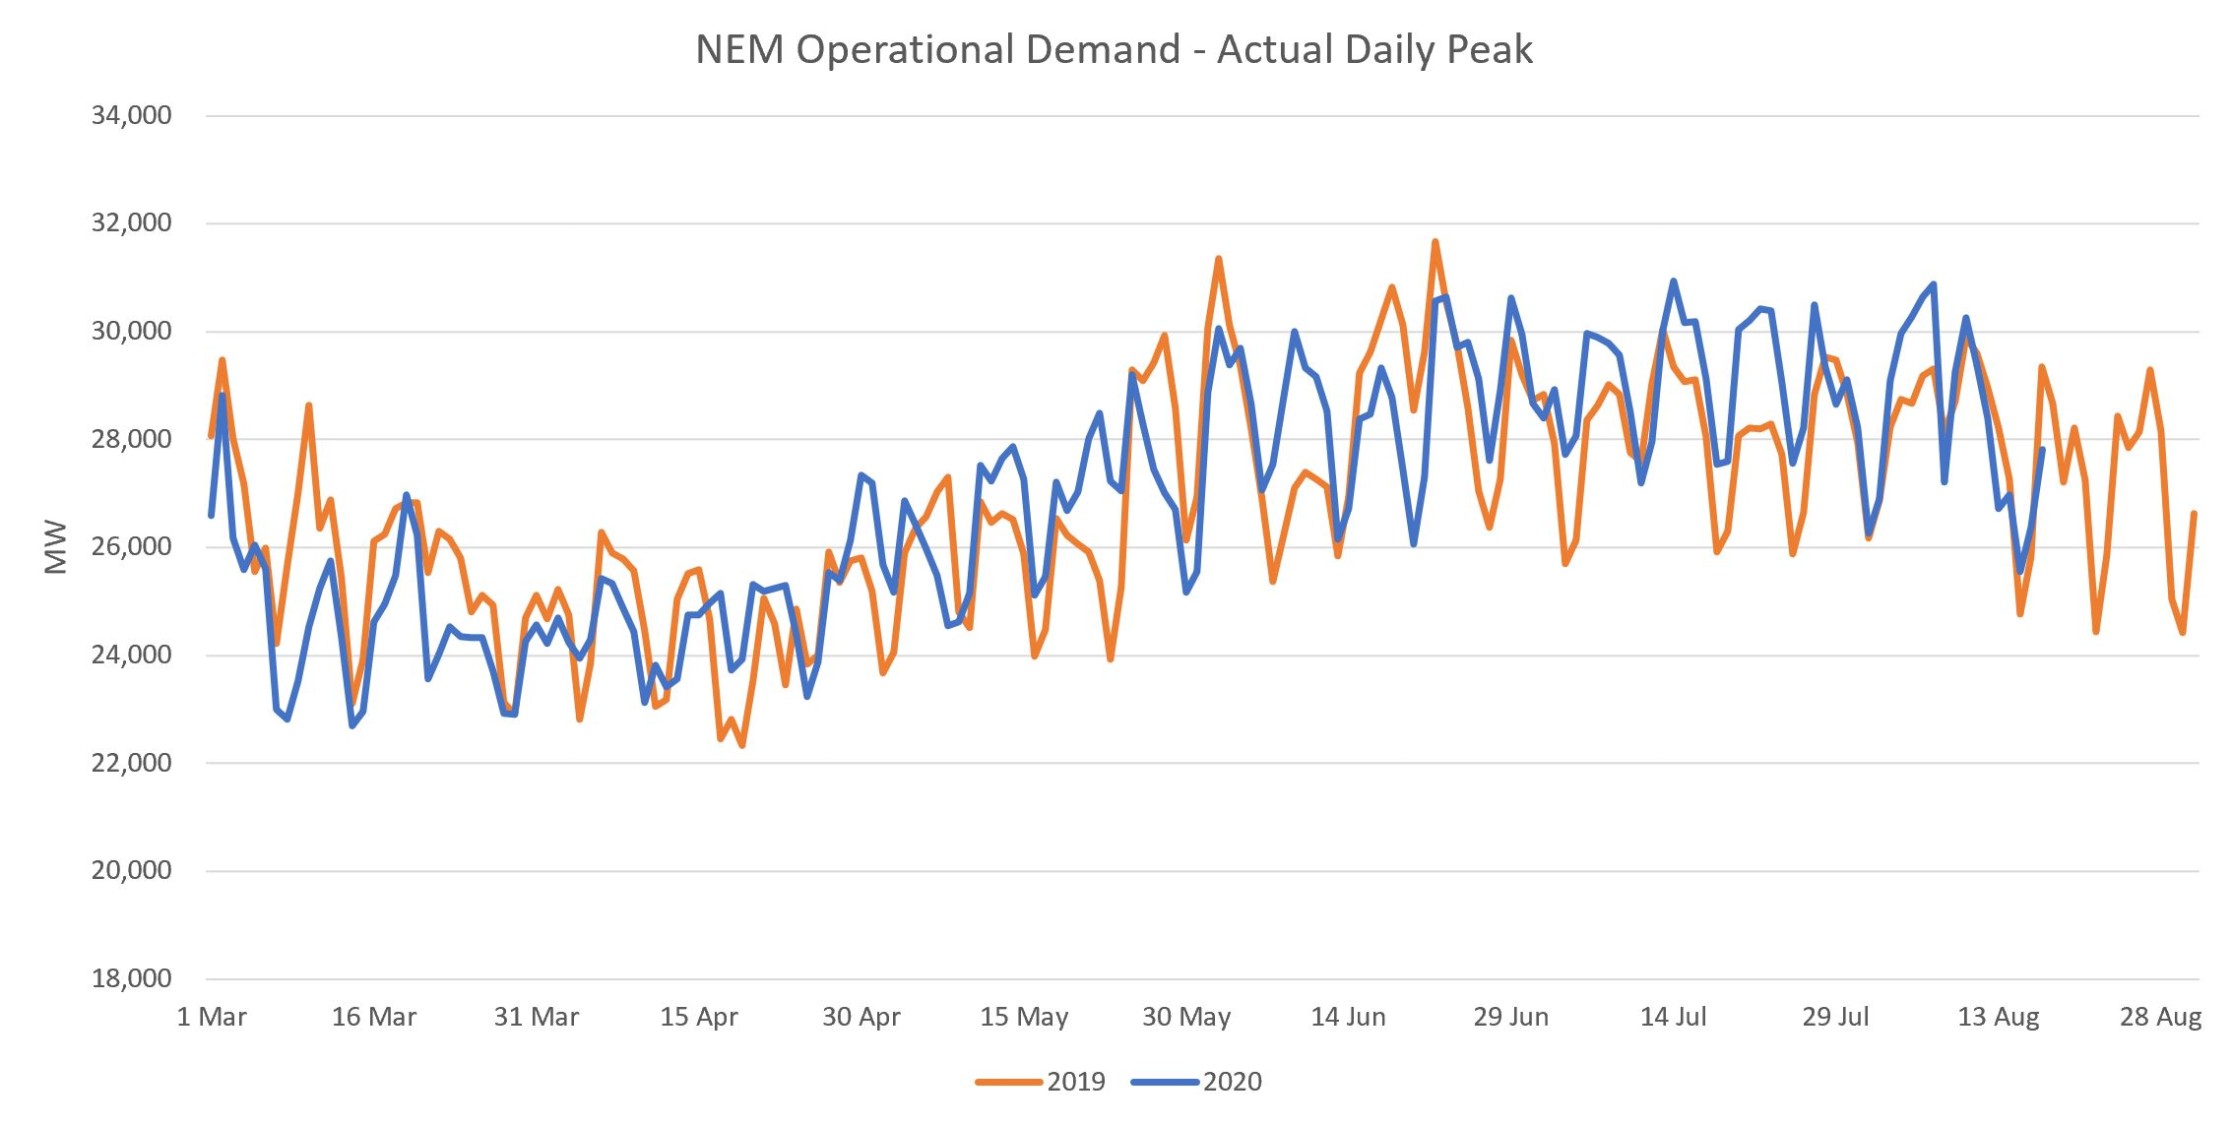
With Australian power demand being so weather sensitive, it’s difficult to draw any meaningful conclusions from the above two graphs. In order to quantify the effect of COVID-19 on power demand we must first normalize the series to remove any day-to-day weather fluctuations. Using TESLA’s methodology for Weather Adjusted Load, we’ve done just that for the above two graphs:
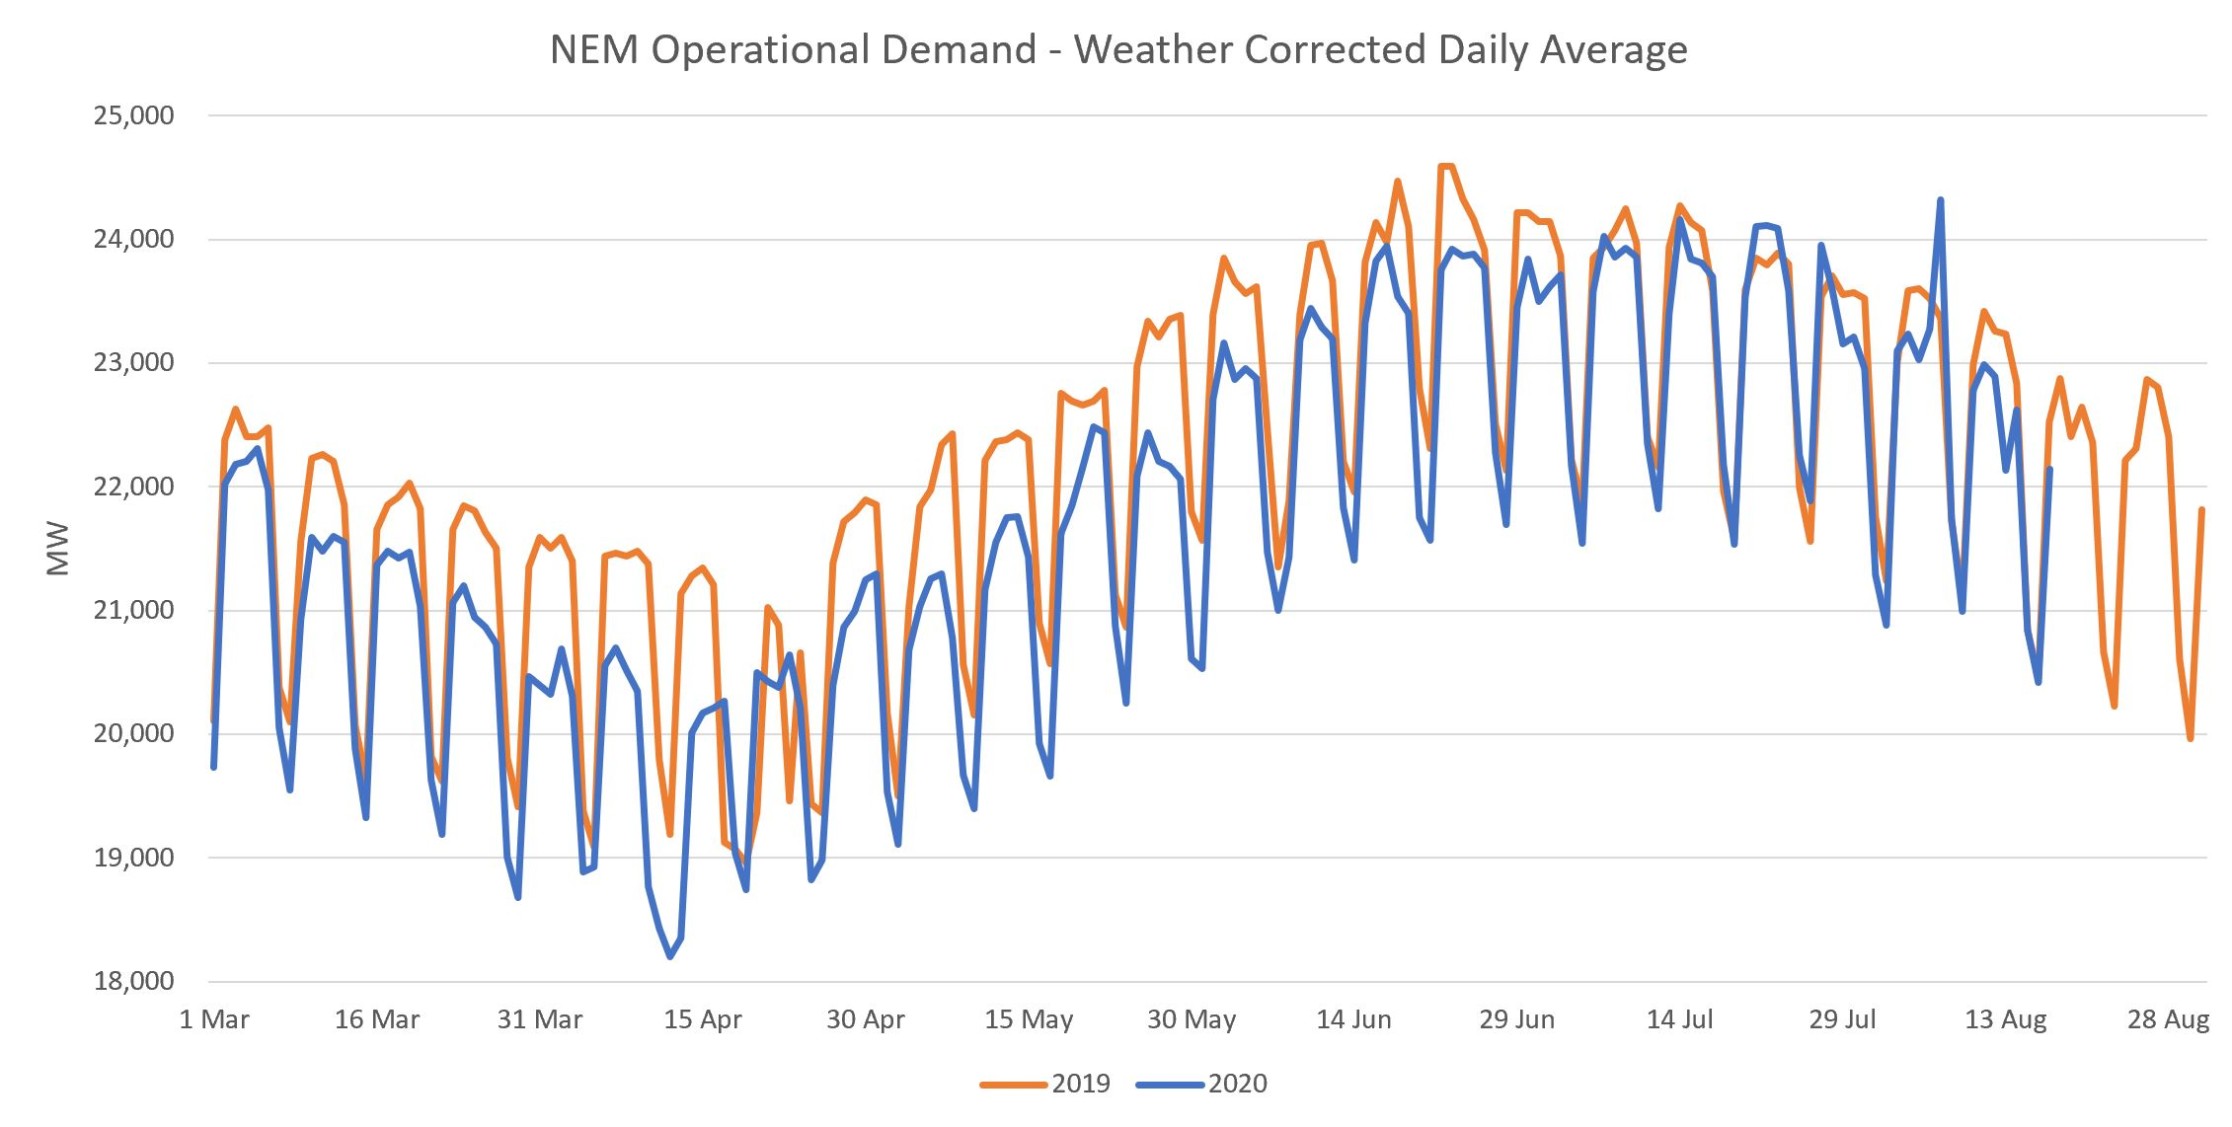
A visual inspection shows that daily average demand sharply lower in March – May this year compared to last. Demand seemed to have recovered near the end of July, then began falling again through August, matching the resurgence of new infections.
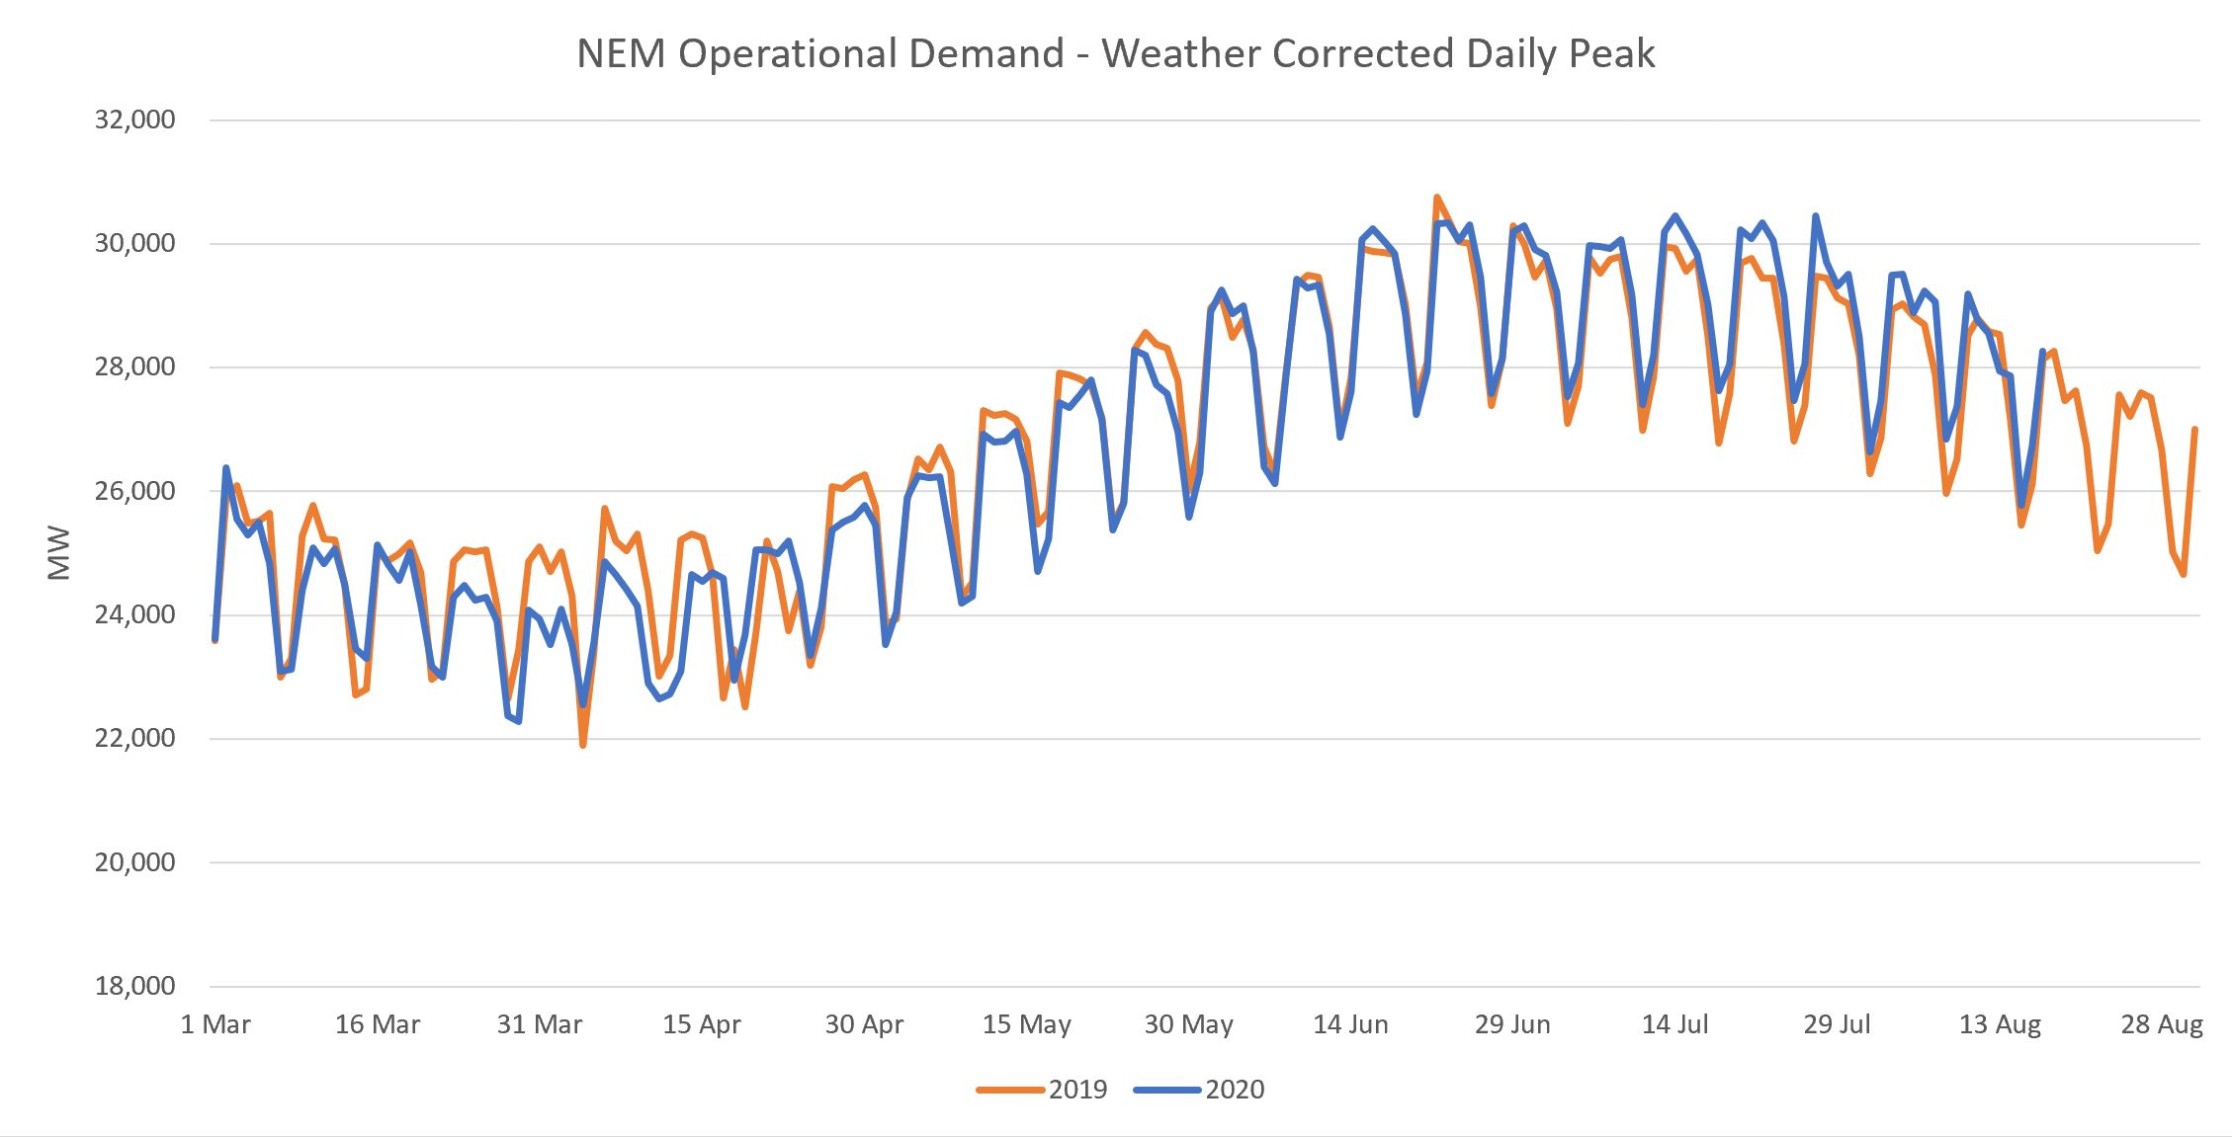
But unfortunately it’s not that simple. Operational Demand contains an ever-increasing amount of behind-the-meter rooftop PV that acts as negative demand. With more embedded PV installations this year, weather adjusted demand was already lower before COVID made its way to Australia. Considering this, it’s useful to also analyze Daily Peaks, which may be less affected by embedded PV. This is more so true in the winter where Australia’s peak demand is typically in the evening around the time of sunset. In the summer we of course have longer days so rooftop PV can contribute more to the evening peak demand.
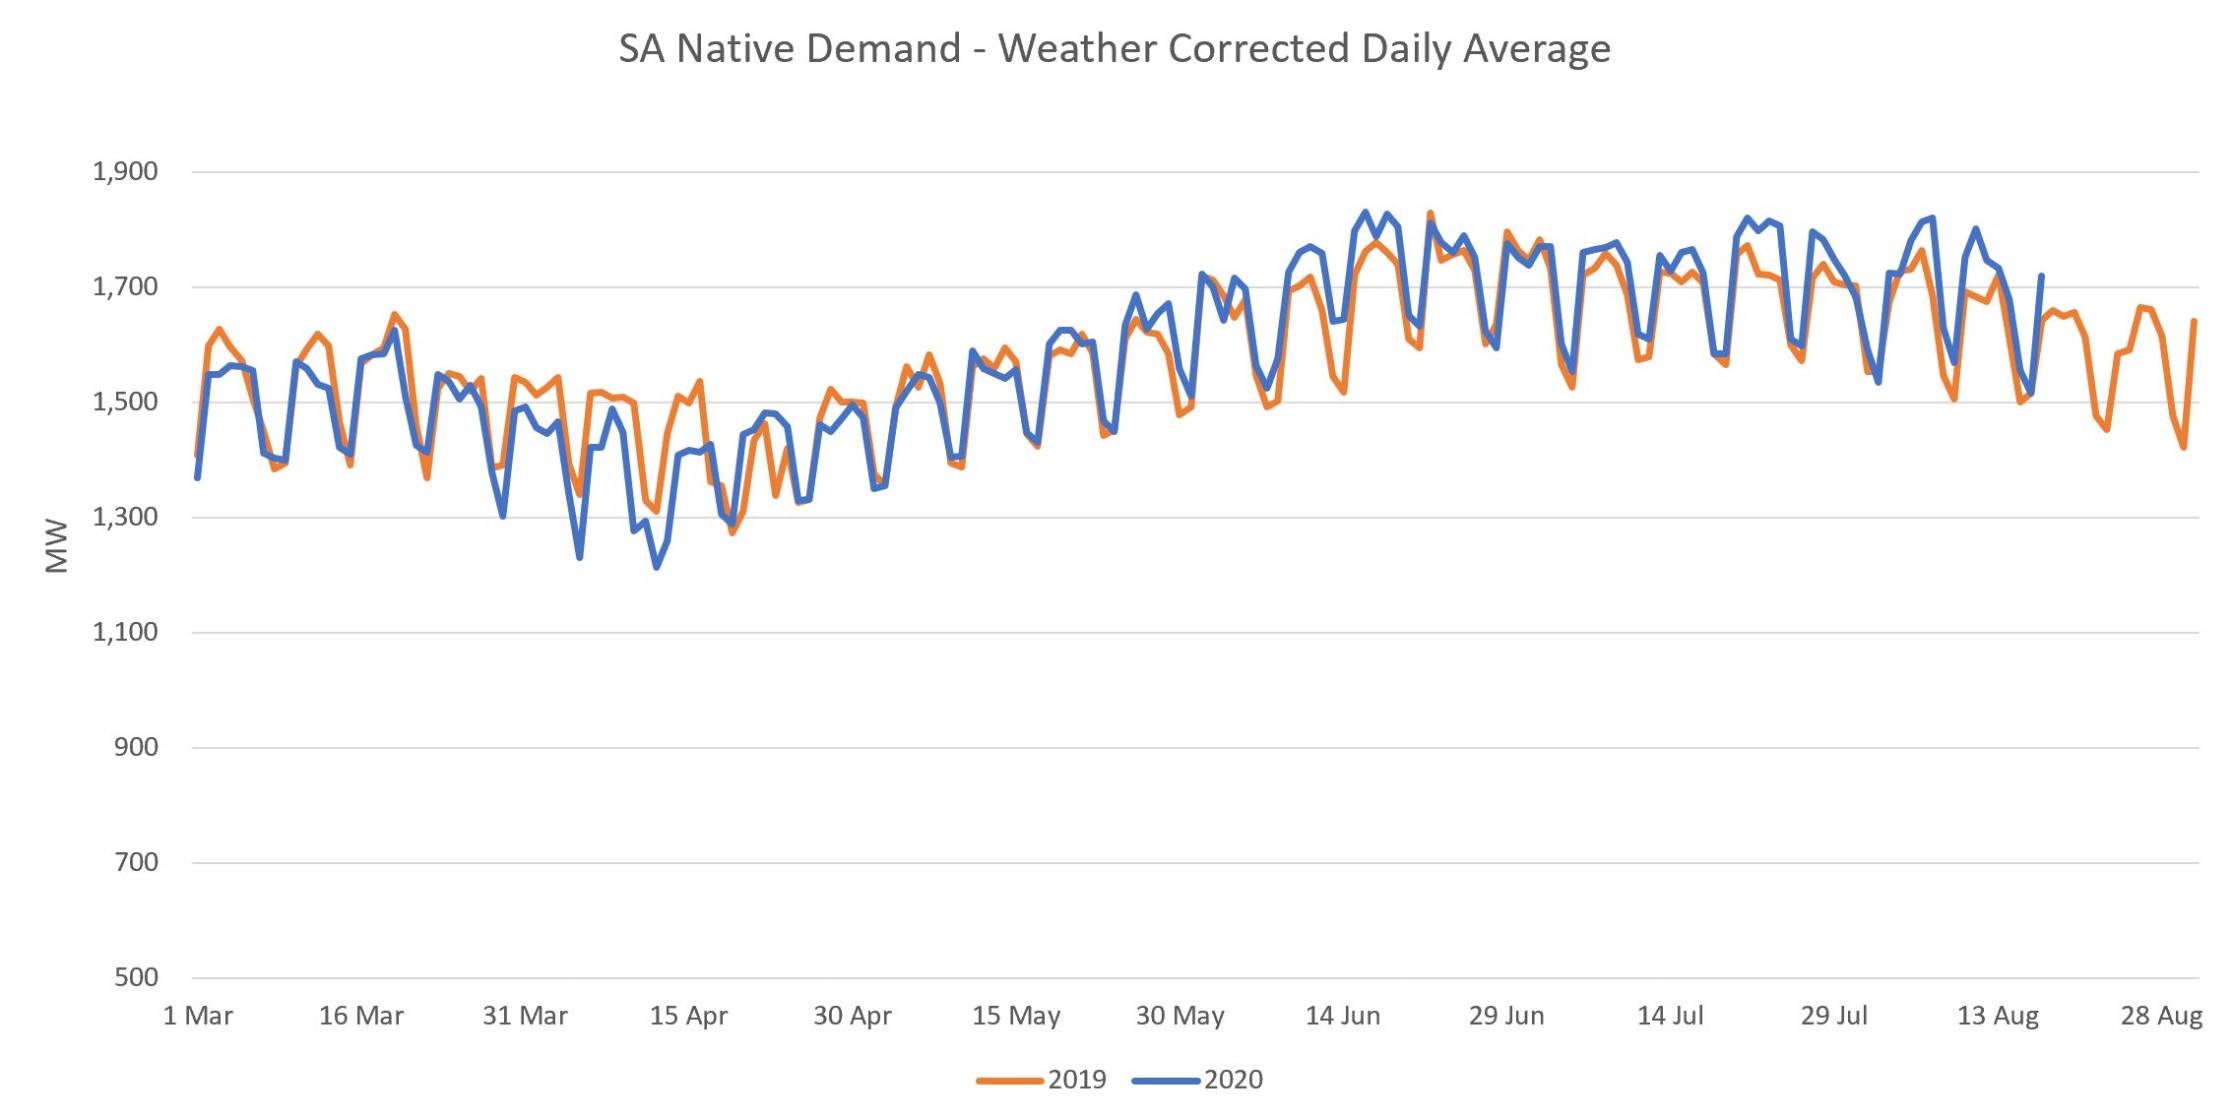
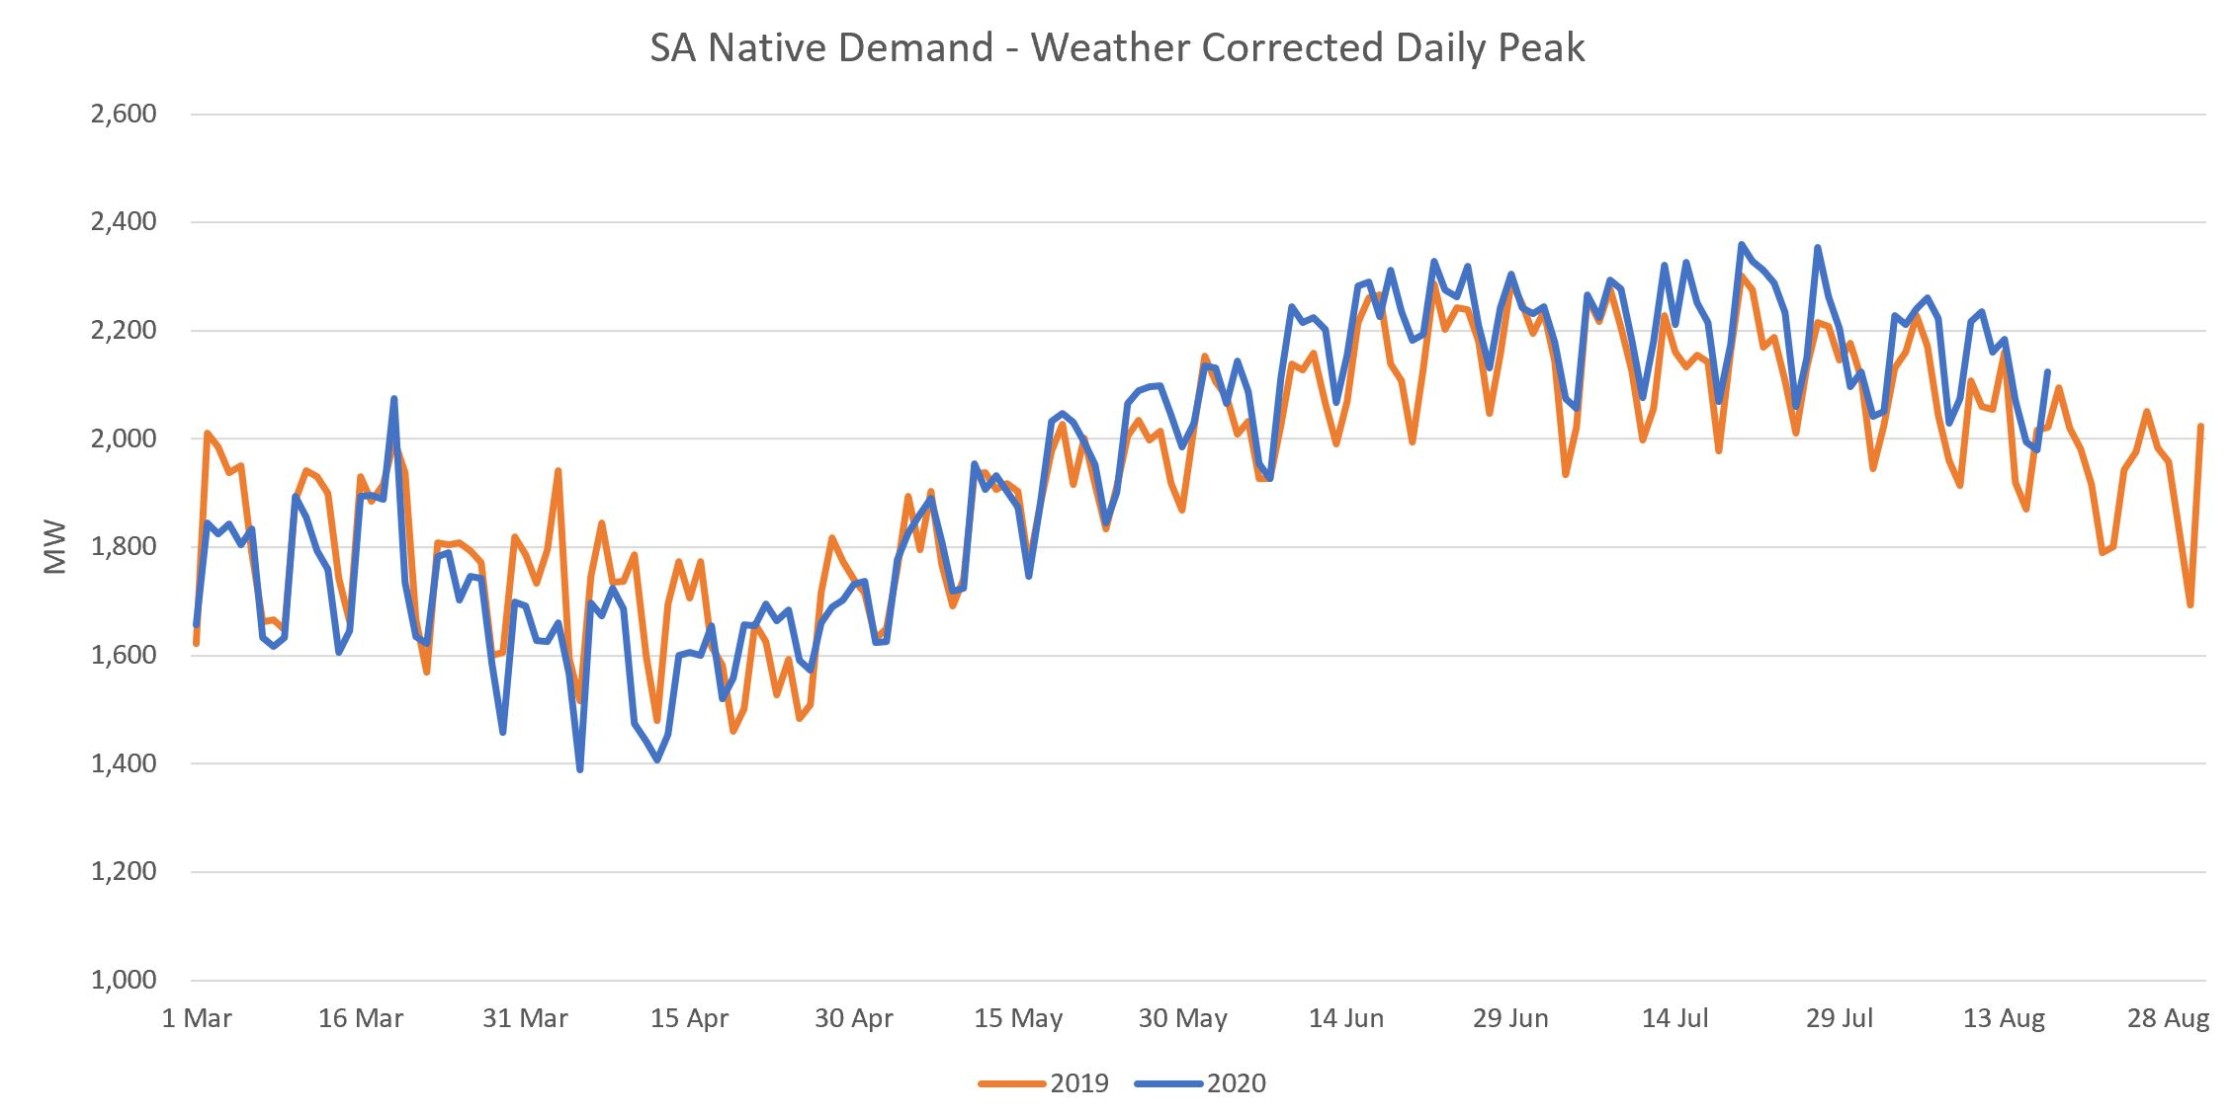
Another option is analyze Native instead of Operational Demand. Native Demand is what demand would be if there wasn’t any embedded rooftop PV. To arrive at this, one must add the generated power from rooftop PV to the Operational Demand series. The issue of course is that the embedded rooftop PV is behind-the-meter, so no such series exists. Although we don’t have it for all states, we’ve teamed up with Solcast to craft a Native Demand forecast in South Australia and include the same weather adjusted analysis below. To learn how we create a Native Demand forecast see our short case study here.
A visual inspection of daily peak demand shows an earlier recovery back in June. It also shows less of an effect in August. That’s to be expected though, because unlike the pandemic’s first wave where all states were affected, the second wave predominately impacts Victoria. So let’s drill down to the state level. Below I’ve included the weather corrected daily average and peak demand for each of the five states in the NEM.
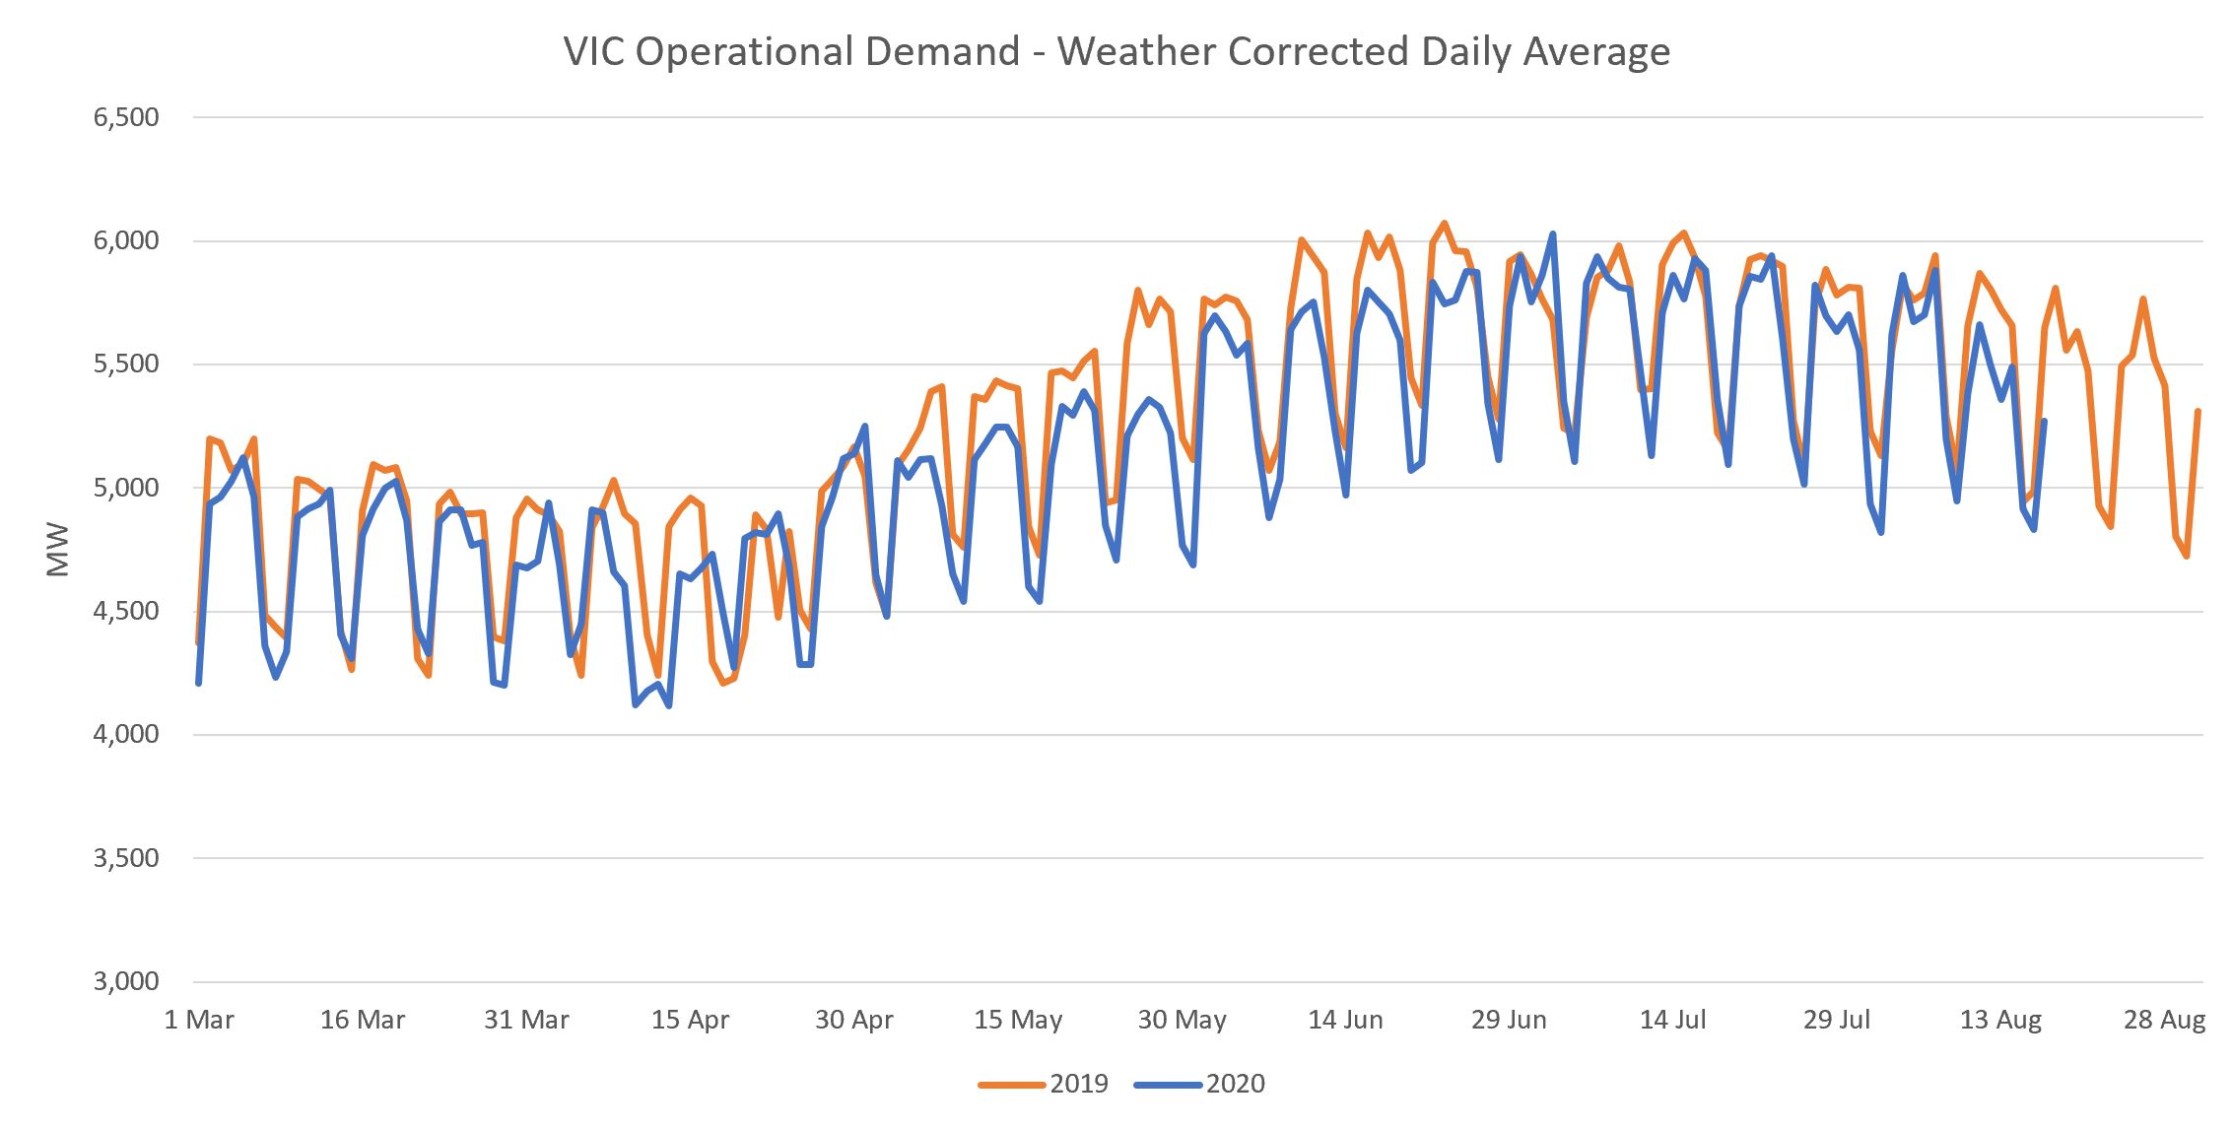
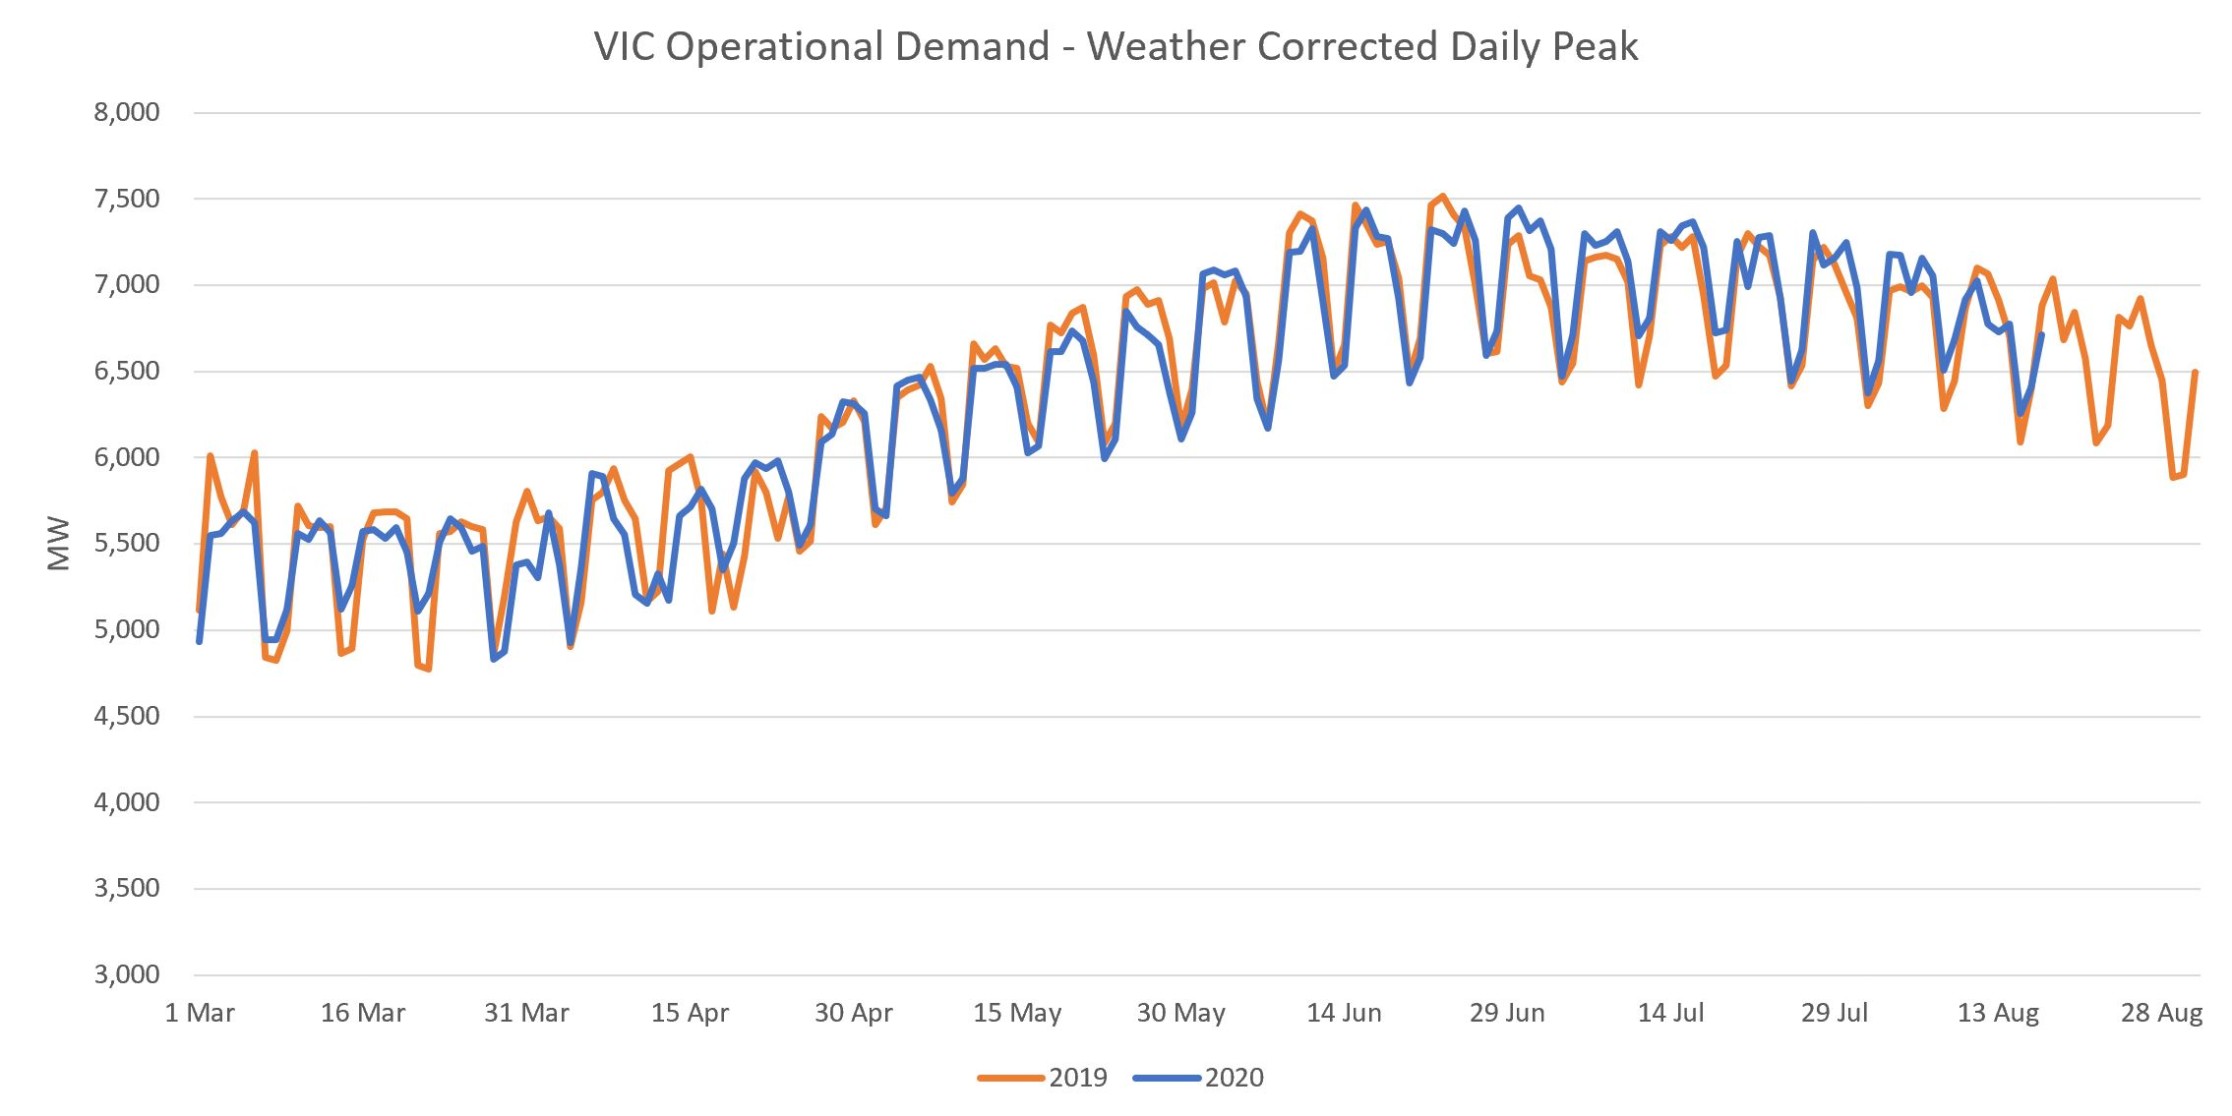
VIC
We see the same trend as the overall NEM but with significantly lower average and peak demand this past week. To be expected as VIC is now the state hardest hit by the pandemic.
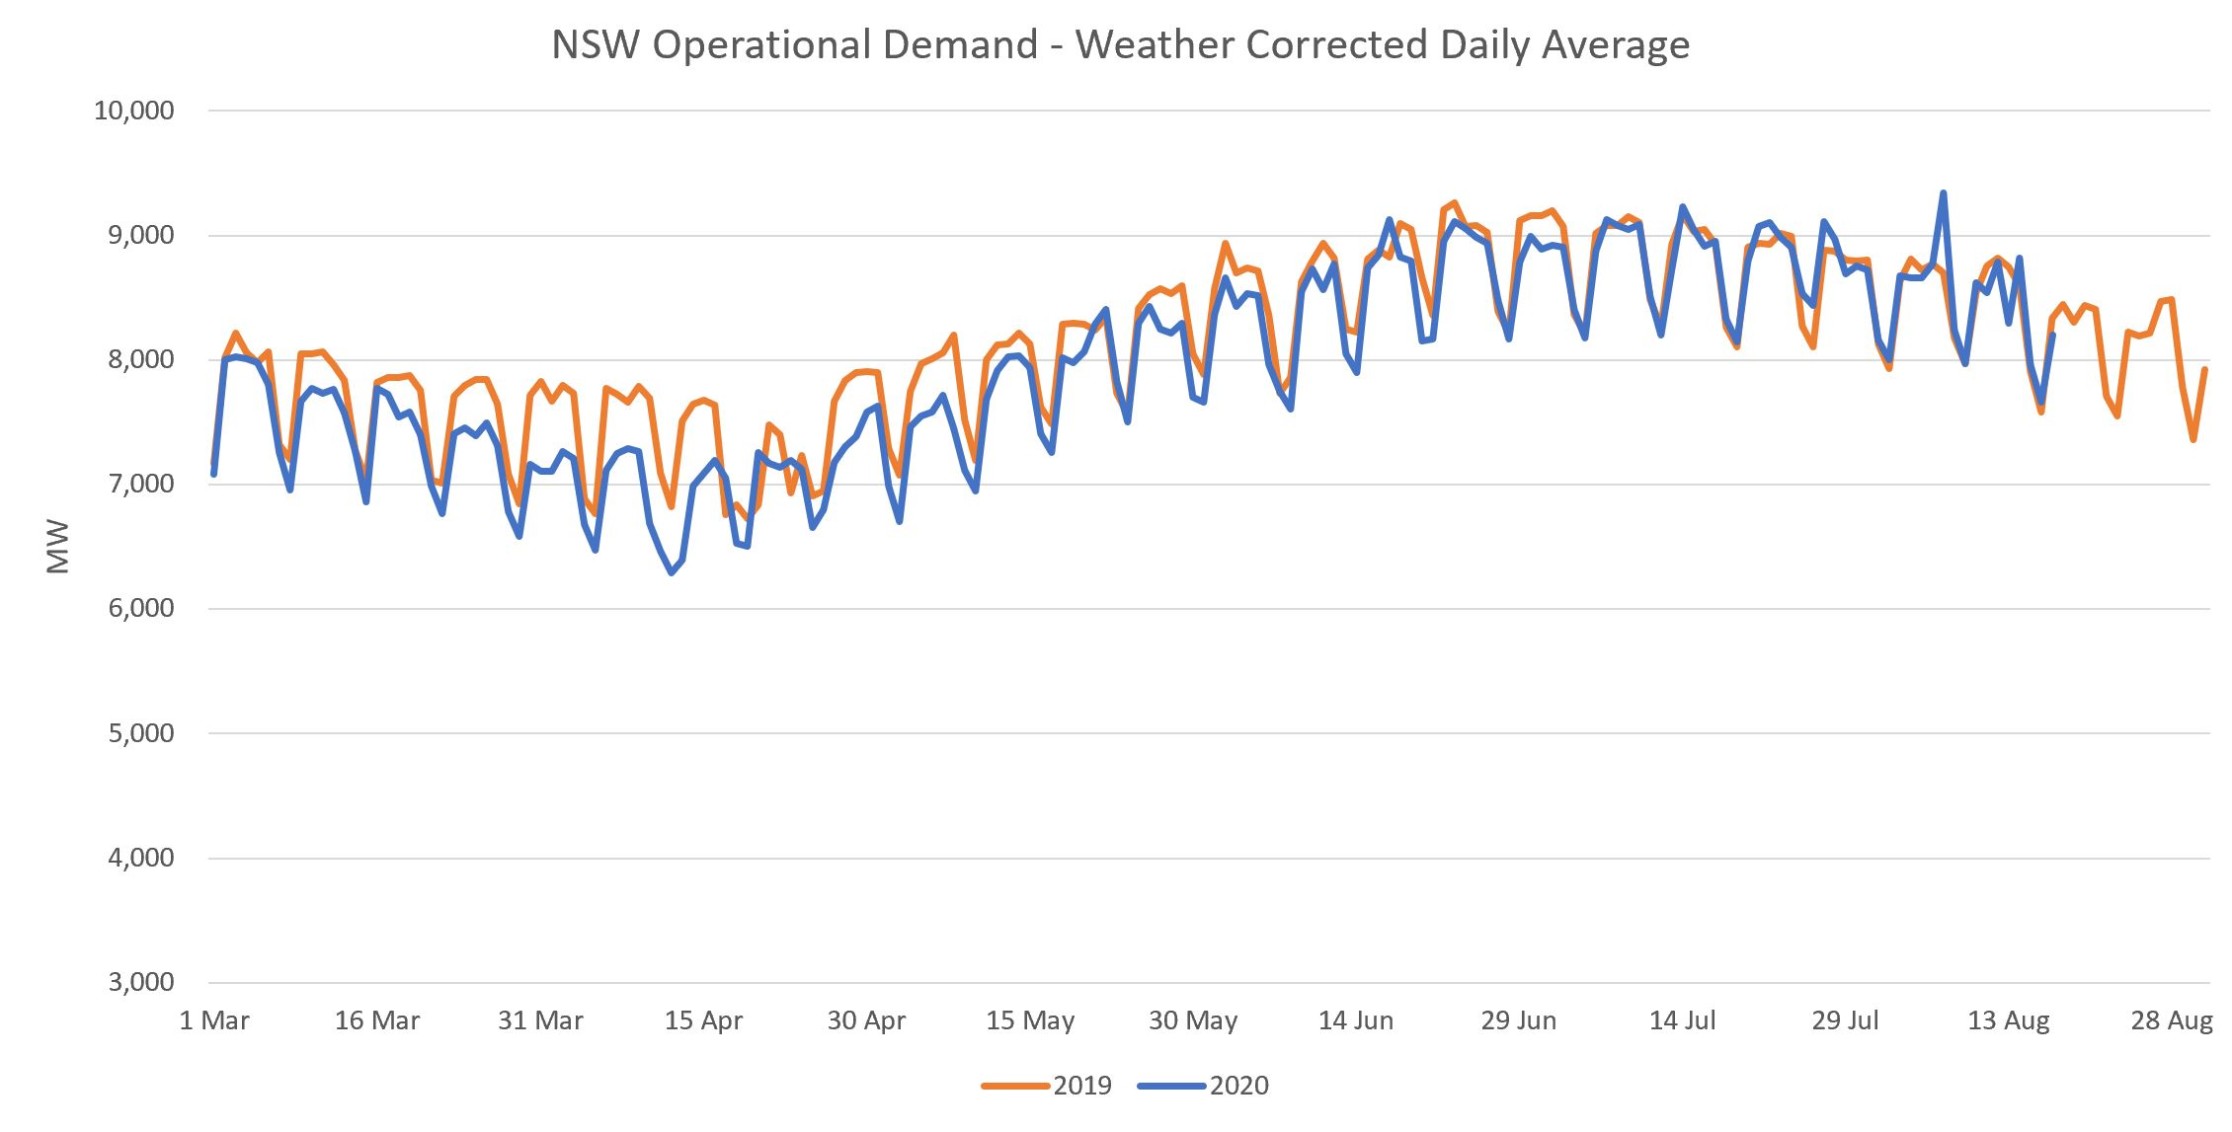
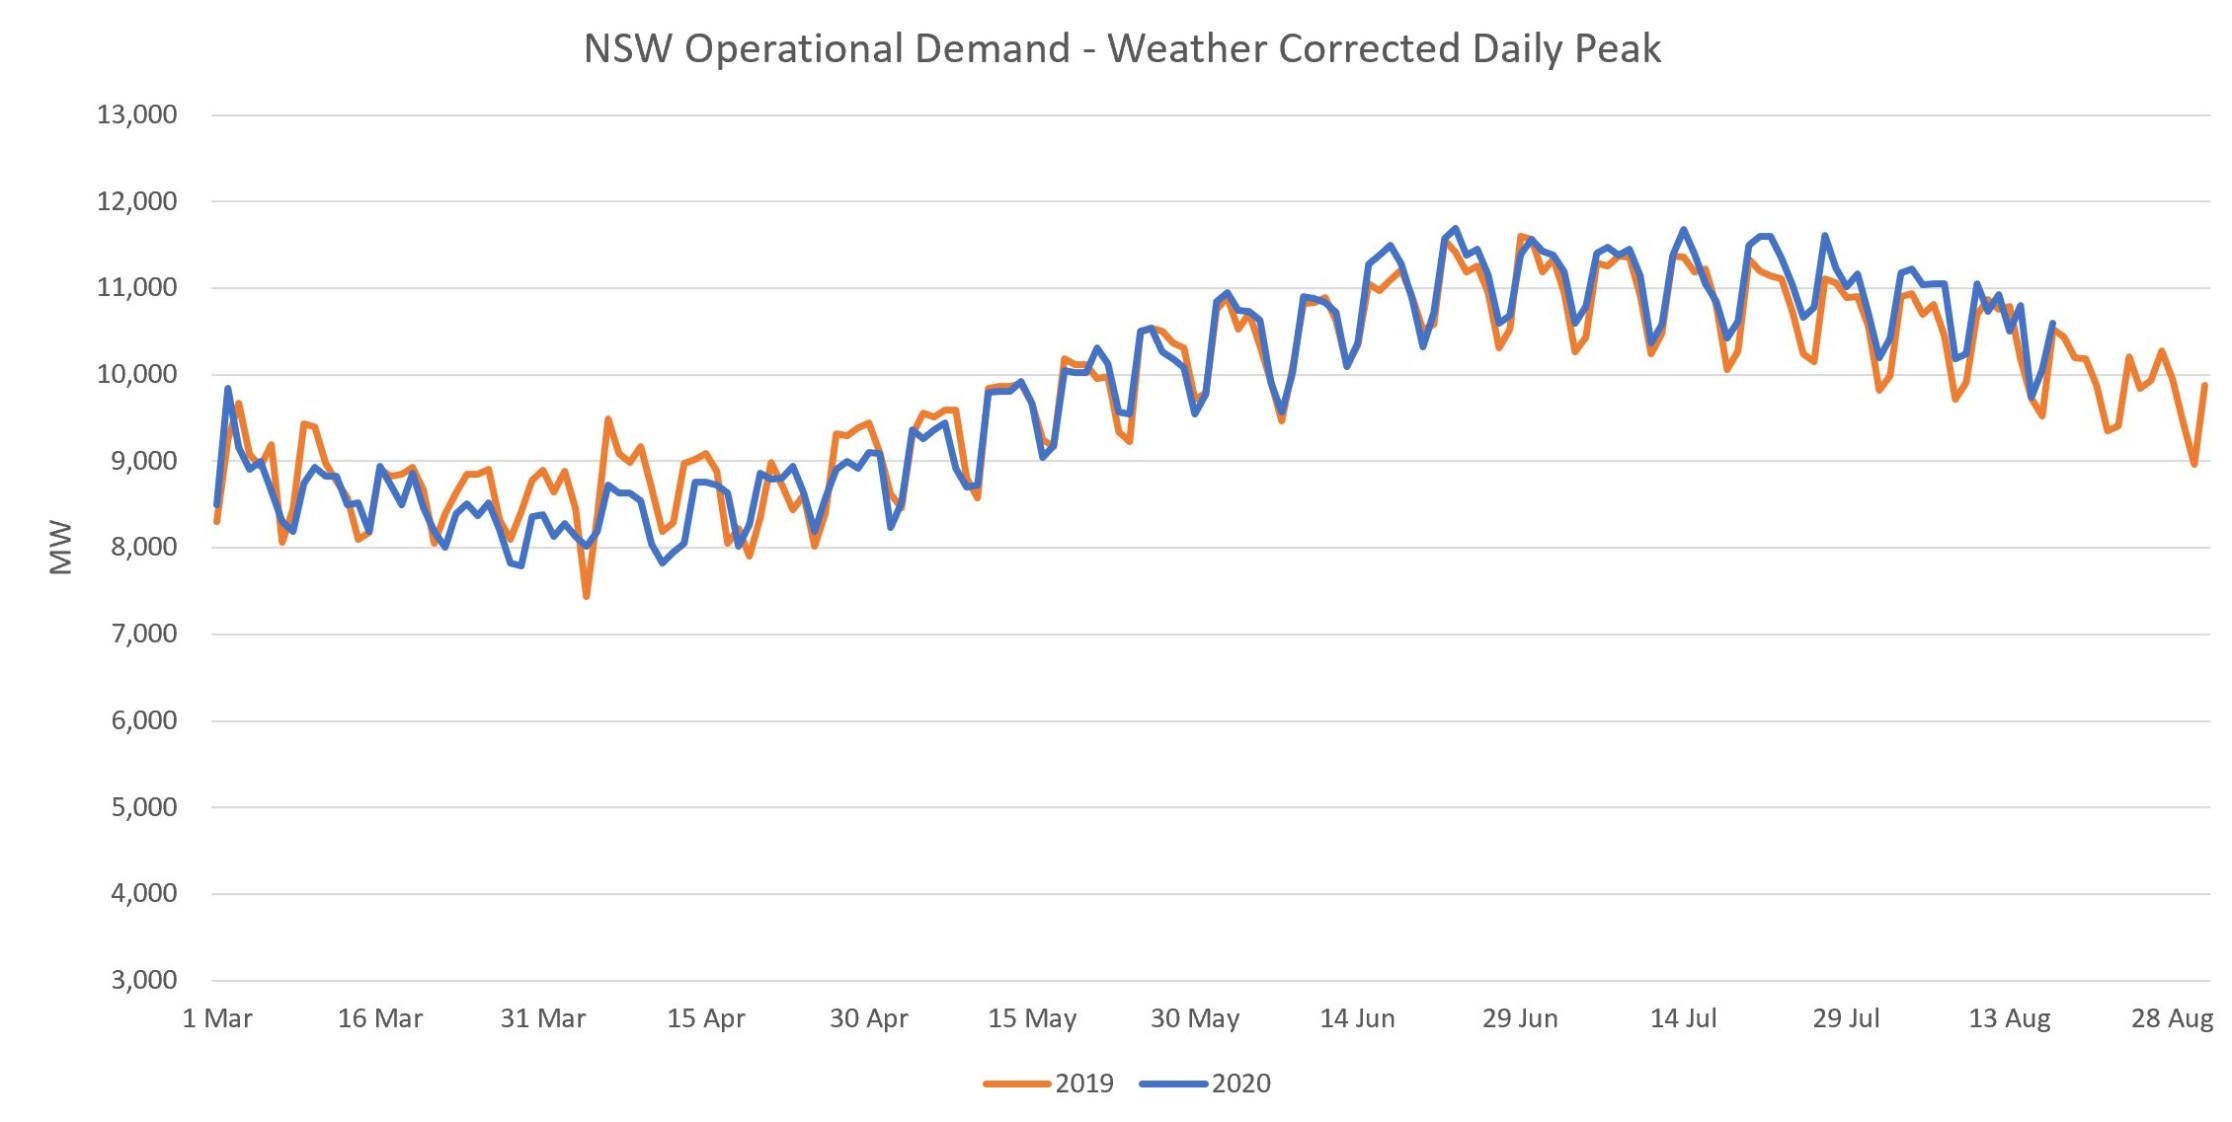
NSW
Significantly lower demand in March and April that has since recovered.
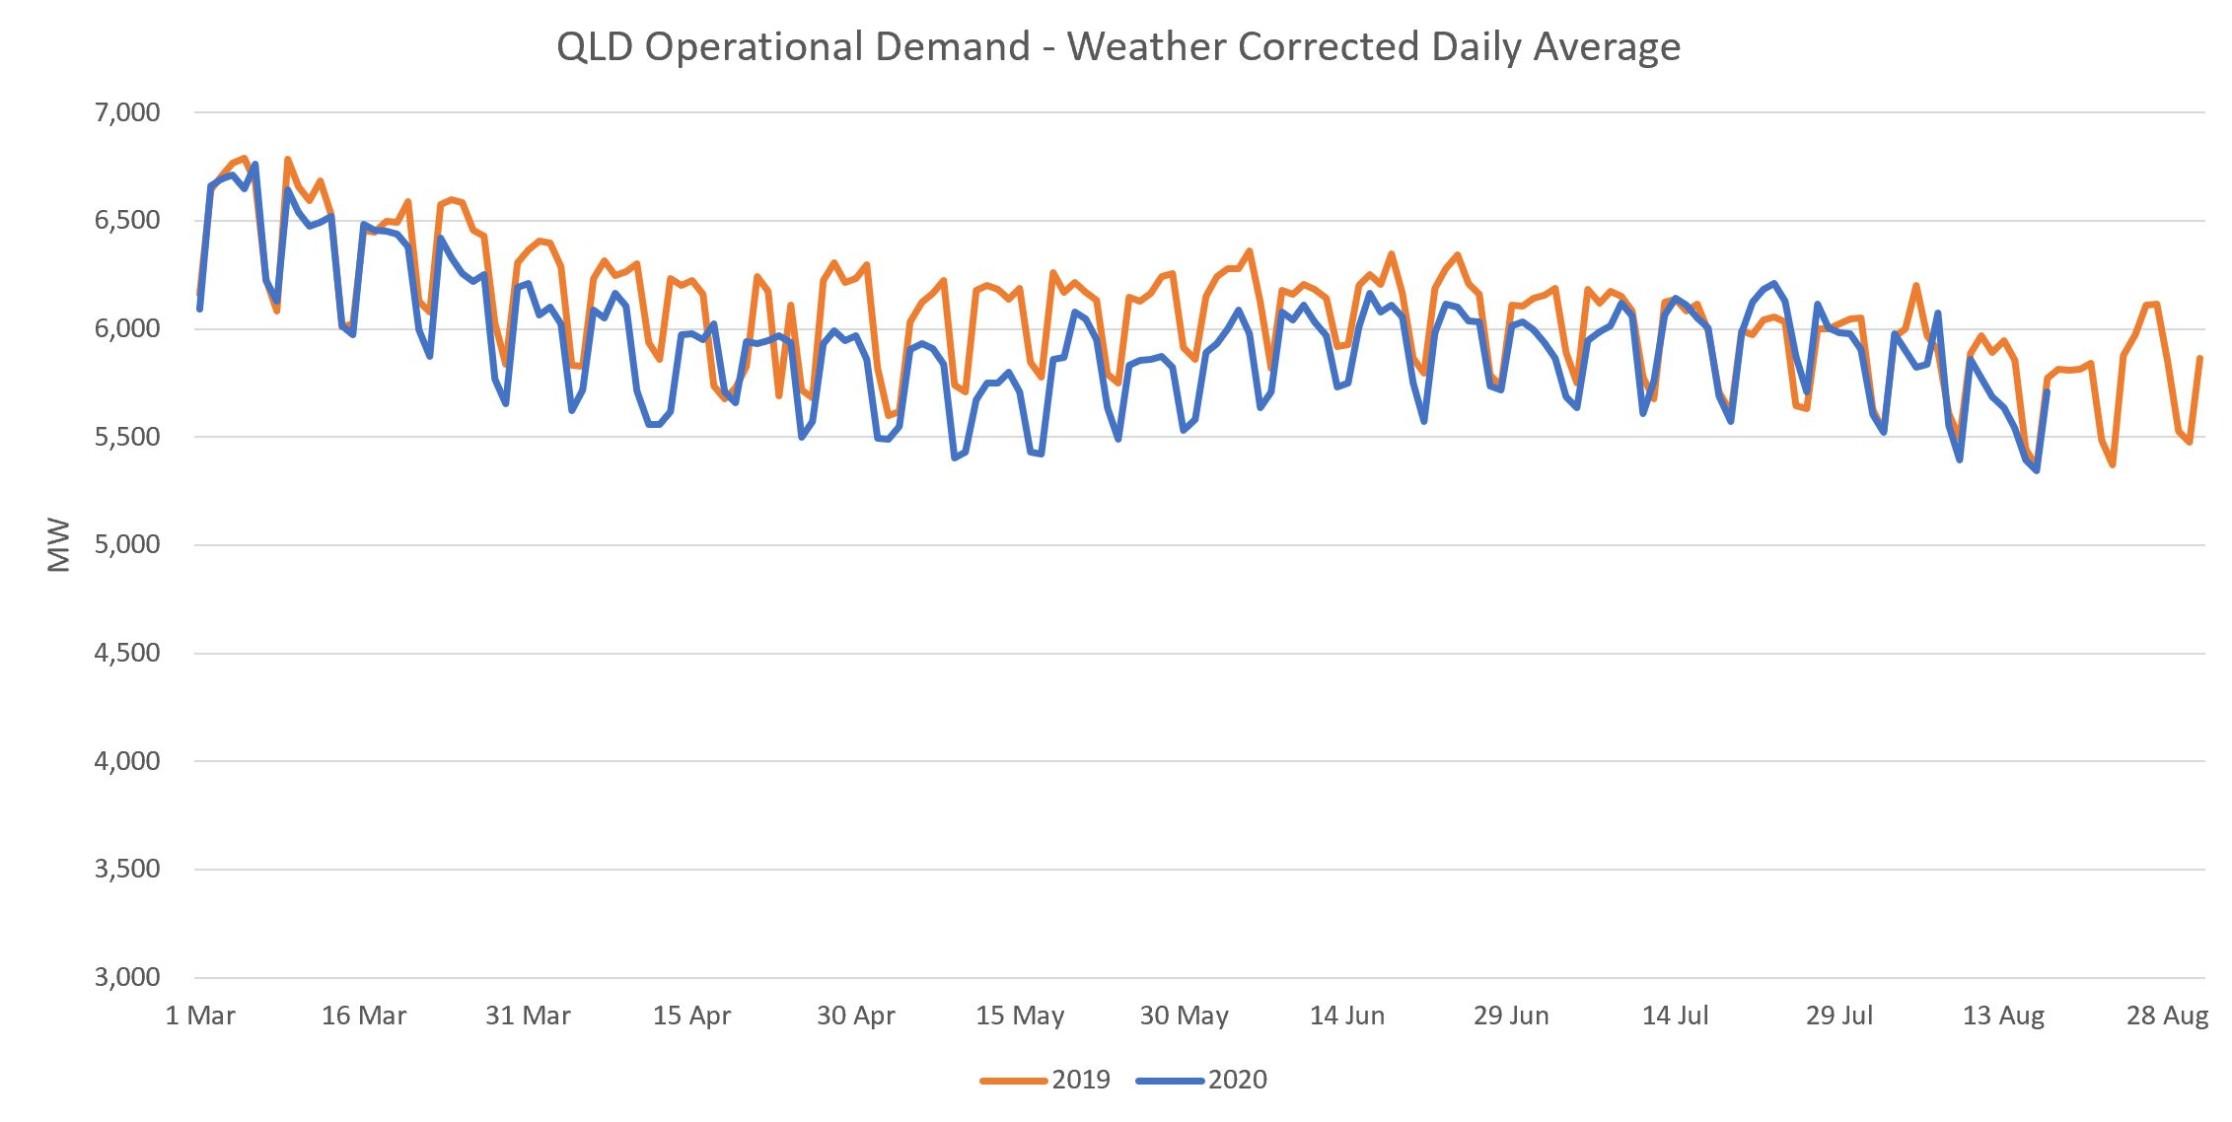
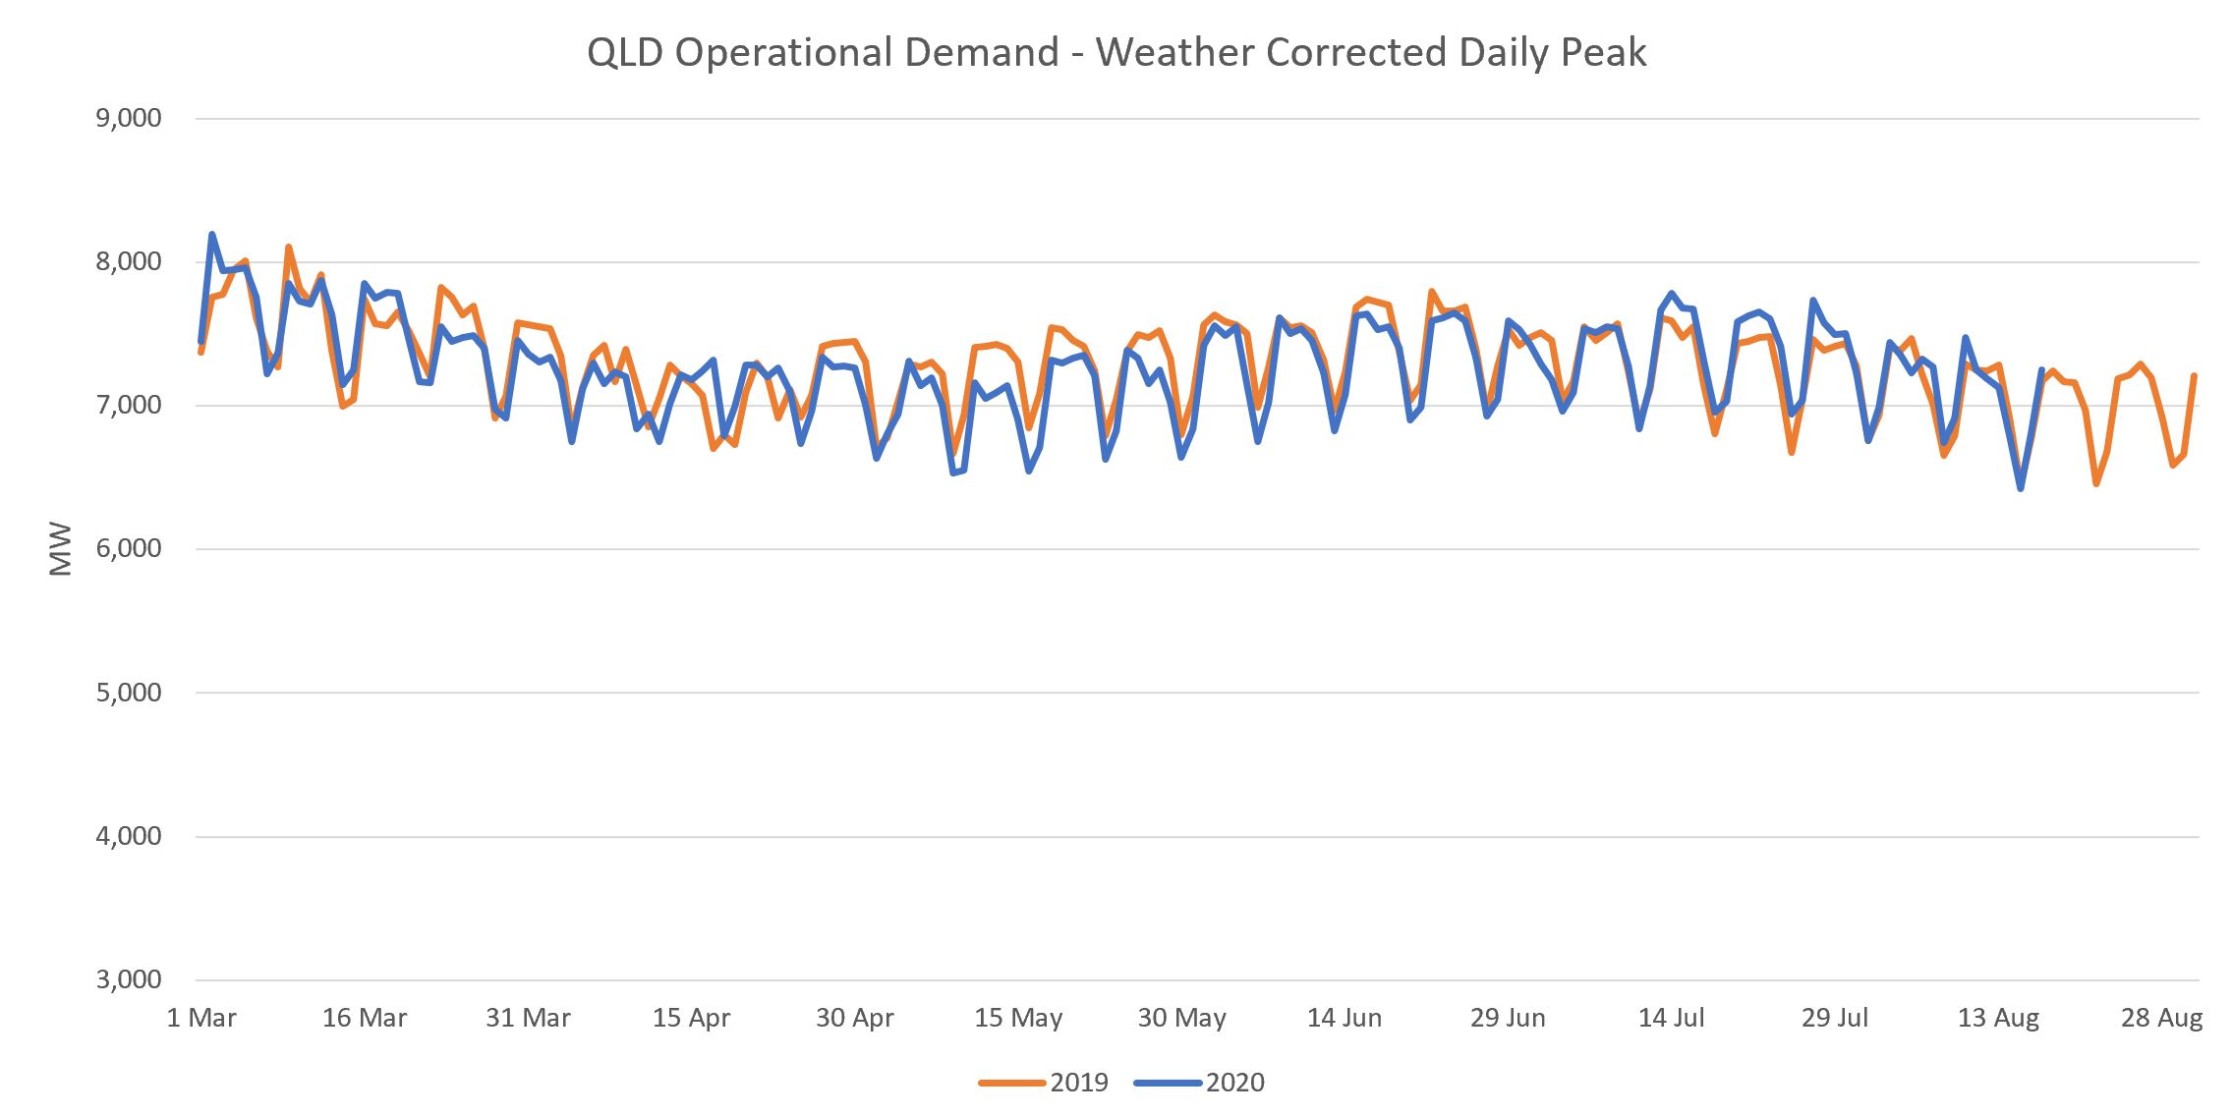
QLD
Peak demand shows a modest recovery.
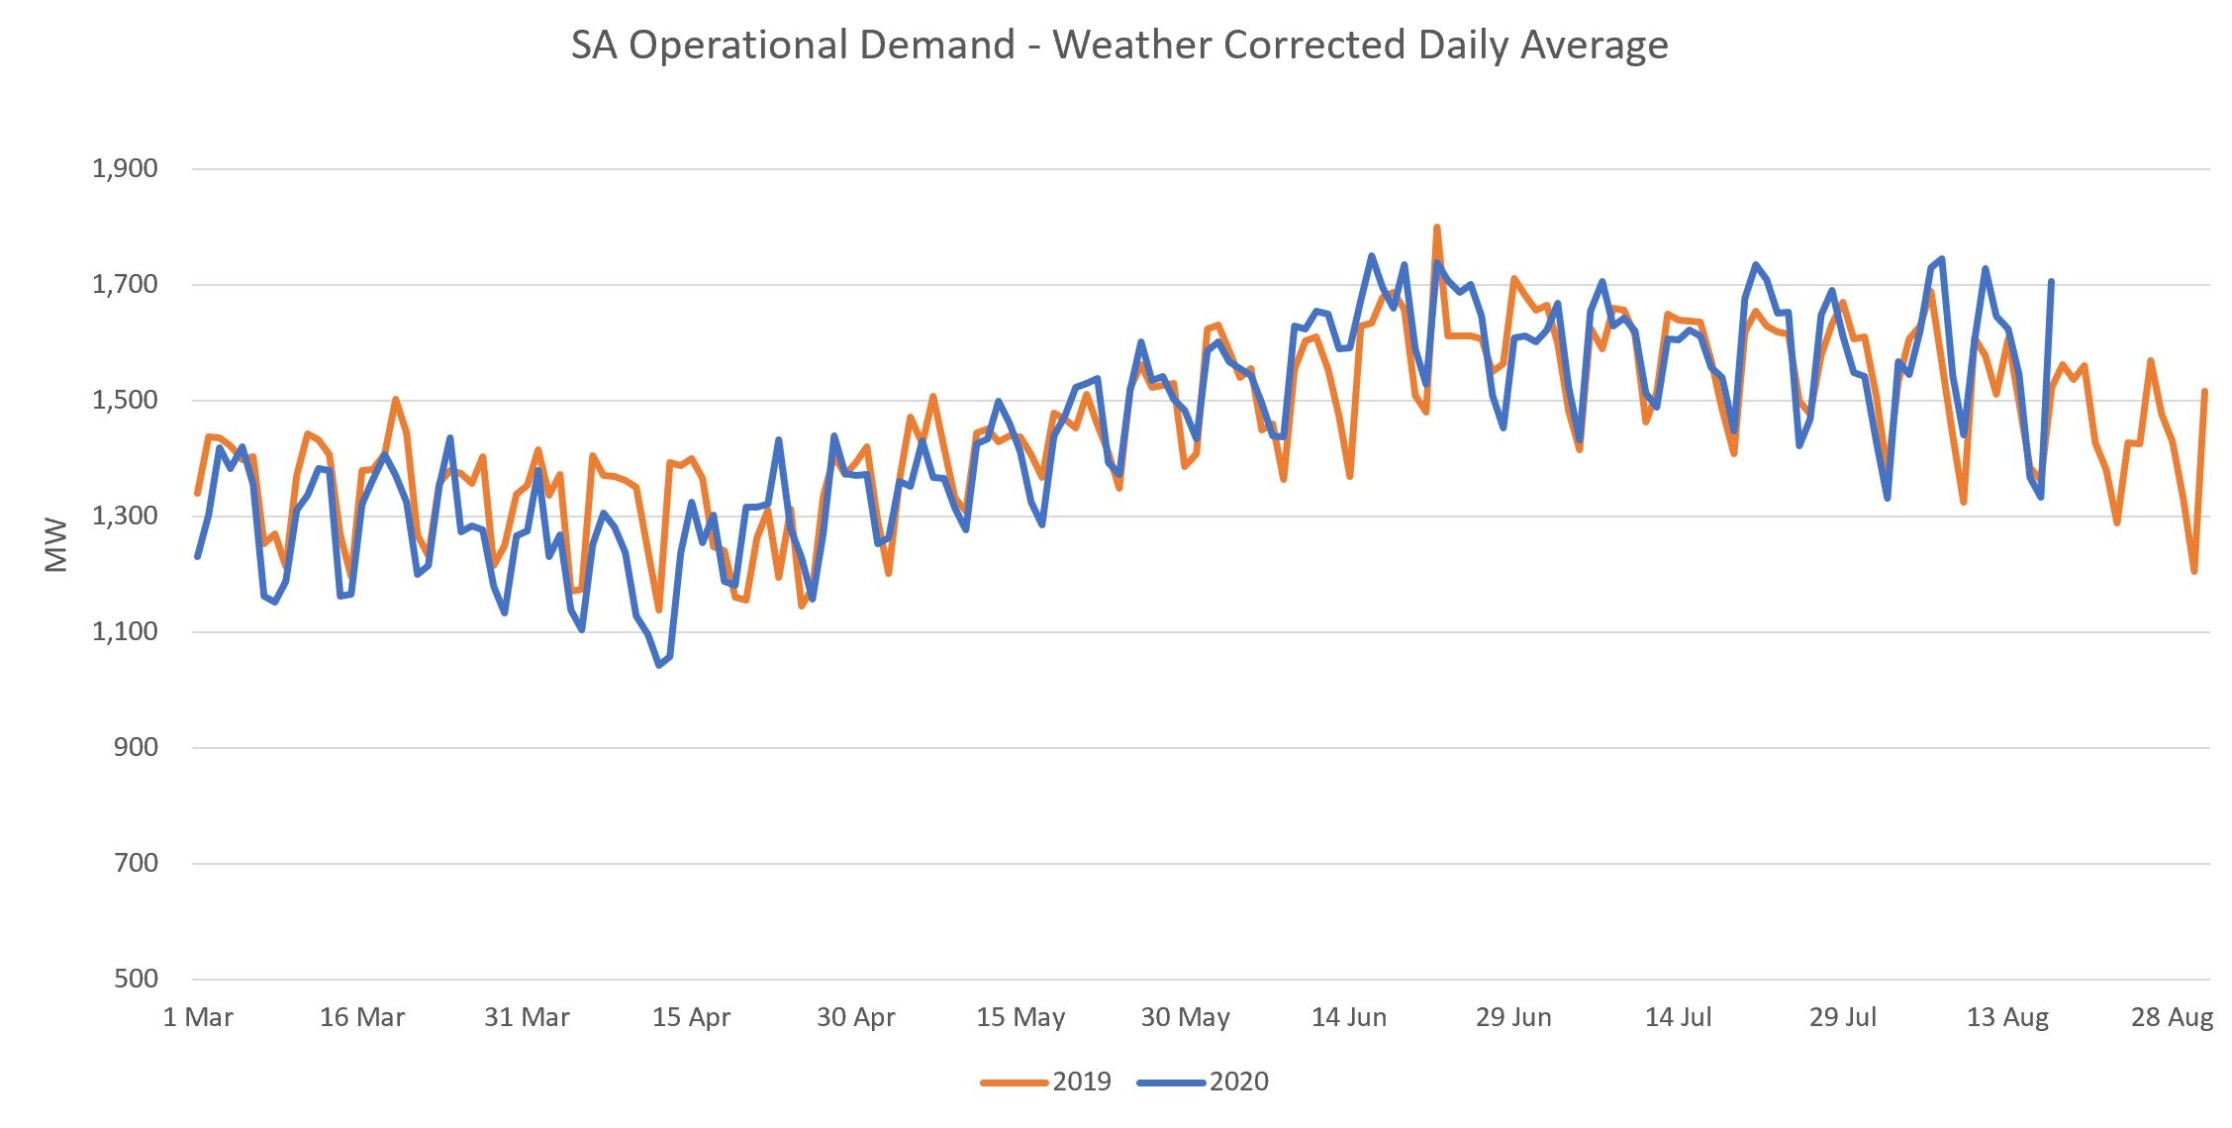
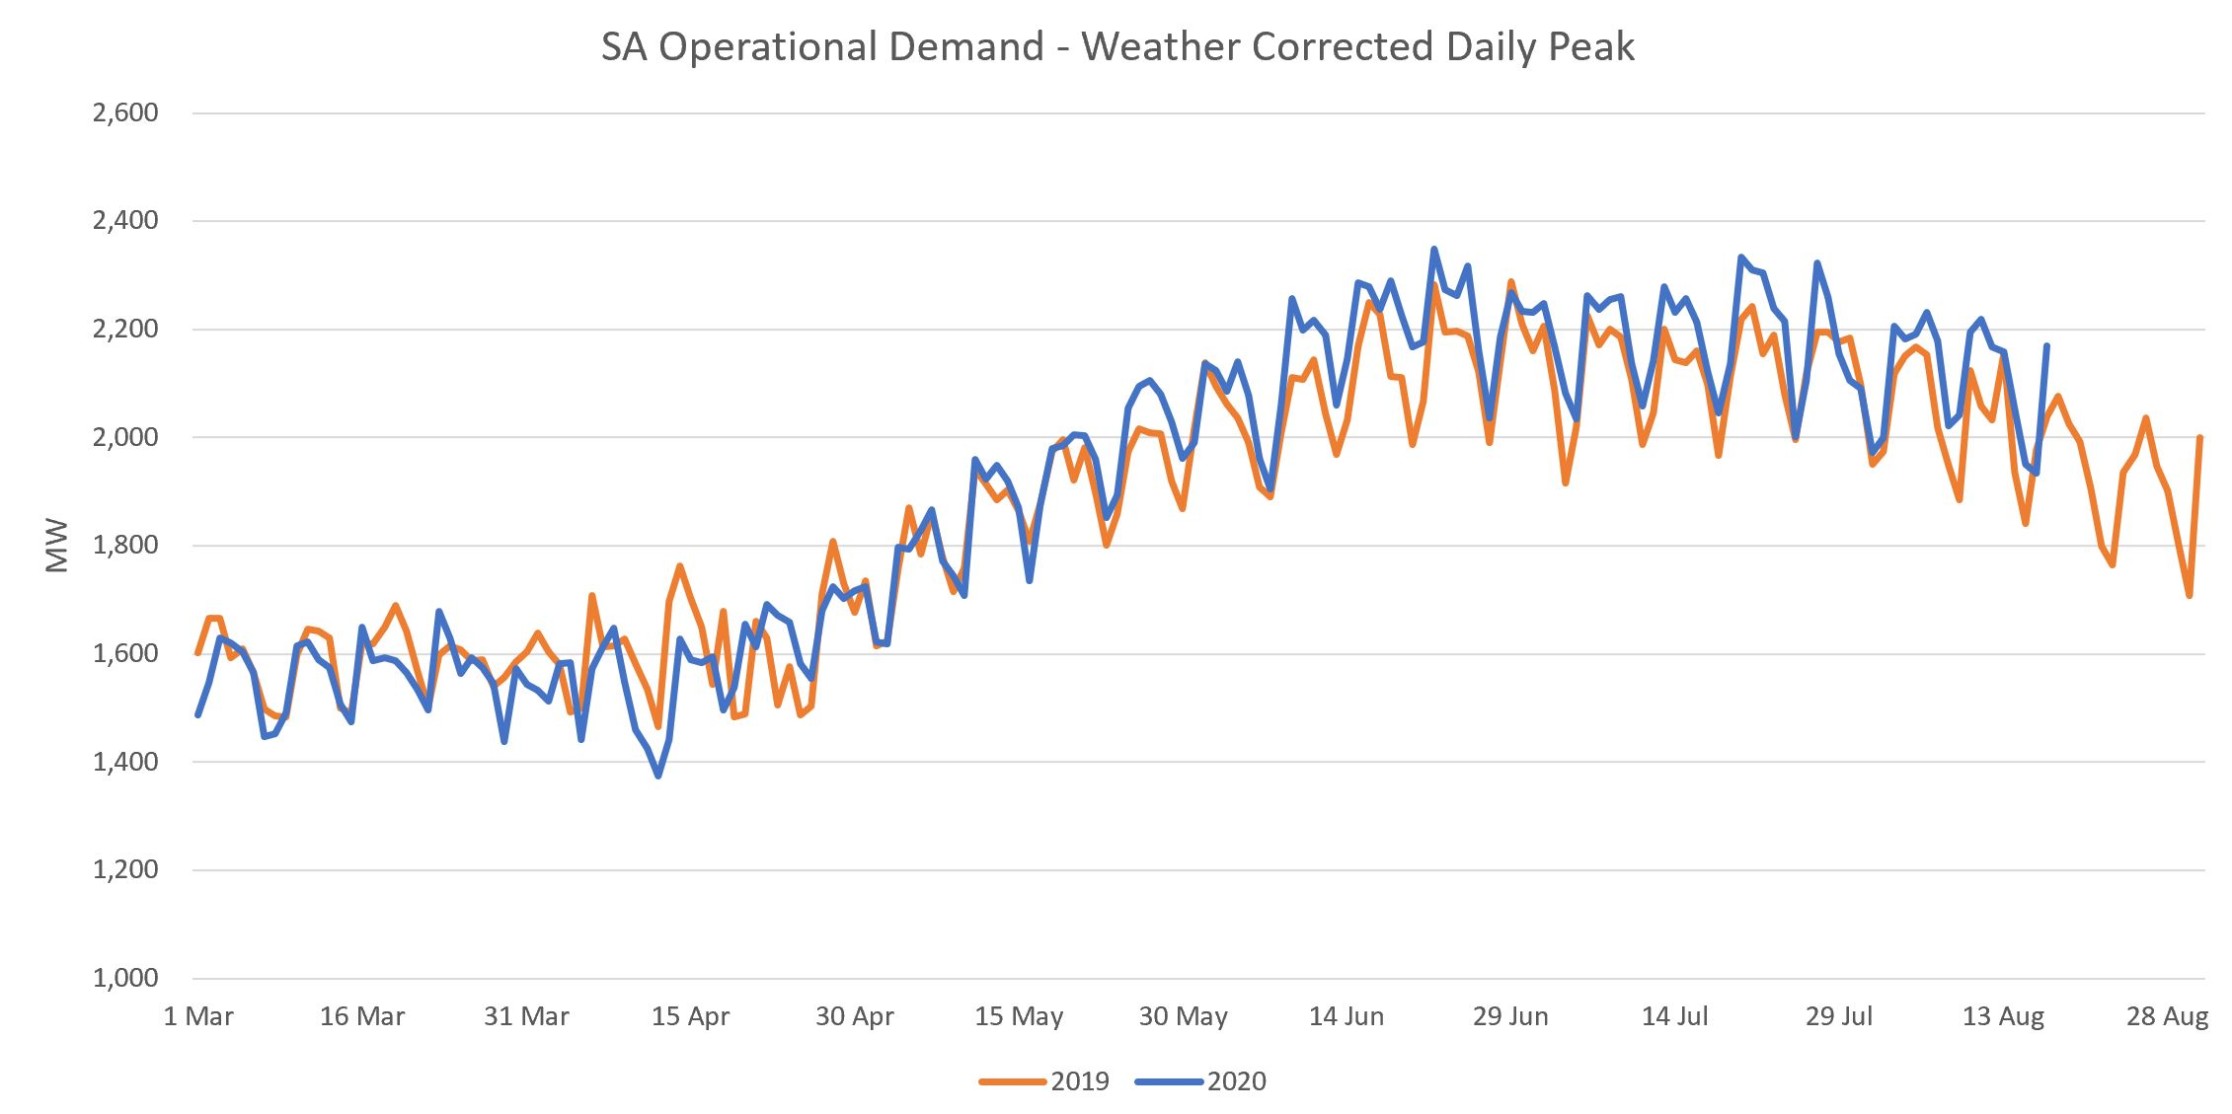
SA
We can see lower demand in March/April with an apparent recovery near the end of May. The recovery is easier seen in the peak demand, where we can look past some of the noise from additional embedded PV.
SA (Native Demand)
Like Operational Demand, but the story is now much clearer for daily average demand. Just as we’d expect since the embedded PV has been removed.
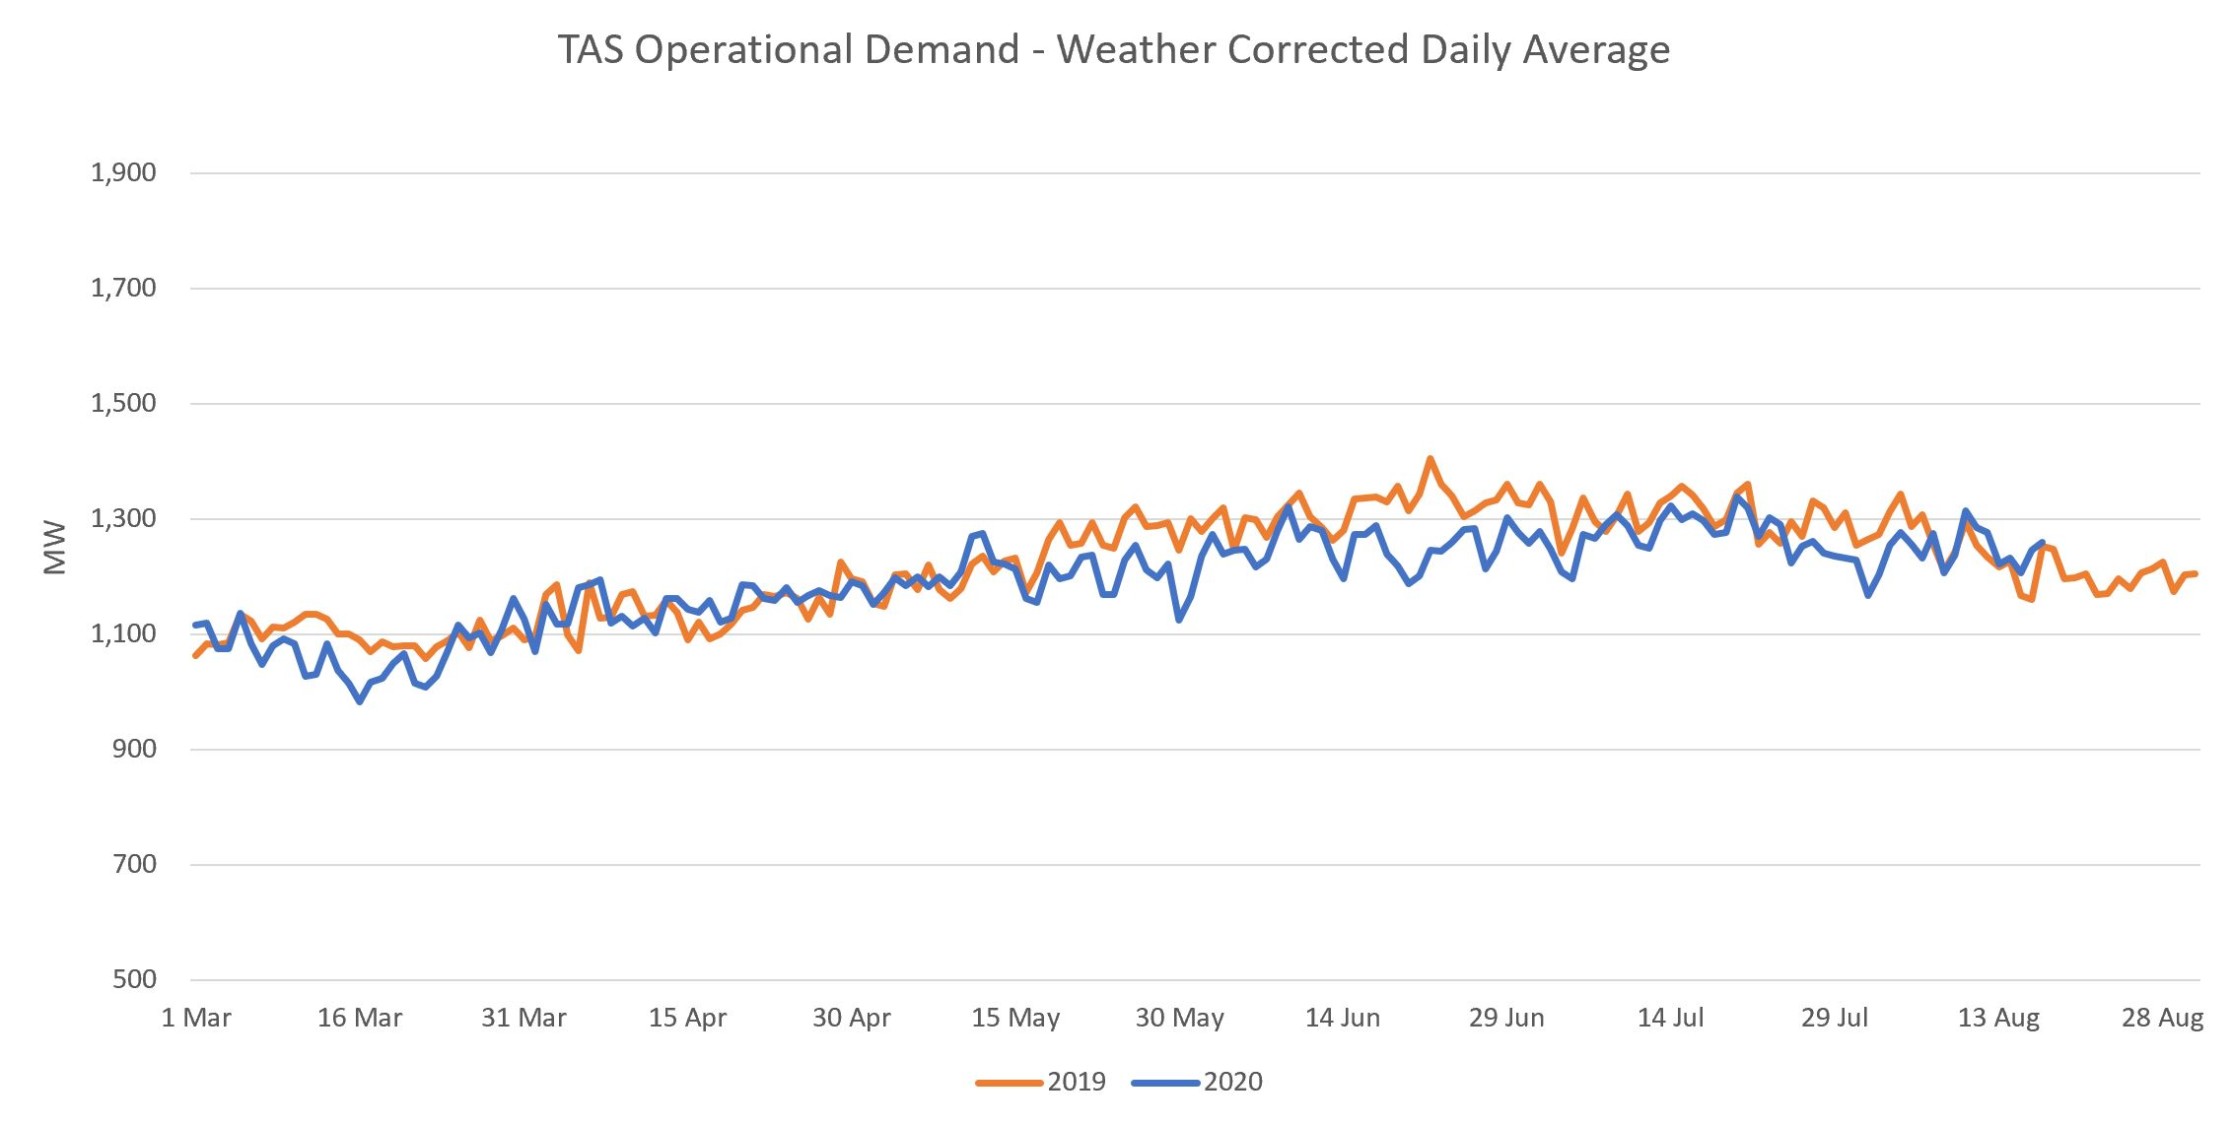
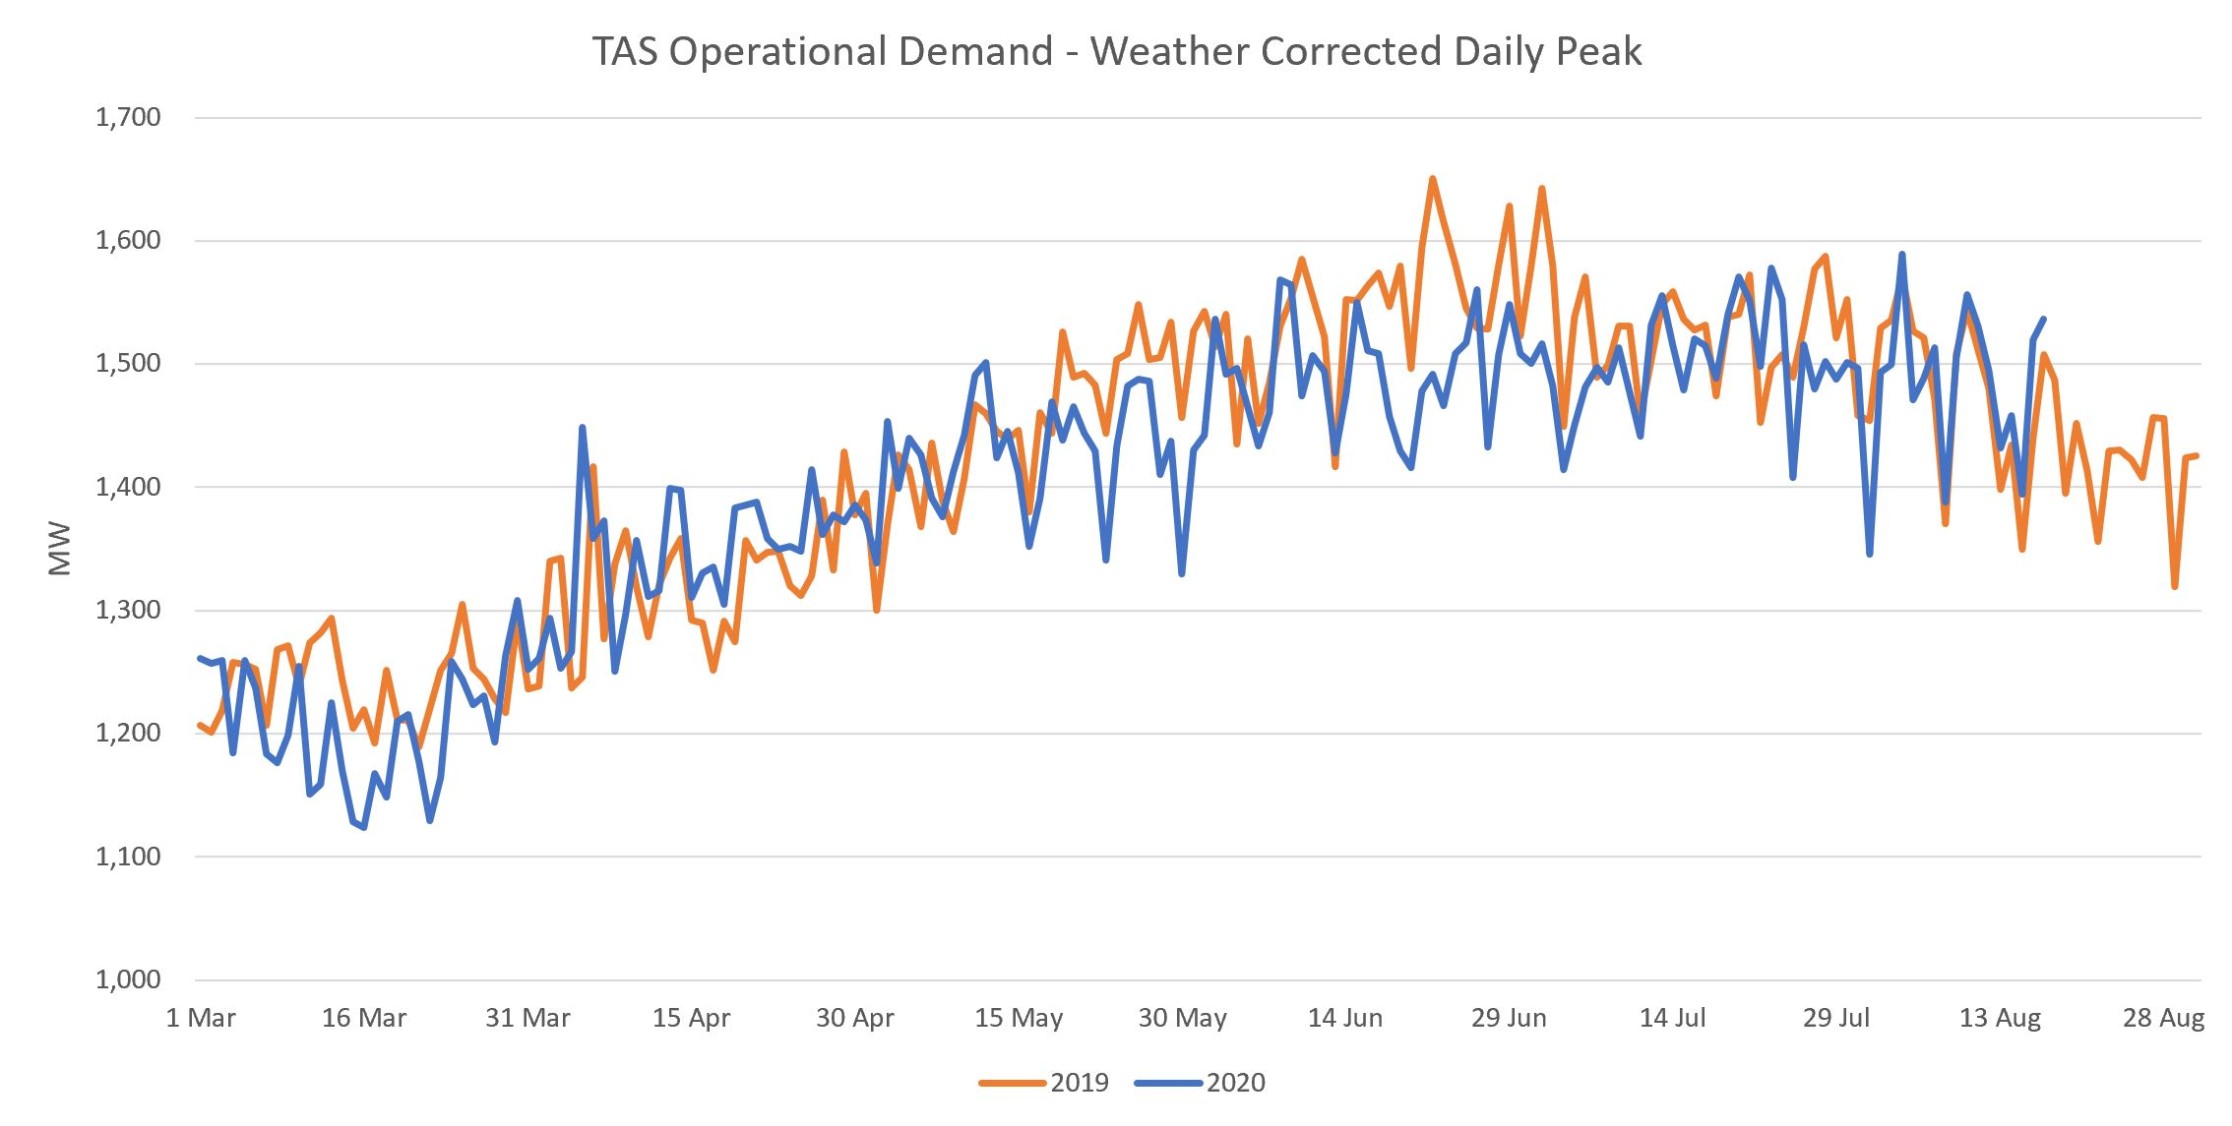
TAS
No clear effect in Tasmania.
If you have any questions feel free to write them in the comments or send me a message or email mtodoroff@teslaforecast.com
————————————–
About our Guest Author
 |
Mark Todoroff is the Business Development Director of Asia Pacific at TESLA Forecasting Solutions. He began his career at TESLA, Inc. in 2011 as an Economist. In 2015 he transferred to TESLA Asia Pacific Ltd. to lead the Forecasting Team. Now as Business Development Director, he oversees the strategic growth of the Asia Pacific business.
You can find Mark on LinkedIn here. |
Be the first to comment on "Quantifying pandemic effects on power demand in Australia’s National Electricity Market"