Since last Saturday, we’ve walked through 10 individual Case Studies to cover the 10 incidences identified where Aggregate Raw Off-Target across all Semi-Scheduled plant was in excess of 300MW in either direction. These 10 Case Studies covered the all of the incidents seen over 2013, 2014, 2015, 2016, 2017 and through until August 2018.
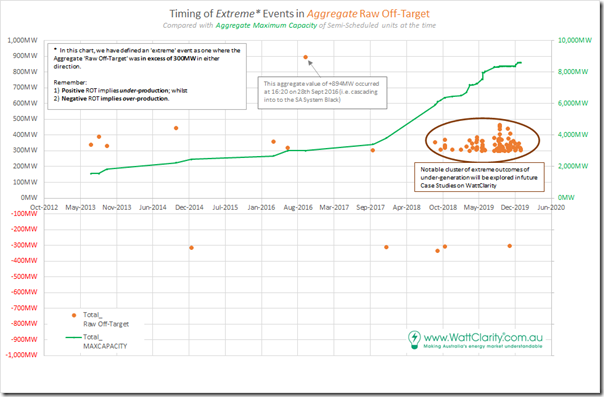
1) Beginning September 2018 through until of December 2019, however, we found a total of 88 incidences meeting the same criteria of extreme. This is a steep increase, as seen in the following chart:
2) Hence with this 11th Case Study, we tackle the first incident in this cluster of cases – which happens to be early morning (02:35) on Saturday 15th September 2018.
3) Note also that we have not yet looked into 2020 data, which will be the focus of the GSD2020 (so we can’t comment on whether the trend from 2019 has continued to grow).
4) We’re doing this given a push from the AER Issues Paper, but moreso inspired by the deliberations by the (now defunct) COAG Energy Council and (under threat?) ESB relating to ‘NEM 2.0’.
Note that these case studies deal with imbalance in the Dispatch Interval timeframe, but readers should understand that there are other challenges that ‘NEM 2.0’ also needs to resolve, including:
(a) Within the dispatch interval timeframe, energy-related services focused on frequency maintenance and response to contingencies;
(b) Relating to ‘firmness’ of supply in the broader forecast horizon; and
(c) Others that we bundled into a ‘keeping the lights on’ services in our discussions in the Generator Report Card 2018 (for instance, in relation to System Strength).
5) In preparing these focused Case Studies, we’re seeking to understand why and what the implications are of this escalation.
—————
… so let’s look at this particular event:
(A) Summary results for Saturday 15th September 2018
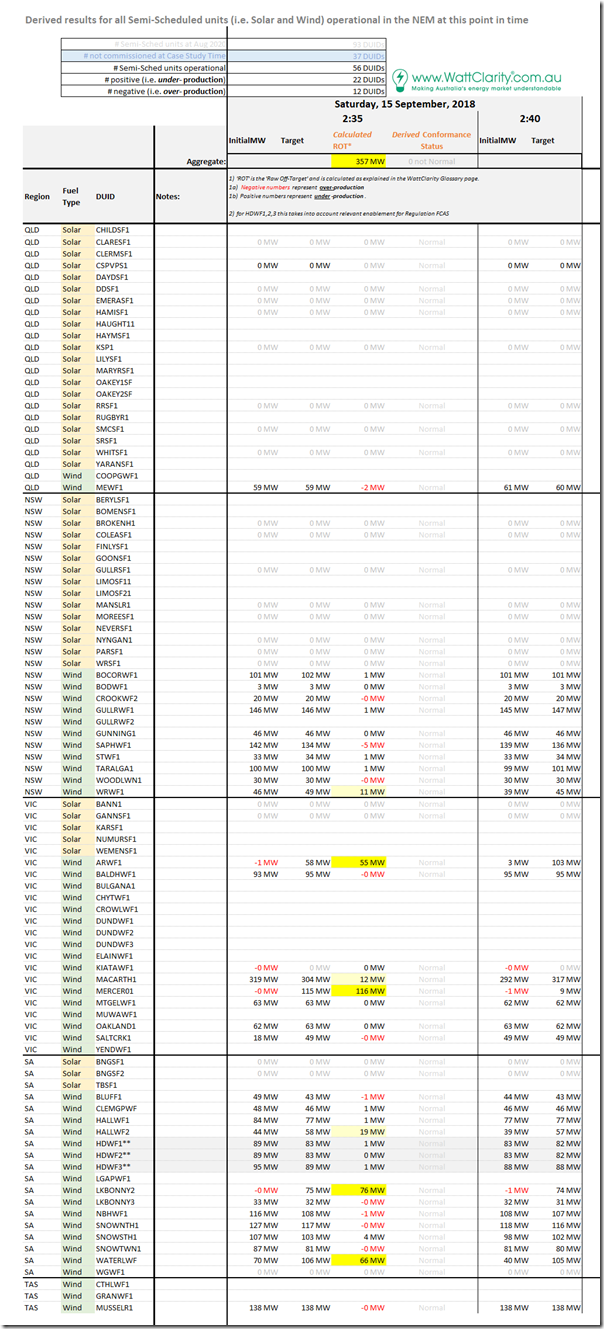
Here’s the same tabular framework of results for individual Raw Off-Target performance of all Semi-Scheduled units that were operational at the time:
There appears to be a slight discrepancy in the numbers, which is presumably due to rounding at some point (i.e. in the table above shows the total at +357MW, whereas we had previously calculated as +355MW). It does not seem worth exploring the reasons for that discrepancy.
Also from this table, we can see:
1) A total of 56 DUIDs operational, which 22 more than the 34 DUIDs shown in the preceding case study from 18th December 2017 (i.e. only 9 months earlier).
1a) Many of these new DUIDs are solar farms in QLD, but none were showing output at this time (being middle of the night);
1b) It’s worth noting that all of the units showing significant variation were already existing in that Dec 2017 Case Study (i.e. this incident is not due to the new units).
2) In terms of the ratio of performance:
2a) this case we see almost double the number of units under-performing (22 DUIDs) as there were over-performing (12 DUIDs), even by just a small amount; and
2b) there are 7 x DUIDs flagged as under-performing by a significant amount across NSW, VIC and SA – with 4 of these significantly so.
So we’ll walk through each of these units in turn…
(B) Results for individual DUIDs
Again we can show this specific dispatch interval clearly with the ‘Unit Dashboard’ widget in ez2view, wound back 3 years ago through the powerful ‘Time Travel’ functionality:
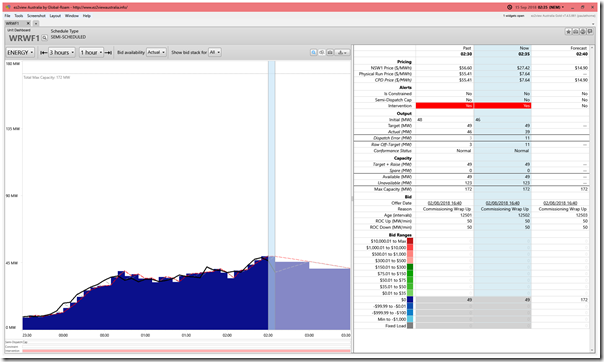
(B1) White Rock Wind Farm in NSW
The WRWF1 is softly highlighted because of a slight under-performance (i.e. ROT = +11MW):
(B2) Ararat Wind Farm in VIC
The ARWF1 is highlighted because of a significant under-performance (i.e. ROT = +55MW):
We see here that the unit appears to have missed its start signal unexpectedly, for some reason (remaining down around 0MW instead of following its target to 58MW). There’s a few things going on in this dispatch interval and surrounding ones (and there are two other units that ‘fail to start’) so we will try to look a bit deeper in a minute…
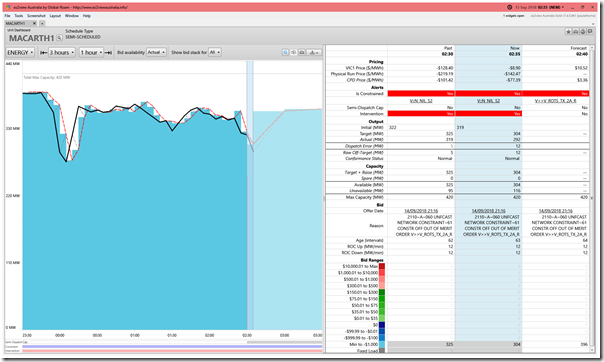
(B3) Macarthur Wind Farm in VIC
The MACARTH1 is softly highlighted because of a slight under-performance (i.e. ROT = +12MW):
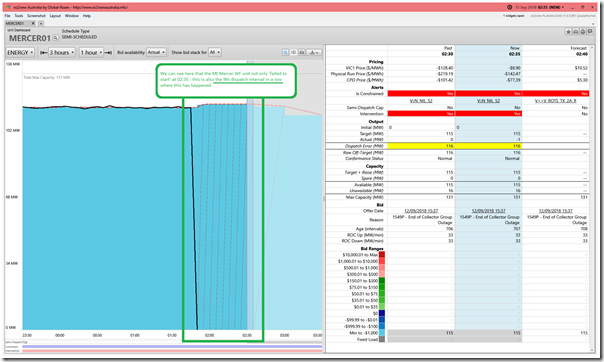
(B4) Mt Mercer Wind Farm in VIC
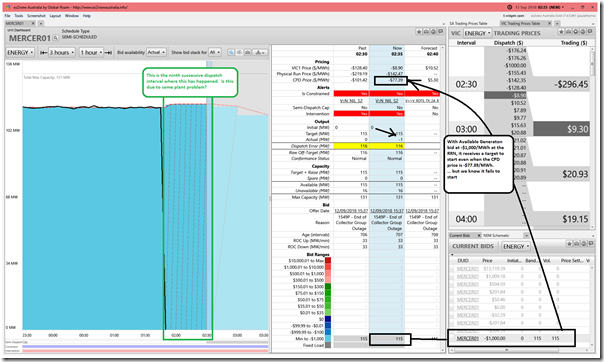
The MERCER01 is highlighted because of a large under-performance (i.e. ROT = +106MW):
As highlighted in this snapshot, this is the 9th dispatch interval in a row where the unit has ‘failed to start’ for some reason (in the 02:35 dispatch interval, it remained down at 0MW instead of following its target to 115MW).
We’ll come back and look at this one, at the same time as we look at ARWF1.
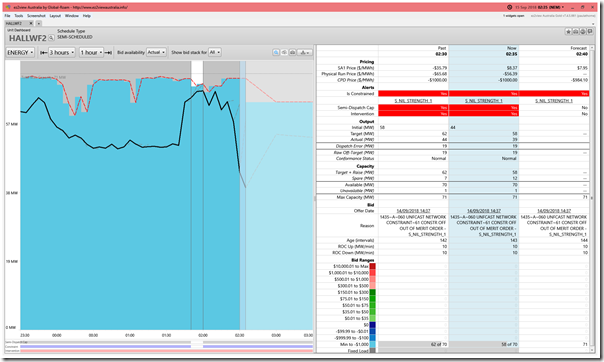
(B5) Hallett 2 Wind Farm in SA
The HALLWF2 is softly highlighted because of a slight under-performance (i.e. ROT = +19MW):
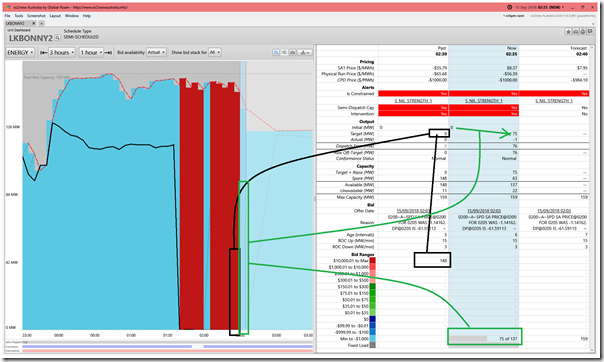
(B6) Lake Bonney 2 Wind Farm in SA
The LKBONNY2 is highlighted because of a significant under-performance (i.e. ROT = +76MW):
As was the case with ARWF1 and MERCER01, this unit also appears to have missed its start signal unexpectedly, for some reason (remaining down around 0MW instead of following its target to 75MW). In this case, the situation seems similar to what happened at 02:05 (which was also the first dispatch interval in a trading period).
Like with ARWF1 and MERCER01 there are a number of things that are worth exploring further below we’ll explore this further below…
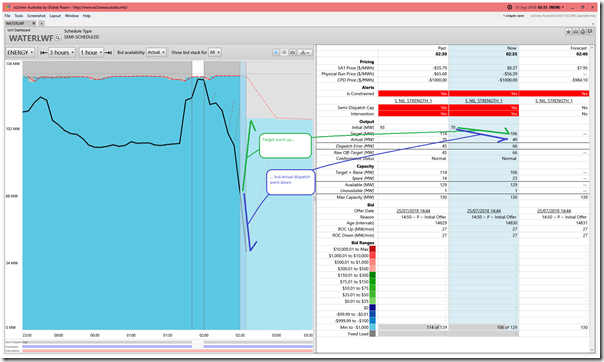
(B7) Waterloo Wind Farm in SA
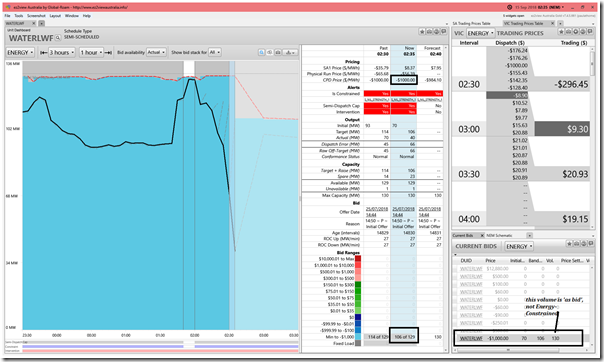
The WATERLWF1 is highlighted because of a significant under-performance (i.e. ROT = +66MW):
This case, we see, is a similar ‘went the wrong way’ situation to that which we saw in HALLWF2 above (though in the case of WATERLWF1 the deviation is larger in this dispatch interval):
1) This unit was operational (at 70MW) and dispatched to increase to 106MW; however
2) Fell in the opposite direction (70MW to 40MW);
3) Which meant a net difference (i.e. Raw Off-Target) of +66MW (i.e. 106MW-40MW of imbalance in the NEMDE dispatch solution for 02:35).
We’ll look at this one further below…
(C) Two different types of large imbalance
As we see above, there seem to be two different types of imbalance across 5 DUIDs in particular. In this section we’ll explore these two different types of imbalance on units where the imbalance was largest ….
(C1) Three important market conditions
… however let’s first flag three important market conditions which were evident in the snapshots above.
(C1a) Low, and Negative Prices
Let’s be conscious, for a moment, that the immediate trigger for us to invest so much time in exploring these Case Studies was the release of the AER Issues Paper – which focuses significantly on cases that have been identified where DUIDs deliberately withdraw capacity without first rebidding when prices are significantly negative:
1) As noted in Paradigm 3 here, it seems that this behaviour is technically allowed in the Rules, despite the fact that a number of different stakeholders view it as ‘poor form’.
2) To me it seems unsustainable practice, that definitely won’t scale as the installed capacity of Semi-Scheduled plant continue to grow.
I could not help but notice that low and negative prices were a feature of the VIC and SA regions in the snapshots above, so thought I would
1) What did the price outcome actually end up being?
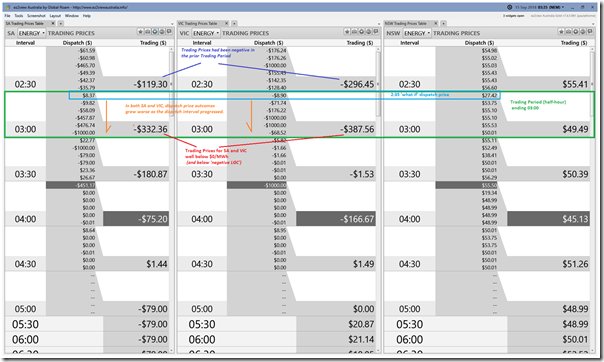
Let’s start by looking at what the price outcome actually was for the 03:00 Trading Period … whilst being very cognisant that this outcome was not known (or even certain) at the point of the 02:35 dispatch interval (the one in question). In the following snapshot taken from ez2view with the Time Travel setting wound 60 minutes ahead to be 03:35 in order to be able to look back on what the Trading Prices actually turned out to be.
We see that the Trading Prices for both VIC and SA were significantly negative – well below ‘negative LGC’ – for the half-hour ending 03:00. Looking at the price outcomes here (after the fact), and those for the prior trading period in both VIC and SA, one might conclude that pricing conditions were such that those operators adhering to Paradigm 2, and for whom they are exposed to ‘paying to generate’ would take the approach that’s the focus of the AER Issues Paper.
2) But what was actually visible at the time?
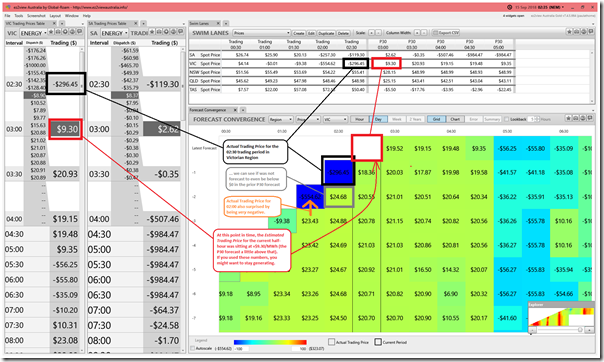
However reality at the time was more complex, as the 02:35 dispatch interval was only at the start of a Trading Period which ended up being negative. sing the following window in ez2view Time-Travelled to 02:35 (i.e. the dispatch interval in question) we see that, at that time, the expectation was that the Trading Price for 03:00 would end up at something which was actually slightly positive … if you believed the AEMO’s forecasts at the time:
The ‘if you believed the AEMO’s forecasts’ is obviously the key, here – as they did have form in being overly optimistic, with both 02:30 and 02:00 heading south after initially being rosier.
———–
We’d ask readers to consciously keep all this in mind in seeking to understand the extent to which this behaviour contributed to the aggregate imbalance at 02:35 on Saturday 15th September 2018. In doing so, however, it’s important to remain cognisant that it’s impossible for us to know someone else’s motivation, though that does not stop us trying!
(C1b) Market Intervention
Further complicating matters, we also see that (flagged in the ‘Unit Dashboard’ widget in ez2view) this Dispatch Interval was one where the AEMO intervened in the market.
When the market does not present a feasible solution, taking into account all the criteria that needs to be met, the AEMO is able to intervene in the market under provisions of the NEM Rules.
For instance, from 2017 there was a marked increase in dispatch intervals seeing Market Intervention for the purpose of ensuring sufficient System Strength in the South Australian region, and in the Victorian region. This was explored in our Generator Report Card 2018. The number of dispatch intervals subject to intervention has reduced somewhat from the peak of CAL 2018, but is still quite elevated compared to the early years of the NEM.
When AEMO intervenes, a number of provisions come into play – one of which being that there are two different runs made with NEMDE, which are for different purposes:
1) The first run (which occurs all the time) does not, in the case of market intervention, reflect physically what’s happening in the system – but does produce the prices that are used to settle the market (so it’s sometimes called the ‘what if?’ pricing run); whereas
2) A second run is done, after first setting as fixed the Targets of whomever has been directed by AEMO as part of this intervention, in order to dispatch the rest of the fleet in as ‘least cost’ manner as possible – notwithstanding the intervention. This second run is used to set dispatch targets for all plant.
Market Intervention is one reason why the CPD Price for units will be different from the Dispatch Price for a region….
(C1c) Constraints Bound
… and this particular Dispatch Interval also features the other reason why the Connection Point Dispatch (CPD) Price will be different, which is because the unit is subject to bound transmission constraints.
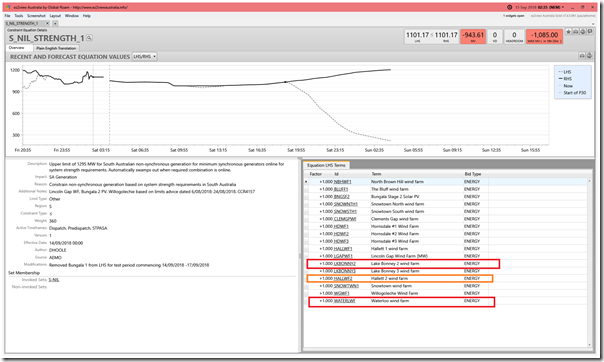
1) In South Australia it was the ‘S_NIL_STRENGTH_1’ constraint:
This is one form of the prevalent System Strength constraint that quite frequently binds.
It affects all 3 of the DUIDs flagged (indeed most of the Semi-Scheduled units in the region):
Because this constraint equation wants to reduce the output from the three units highlighted (amongst others), the fact that these three units underperformed might have been seen as inadvertently beneficial (just focusing narrowly on this particular constraint equation).
2) In Victoria it was the ‘V::N_NIL_S2’ constraint:
This also affected all 3 DUIDs flagged there.
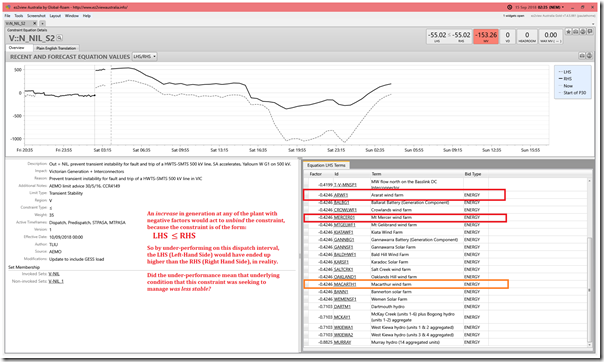
This constraint is intended to ‘prevent transient instability for fault and trip of a HWTS-SMTS 500 kV line, SA accelerates, Yallourn W G1 on 500 kV’. What’s important to note, when we look at the ‘Constraint Equation Details’ widget in ez2view focused on this particular constraint is that the 3 x DUIDs flagged all have negative factors:
In contrast to the situation in South Australia, the under-performance of the three units highlighted could perhaps have meant that the security the constraint equation was trying to deliver to ‘prevent transient instability …’ was not actually delivered in this case because of the underperformance of these three units … assuming all other elements delivered what they were asked.
—————
So keep these three factors in mind when walking through the two modes of imbalance below.
(C2) Type 1 = the ‘went the wrong direction’ outcome
This applied both to HALLWF2 (+19MW) and WATERLWF1 (+66MW). It also applied to WRWF1 (+11MW) but that deviation is even smaller, so not explored.
(C2a) HALLWF2 ‘went the wrong direction’ (+19MW)
Ordinarily (given the number of Case Studies to explore) I might not spend much time on this, as the deviation was only +19MW. However curiosity got the better of me for a few reasons (e.g. WATERLWF also saw the same outcome, though larger + also the HALLWF2 deviation is larger in the subsequent periods – see below) so I’ve invested a bot more time here…
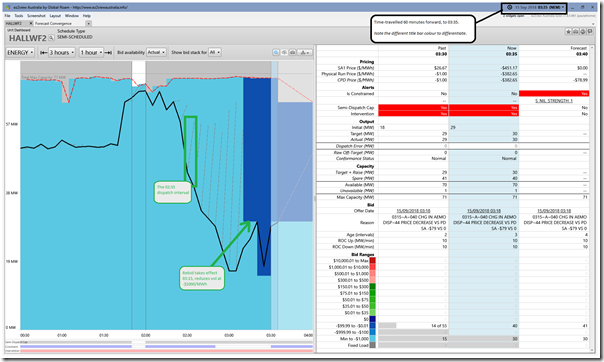
Firstly I wound forward the clock by 60 minutes to 03:35 and see that this type of gap persisted and grew for the next 7 dispatch intervals, and was only corrected with a rebid which first took effect in the 03:15 dispatch interval:
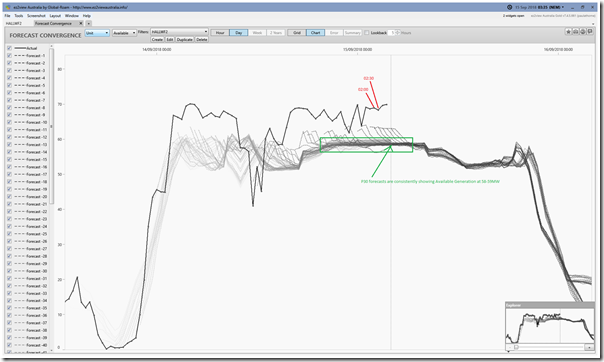
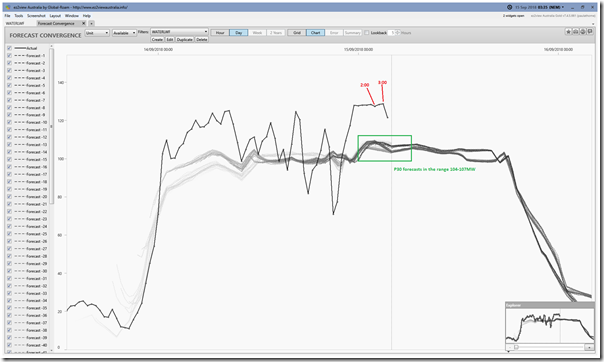
Flipping to the ‘Forecast Convergence’ widget for HALLWF2 (still one hour later, at 03:35) showing Available Generation we see that the unit was very consistently forecast to have (energy-constrained) Available Generation capacity of at least 58MW (i.e. there’s no prediction shown in these forecasts that the output would drop down to a low point of only 16MW by 03:00):
I’d need to learn more about the AWEFS process for Wind Farms to understand what’s actually going on here!
(C2b) WATERLWF ‘went the wrong direction’ (+66MW)
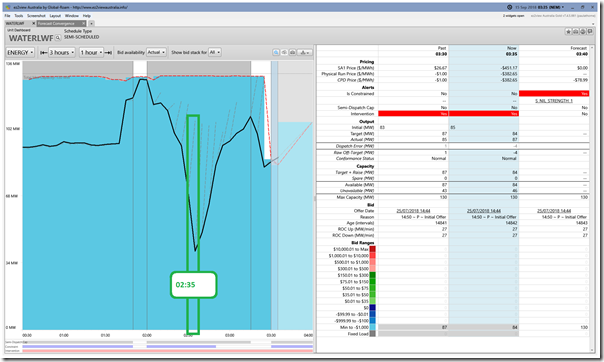
The Waterloo Wind Farm saw the same type of outcome – just larger. Keeping the clock wound forward 60 minutes (to 03:35) we see that this ‘went the wrong way’ outcome was largest at 02:35 and:
1) It had been occurring since 02:20; but that
2) that the unit began to climb in output from 02:40 – but at a much slower pace than the Dispatch Target was implying:
Also showing (energy-constrained) Available Generation for WATERLWF in this (60-minutes ahead) dispatch interval shows a similar picture to HALLWF2:
At no point does the P30 forecast suggest that there would be an energy constraint (i.e. lack of wind) which would reduce the output down as low as 40MW. Hence I conclude that either the model was wrong in some way, or the reduction in output occurred for some other reason.
Looking back at 02:35 (note the pink colour on the title bar, indicating back to the Case Study interval) we see that the System Strength constraint drove the CPD Price down to –$1,000/MWh for the unit. Think of the CPD Price as the ‘price to be at, or below, (at the RRN) for the unit be dispatched’. In this case, the unit had all of its volume offered down at –$1000/MWh so was dispatched for some, but not all, of its volume.
As noted, it delivered even less.
——
If there are readers out there who can help us all understand better what might have been going on here, I’d be very appreciative if you could let us know please (one-on-one, or in public comments below)!
(C3) Type 2 = the ‘totally failed to start’ outcome
This applied to each of ARWF (+55MW) and MERCER01 (+116MW) and LKBONNY2 (+76MW), which adds up to a significant imbalance across VIC+ SA.
Hence it seems important to understand why this happened at three separate units, operated by three separate organisations!
(C3a) ARWF1 ‘failed to start’ (+55MW)
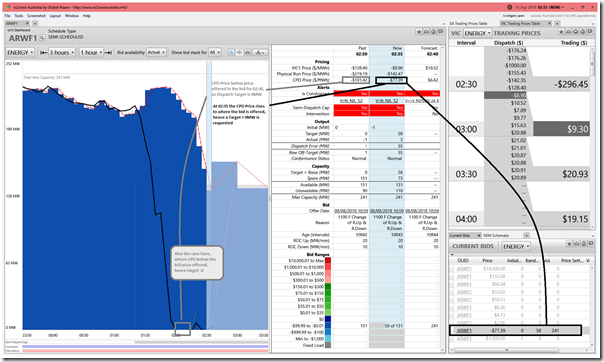
Being in VIC, we need to remember that the constraint equation which was bound actually wanted more of the output of ARWF1 in order to help make the LHS of the constraint less than or equal to the RHS… and remember that the purpose of the constraint was to ‘prevent transient instability …’. With this in mind, let’s have another look at what we can see at 02:35:
On the snapshot:
1) I have annotated how the 2:05, 2:10 and 2:15 dispatch intervals also saw dispatch target down at 0MW because the CPD Price was down below where ARWF had offered its volume in its bid (i.e. –$77.39/MWh at the RRN).
2) Yet we also see a slight blip in output at 02:20 where:
Step 1 = the CPD Price rose to –$77.39/MWh
Step 2 = a dispatch target was set at 18MW; and
Step 3 = ARWF was (somewhat) able to follow – but only to 6MW.
… This is one point of evidence evidence suggests to me that the ARWF1 was not following Paradigm 2, but instead that the Raw Off-Target at 02:35 might have been due to some physical condition.
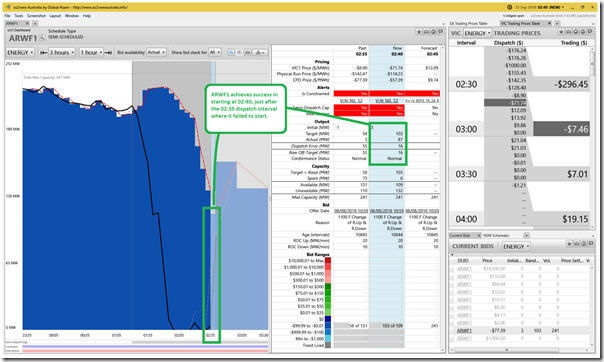
3) Additionally, in the following snapshot we step forward in Time-Travel five minutes to 02:40 and see that, in this instance:
(a) The dispatch price had dropped further and the Estimated Trading Price for the current half hour had dropped below zero;
(b) Yet on this occasion the unit was able to follow its dispatch instructions to a large degree (i.e. Target of 103MW and FinalMW of 87MW):
… This reinforces my sense that this unit was happy to run at negative prices, and that the ‘failed to start’ at 02:35 was probably for some technical reason that is unknown to me at this point. If you can add more, feel free to add a comment below?
(C3b) MERCER01 ‘failed to start’ (+116MW)
Also in Victoria, we saw that Mt Mercer Wind Farm failed to start – let’s take a look at what was visible at the time:
As noted here, for reasons unknown this ‘failed to start’ had repeated for 9 straight dispatch intervals. There was no rebid that might have provided some information about what was going on – thought we need to keep in mind that it is 02:35 in the morning and that:
1) If there were problems onsite, they probably does not have personnel available at the time; and
2) They may well not have had any personnel available at that time to rebid, either.
Hence it is not possible to ascertain, given the data we have access to at this point, which of the following applied:
Possibility 1 = whether the unit was having technical issues in responding to AEMO’s start signal in its Dispatch Target; or alternatively
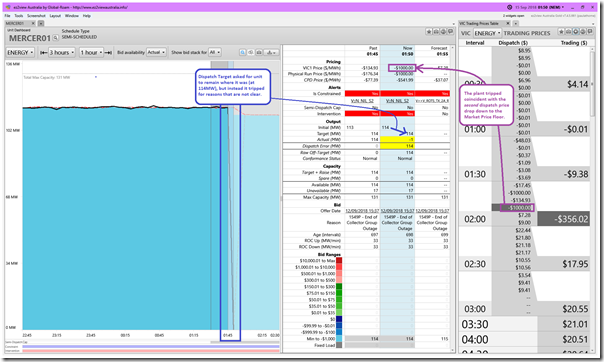
Possibility 2 = whether it was a conscious choice (under Paradigm 2,) not to operate when prices were negative due to the bid. Something that suggests that might be the scenario is that the initial trip of the unit (at 01:50) had coincided with the first trading period where the Trading Price had sunk to quite low levels, as seen in this snapshot from 01:50:
… though (as noted on the snapshot) this was the second time the dispatch price had dropped to –$1,000/MWh in the dispatch interval. So it’s far from confirmed that ‘Possibility 2’ is what happened.
Possibility 3 = there may be other possibilities as well?
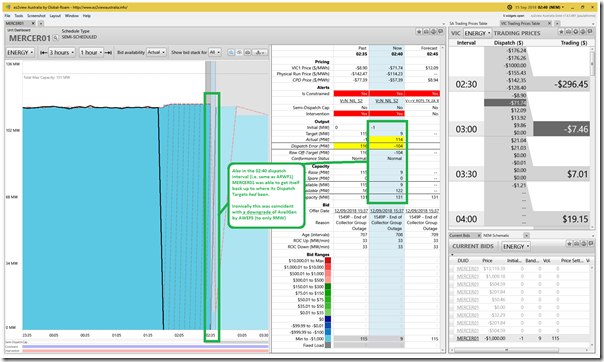
However if we wind the window through to look at 02:40 (i.e. just 5 minutes after the focused dispatch interval) we see that the unit was able to get itself back up online:
We note that this occurred when the price was still quite negative, which suggests that Possibility 1 is more likely than Possibility 2. Ironically this happened coincident with AWEFS reducing its assumption of (energy-constrained) Available Generation – we know this did not come from a rebid. So whilst the actual output rose sharply, the Target dropped just as sharply – meaning that in the 02:40 dispatch interval, the MERCER01 unit was substantially over-performing.
If any reader can help me understand more about this chain of events, I’m all ears (and do apologise for any mistakes made in interpretation)!
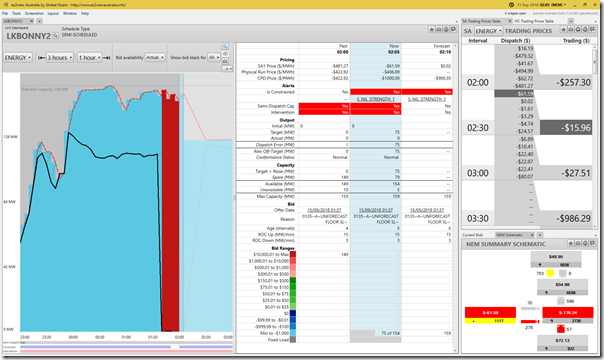
(C3c) LKBONNY2 ‘failed to start’ (+76MW)
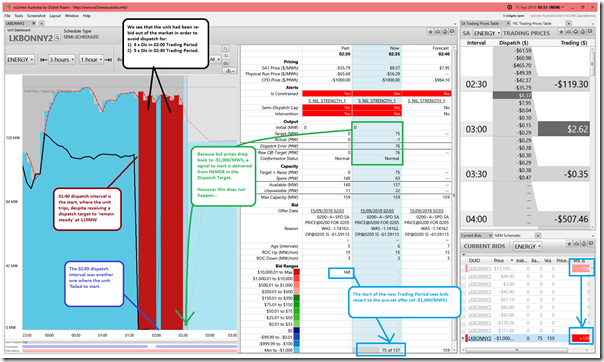
Finally let’s look at the third unit which ‘failed to start’ – Lake Bonney 2 Wind Farm in South Australia:
Because it’s a new Trading Period (and because recent rebids had just been for the prior Trading Period) the bids revert to volume down at –$1,000/MWh. What appears to happen is that:
Step 1 = the unit is given a Target to rise back up to 75MW; but
Step 2 = however the unit fails to start:
(a) Which I am inferring might be for technical reasons;
(b) However I am also inferring (from behaviour on 24th July 2018, from behaviour an hour before, and what’s to come in 15 minutes) that the operator won’t be too disappointed the unit failed to start here;
(c) Hence the +76MW Raw Off-Target result.
1) What do I mean about ‘recent prior behaviour’ at LKBONNY2?
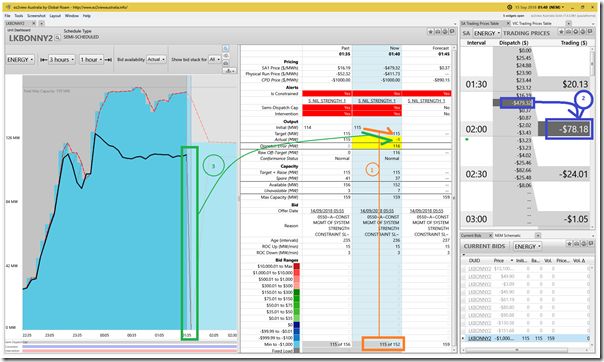
Let’s start back at 01:40 when this whole event starts to unfold for LKBONNY2:
Let’s walk through sequentially what we can see in the above:
Step 0 = Prior to this dispatch interval, prices had been positive in the South Australian region.
(a) The ‘S_NIL_STRENGTH_1’ constraint is bound, as it has been for quite some time;
(b) This seeks to wind back the output of many Semi-Scheduled plant in South Australia – and so evokes a ‘race to the bottom’ bidding behaviour war;
(c) Bids need to be down at –$1,000/MWh (because the CPD Price is also that low) in order to be sure of some dispatch (albeit reduced, because everyone else is also bidding down there);
(d) But when prices are positive, it’s all happy days.
Step 1 =The 01:40 dispatch interval kicks over, and the LKBONNY2 unit receives a ‘stay at 115MW’ Dispatch Target because of where it bids;
Step 2 = Unfortunately, for reasons we won’t explore here (incl reduced demand), the price does drop below 0MW;
Step 3 = In what’s a pretty clear demonstration of an operator operating under Paradigm 2, the station is tripped to 0MW despite the ‘stay at 115MW’ inference that others operating under Paradigm 1 might make.
This is sense of ‘operating under Paradigm 2’ is reinforced when we see that a rebid is made for 01:45 (received at AEMO at 01:37) to back plant out, up to the Market Price Cap and hence receive a dispatch target of 0MW:
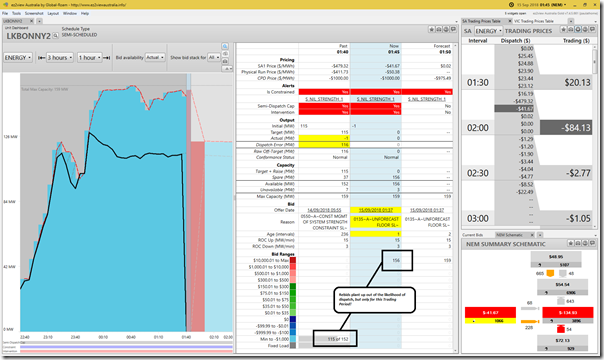
Because that rebid is only for the 02:00 Trading Period:
1) bids revert to –$1,000/MWh at 02:05;
2) the unit receives a target;
3) the unit ‘fails to start’ (is this for technical reasons, or do they make a decision not to start it?)
We know that the 2nd rebid takes effect for 02:10 for 5 dispatch intervals, and then ‘rinse and repeat’ for 02:35.
2) What do I mean about ‘what’s to come’ at LKBONNY2?
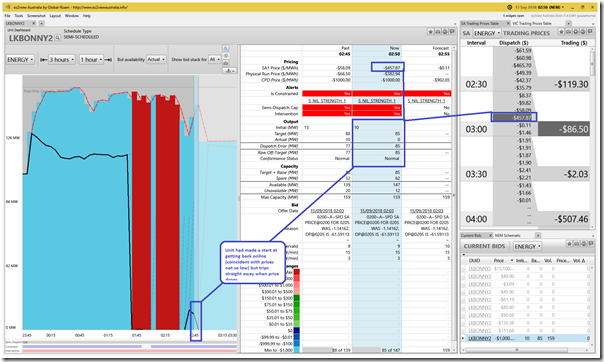
Last snapshot in this article is this looking at 02:50:
We see that the unit had actually managed to get off the ground in the 02:40 and 02:45 dispatch interval (which suggests that it might have been trying at 02:35) – but we also see that the unit (automatically?) trips in the 02:50 dispatch interval, coincident with the dispatch price dropping quite low. It would be an extraordinary coincidence to think that this trip at 02:50 and the trip 70 minutes later (at 01:40) were not related to the price having dropped quite low in those particular dispatch intervals. Paradigm 2 at work?
Once again, if any reader can help me understand more about this chain of events, I’m all ears (and do apologise for any mistakes made in interpretation)!
———–
That’s all I have time for with respect to this particular dispatch interval. Let’s hope that the 12th Case Study in this series is simpler than this one…
… and remember, if you know of people who can help us delve into details like this please let us know!


 const
const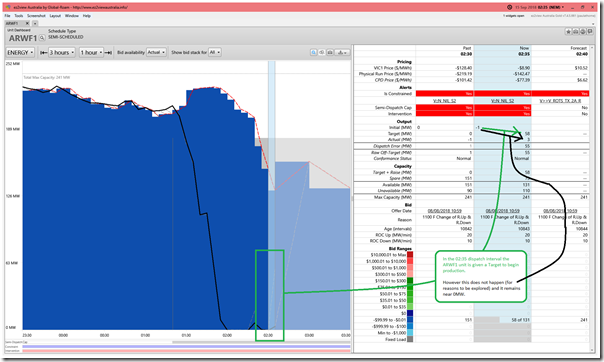
Leave a comment