In the past two weeks, I’ve posted about two high-profile publications by others that ask questions about how NEM 2.0 should work:
1) On Monday 20th April, the COAG Energy Council published two papers, and is calling for submissions by Monday 18th May 2020 (now under 2 weeks away) with respect to one of those (their paper on ‘Moving to a two-sided market’).
2) Last week on Thursday 30th April the AEMO released its ‘Renewable Integration Study’ papers. Obviously the challenges inherent in integrating large volumes of intermittent renewable energy supplies into the NEM – which cover technical, commercial and regulatory dimensions – will be a core part of developing a NEM 2.0 that will actually work.
We’ve been giving some thought to what ‘NEM 2.0’ might look like – for a number of reasons, including these:
Reason 1 = first and foremost, the major changes that will surely be a part of NEM 2.0 will have significant implications for most of our clients no matter which type of client they are:
1a) They might be direct wholesale market participants; or
1b) They might be large energy users participating indirectly; or
1c) They might be indirect stakeholders in what’s happening in the wholesale market, because the wholesale participants are those they serve.
Reason 2 = We’re also thinking more of challenges like these as we begin the initial processes of mapping out what an update to the 180-page analytical component in our popular Generator Report Card 2018 (which might be released early 2020 – will see how we go).
As time permits I envisage sharing some thoughts here on WattClarity over various articles, including with this one* today.
* With respect to this article today, please understand that I’ve not had time yet to do more than skim the papers referenced above. Hence readers should keep this in mind in reading my comments below.
.
(A) Considerations on the Demand Side of the Two-Sided Market
Given the discussions surrounding the AEMC’s latest draft of rules that would enable a ‘Negawatt Dispatch Mechanism’ (including my comments on 5th March 2019 and comments on 21st October 2019 {specifically discussing a two-sided market}) it would be understandable if some readers were to conclude that our thoughts might be focused on how to help the demand side of the balance really participate actively in the market.
To the extent that time permits, I do envisage sharing further thoughts in a future article….
Future Article about how to make the Demand Side work, in the coming Two-Sided Market
When I have posted that article in the coming weeks, I will link it in here (if I remember).
.
(B) Considerations on the Supply Side of the Two-Sided Market
… however to start with I wanted to share with you some thoughts on the supply side – referring back to analysis included in the Generator Report Card 2018 (the GRC2018), and also to statistics compiled on a DUID-level basis for every dispatch interval through calendar 2019 in the follow-on Generator Statistical Digest 2019 (the GSD2019).
(B1) Background context
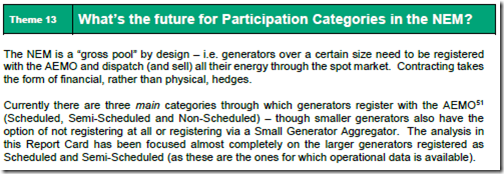
In the 180-page analytical component that formed one of the two core pieces of value in the GRC2018, we included some discussion about the Semi-Scheduled category in Theme 13 within Part 2, and titled it ‘What’s next, for participation categories in the NEM?’:
The GRC2018 was released on 31st May 2019, but even a year ago we authors were giving considerable thought to various challenges that a ‘NEM 2.0’ design would need to address such that the energy transition could continue as many are hoping. Amongst other things:
1) We wondered whether the way the Semi-Scheduled category* operates is scalable, and sustainable; or
Brief note about the Semi-Scheduled category
In the Glossary part of the WattClarity site we are progressively fleshing out a longer layperson’s explanation of the Semi-Scheduled category.
In simple terms, a Semi-Scheduled generator is not required, under the rules, to pay any attention to the Dispatch Target the AEMO publishes for the unit in every dispatch interval, except in a relatively small number of dispatch intervals in which they are either:
(a) Constrained down; or
(b) Dispatched down.
Note that this ‘ignoring of Target’ is not entirely costless to the Semi-Scheduled plant, however.
* for those towards either extreme of the Emotion-o-meter please listen carefully, and understand that this is not a statement about the fuel source itself (i.e. wind and solar), but is rather about a sustainable and scalable way for these plant to be enabled to operate in the NEM, to the benefit of all.
2) Whether there were major reforms needed to the way that it worked; or
3) For it to be abandoned entirely and revert back to an arrangement where all but the smallest of plant are required to be fully Scheduled.
Since the release of the GRC2018 we have continued to ponder questions like these – and this thinking has been given new impetus by recent small signs of progress towards NEM 2.0.
———
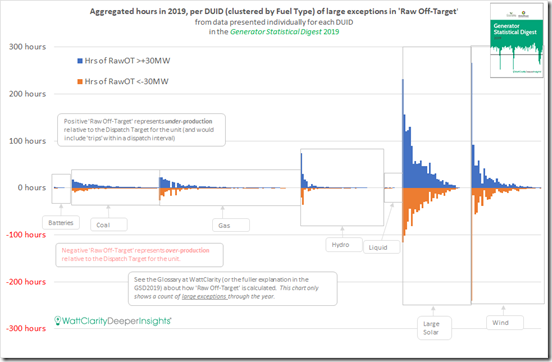
On 28th January 2020, in conjunction with the release of the GSD2019, I posted this article ‘Review of extremes in Raw Off Target performance through 2019, with the Generator Statistical Digest 2019’ which included the following chart:
In the chart, I have shown two data points for each of the 269 DUIDs that were either Scheduled or Semi-Scheduled in 2019 (we can’t calculate this for Non-Scheduled units):
ABOVE the line I have shown the number of hours the DUID was assessed as having Raw Off-Target >+30MW*.
Units with positive Raw Off-Target are under-producing compared with AEMO’s expectation for their output (noted in the target) – this would include trips.
BELOW the line, I have shown the number of hours (shown negative to differentiate) where the DUID was assessed as having Raw Off-Target <-30MW*.
Units with negative Raw Off-Target are over-producing.
These numbers should not be confused with ‘Conformance Status’ which is assessed by AEMO using Raw Off-Target as an input, but also other factors taken into consideration.
* Why Choose 30MW as a Threshold for this Statistic?
If you asked that question, it’s a good one (as it is somewhat based on subjective judgement)!
We chose 30MW as a threshold for materiality as this was the threshold at which the NEM has operated for more than 20 years: i.e. above which generation plant were required to be fully scheduled by the AEMO, except in specific circumstances. Hence setting 30MW as the criteria for filtering ‘Raw off-Target‘ means that the excesses loosely represent the effect of an invisible generator on the system not registering as Scheduled in the NEMDE supply and demand balancing equation.
As alternatives we might have chosen 6MW (a measure feeding into ‘Non-Conformance‘ logic), or we might have chosen 5MW (more recently set as the threshold above which batteries need to be fully Scheduled). But those measures seemed too conservative/extreme for measuring ‘worst’, when the intent was to highlight those having most significant effects on balancing supply and demand.
You can see below the effect that results when we choose a higher threshold – say 100MW.
.
(B2) What is ‘Raw Off-Target’?
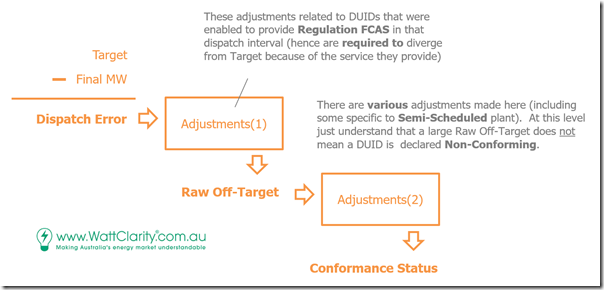
Because we are referring to this metric increasingly in different forums (including in our ez2view software) we have put together this Glossary description of what we mean by ‘Raw Off-Target’ and included a rough chronological record of its use as well.
As illustrated here, an extreme result for Raw Off-Target is not necessarily synonymous with being declared as ‘Non-Conforming’ by the AEMO (this is especially the case for Semi-Scheduled plant under the current requirements for those particular plant).
However readers need to understand that, when extreme levels of Raw Off-Target are experienced, this represents a dispatch interval where the NEMDE Supply = Demand balance equation does not balance, and there is a cost that the market incurs* for the imbalance – which is passed onto Energy Users (directly, and indirectly).
* Note, that some readers might point out that the ‘cost’ could be viewed as being incurred in expectation of the imbalance (i.e. through enablement of FCAS services in advance of – and in expectation of – them being triggered).
This data can be analysed in a number of different ways, each for different purposes…
(B2a) Unbundled, per DUID
When reviewed on an individual DUID basis, or compared between DUIDs (as provided for in the GSD2019, for instance), it can help shed light on assets that perform better than others. In January’s analysis:
(a) I grouped results for all fuel types together, and
(b) sorted each fuel-type group in descending order of total hours of large excess in either direction.
(c) I then identified what I termed the ‘Worst Performers’ (for Coal, Gas, Hydro, Large Solar and Wind) using that metric, and promised to delve into these at some later point in time (though not today!).
When time permits, we will return to these (individual DUID) results to see what else we can learn:
Case Studies, still to come, looking at individual DUIDs.
Given time constraints, I will probably only have time to delve into details for one DUID at a time, hence would link them here later:
1) Further consideration of derived Raw Off-Target performance for Macarthur Wind Farm, and wind farms more broadly
2) Further consideration of derived Raw Off-Target performance for Daydream Solar Farm, and solar farms more broadly
3) Further consideration of derived Raw Off-Target performance for Vales Point unit 5, and coal-fired plant more broadly
4) Further consideration of derived Raw Off-Target performance for Darling Downs CCGT, and gas-fired plant more broadly
5) Further consideration of derived Raw Off-Target performance for Shoalhaven pump, and hydro plant more broadly
For today, I’d rather look at the data a different way…
(B2b) Aggregating results for DUIDs … by Fuel Type
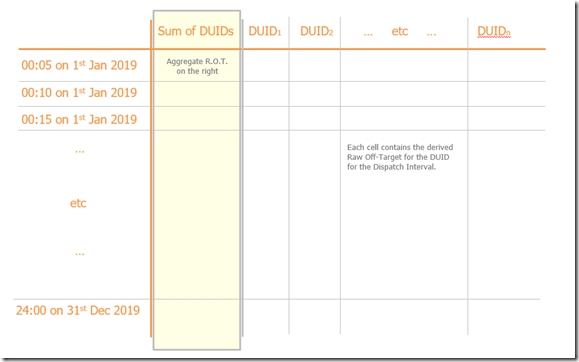
… One different way of looking at this data is to aggregate across a group of DUIDs for a given Dispatch Interval to calculate an aggregate Raw Off-Target value for a group of DUIDs:
There could be several different dimensions under which it is aggregated – for example, it could be aggreged by Region, by Portfolio*, or by Fuel Type.
* each dimension of aggregation can be informative, in their own ways. For instance, for the purpose of allocating FCAS Regulation costs via the ‘Causer Pays’ mechanism, there is an element of aggregating deviations on a 4-second basis across DUIDs within a given Registered Participant.
For the purpose of considering implications (and limitations) of the way the Semi-Scheduled category currently operates, with respect to how it needs to improve for NEM 2.0 to be a success, I have focused on aggregating by Fuel Type in this article.
(B3) ‘Raw Off-Target’ aggregated by Fuel Type
To make this analysis simpler, I focus only on ‘all wind farms’ (as an example of Semi-Scheduled plant) and on ‘all coal units’ (as an example of Scheduled plant). It seemed better to start with wind farms because of the 24-hour operational pattern for them, as distinct from the possible added complications of also dealing with the ‘daylight hours’ limitations of solar plant – and also the presumably greater impact in 2019 of having more solar farms being commissioned.
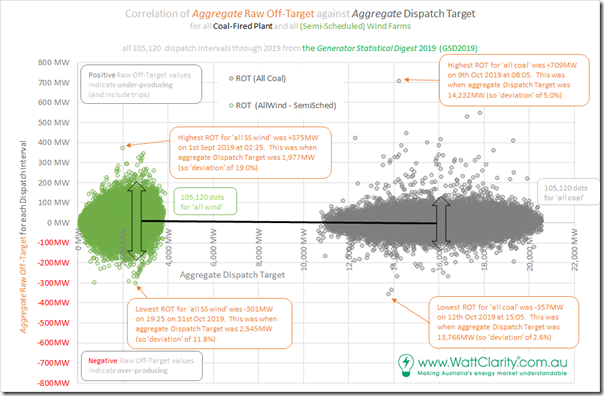
Results for aggregate Raw Off-Target for Wind, and for Coal, are shown in the following chart – correlated against the aggregated Dispatch Target for those same sets of units. Results are shown for all dispatch intervals through CAL 2019 using the data derived in the process of completing the GSD2019:
(a) Hence there are 210,240 data points plotted below;
(b) We need to keep in mind that the aggregation for Wind cannot include the smaller Non-Scheduled plant (as they do not receive Dispatch Targets, hence operate invisibly).
There’s a few high level observations that can be made, and questions that can be asked:
Observation 1) Firstly, it’s clear that the aggregate dispatch target for coal is consistently several times as large as the dispatch target for wind (at the extreme 10 times as large).
Observation 2) Coal flexes over a broader horizontal axis range (i.e. from just above 10,000MW to over 20,000MW dispatch target):
2a) This is partly just a visual effect, given the larger installed capacity; but
2b) It’s also partly due to the relative position in the bid stack (i.e. with coal volumes above ‘must run’ priced above $0/MWh and so above much of the wind volume in the NEM currently)
Observation 3) It takes reference to numbers not in the image to reinforce that the aggregate Dispatch Target for wind is never at 100% utilisation – there is always some capacity that’s not generating:
3a) At the end of December 2019 the aggregate Maximum Capacity of all Semi-Scheduled wind farms in the NEM was sitting at 5,590MW.
3b) We can see in the chart that the highest instantaneous aggregate Dispatch Target through the whole of the year was just under 4,000MW.
3c) Without factoring in the timing of these peaks in output (which may well have been , we might surmise that a ball-park for the peak instantaneous capacity factor was 72% (i.e. 4,000MW / 5,590MW).
Observation 4) Both ‘all coal’ and ‘all wind’ show some extreme events that are outside of the main ‘clump’ of dots spread evenly across the y-axis. The ‘worst’ of these have been identified down the specific dispatch intervals:
| . | Aggregating All SS Wind 39 units |
Aggregating All Coal 48 units |
| Under-Performance (including trips) Aggregate Raw Off-Target >> 0MW |
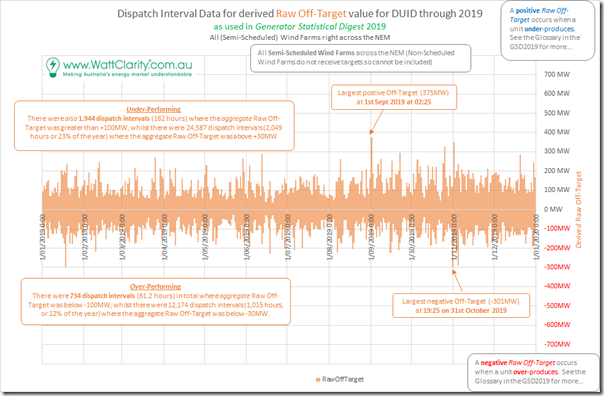
The worst dispatch interval for wind was 02:25 on 1st September 2019. This will be discussed in a Case Study here. On this occasion, the ‘all wind’ group saw an aggregate Raw Off-Target was +375MW. Several other things that could be noted: |
The worst dispatch interval for coal was 08:05 on 9th October 2019. This will be discussed in a Case Study here. On this instance, the ‘all coal’ group saw an aggregate Raw Off-Target as high as +709MW: |
| Over-Performance Raw Off-Target << 0MW |
The worst dispatch interval for wind (-301MW) was 19:25 on 31st October 2019. This will be discussed in a Case Study here. In this instance: |
The worst dispatch interval for coal was 15:05 on 12th October 2019. This will be discussed in a Case Study here. This was just 3 days after the worst outcome at the opposite extreme! |
Observation 5) Excluding the relatively small (though still significant) number of outlier results for both coal and wind, it’s clear that the y-axis spread of the main blob of results for wind is much wider than the vertical spread of results for all coal.
5a) For ‘all coal’ we can clearly see that the majority of the results are bounded from an aggregate Raw Off-Target level of just above +100MW to just below –100MW.
5b) For ‘all wind’, however, this spread of the majority of the results is at least 100MW wider from one side to the other.
Observation – or Hypothesis – 6) What’s even more of interest is what happens to the this y-axis spread for wind, as the energy transition progresses!
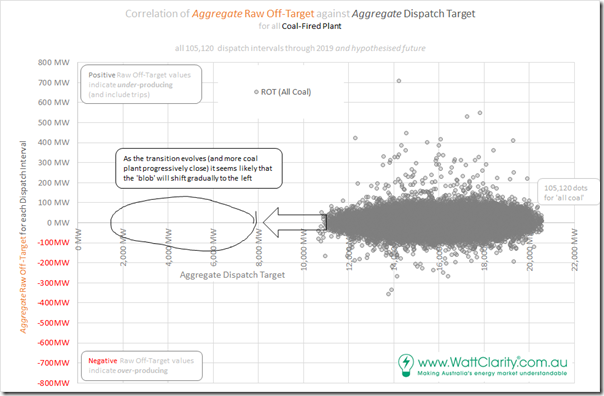
6a) As coal plant progressively close that ‘the blob’ will progress to the left as shown:
… what’s not known at this point (and open to subjective guesstimations) is what will happen to the vertical spread of the blob for ‘all coal’ as the number of units drop?
Thought 1 = on the one hand, one might hypothesise that the increased cycling demand for the remaining coal units would lead to higher dispatch error;
Thought 2 = however that might be counter-acted by the fact that coal units (already do, and) will continue to have a clear incentive to remain on target – through the Conformance Processes (for which they have invested to build internal capability over the years)
Thought 3 = however it’s also worth noting that a number of coal units are already cycling extensively (refer to the ‘B Pages’ in your copies of the GSD2019 to see clear pictures of which ones).
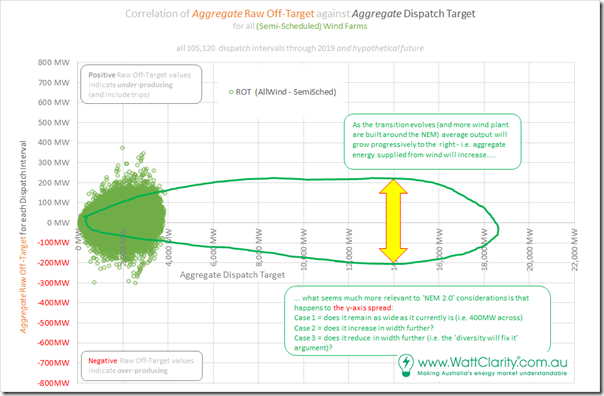
6b) In contrast, the ‘all wind’ group will evolve differently, as we have already seen (identified in the lack of anti-correlation in Theme 10 within Part 2 of the GRC2018) that there will always be some instances anchored at quite low levels of aggregate ‘all wind’ output.
… as highlighted on the image, there seems to be quite an important question to be considered in relation to the design of ‘NEM 2.0’ and that is what is going to happen to the y-axis spread?
Possible Case 1 = does the spread of the ‘bulk blob’ (about 400MW across for aggregate Dispatch Target no greater than 4,000MW) remain the same width?
Possible Case 2 = does the spread of the ‘bulk blob’ grow further, as the aggregate Dispatch Target shifts up to the right:
(i) If this happens, then it seems logical that the costs of balancing the NEM will increase as a result;
(ii) Given the way that the Semi-Scheduled category currently works, my sense is that there is a non-trivial risk that this will be the outcome.
Possible Case 3 = does the spread of the ‘bulk blob’ decrease:
(i) even if the Semi-Scheduled category is not improved,…
(ii) as a result of some form of growing diversity effect?
(iii) I fear that this is not going to happen, unless the Semi-Scheduled operations methodology is majorly improved;
(iv) Especially with growing aggregate size of discrete wind farms (i.e. single DUIDs)?
With this core question in mind, I’ve prepared this table to highlight the different shapes of the distributions for ‘all wind’ and ‘all coal’ as follows:
| Raw Off-Target Extremes | Aggregating All SS Wind 39 units |
Aggregating All Coal 48 units |
| Under-performing
> +700MW |
NIL |
1 dispatch interval Includes the most extreme positive instance for ‘all coal’, which was +709MW at 08:05 on 9th October 2019. This will be discussed in a Case Study here. |
| > +600MW (in total) |
NIL |
1 dispatch interval (which is the ‘most extreme’ case above) |
| > +500MW (in total) |
NIL |
3 dispatch intervals (of which 2 are below +600MW) |
| > +400MW (in total) |
NIL |
8 dispatch intervals (of which 5 are below +500MW) |
| > +300MW (in total) |
7 dispatch intervals Amongst these instances is the most extreme positive instance for ‘all wind’ which was +375MW at 02:25 on 1st September 2019. This will be discussed in a Case Study here.> |
27 dispatch intervals So considerable greater number of instances than for ‘all wind’ in percentage terms, though the total number is still low across the year. |
| > +200MW (in total) |
68 dispatch intervals |
64 dispatch intervals So this row for coal is much the same as for ‘all wind’. We can see (from the rows above) that these excesses for coal extend to greater MW ‘Raw Off-Target’ errors than they do for ‘all wind’. |
| > +100MW (in total) | 1,944 dispatch intervals … which is 162 hours (or 6.8 days) So 5.8 times the number of dispatch intervals, compared with the next column for ‘all coal’ I’ve run out of time in this article, but aim to perform further analysis of the 100MW-200MW instances, which (by their large number) could be adding to system costs. |
331 dispatch intervals … which is 27.6 hours (or 1.1 days) |
| > +30MW (in total) |
24,587 dispatch intervals |
14,053 dispatch intervals |
| ≤ +30MW, and ≥ –30MW
(i.e. dispatch intervals where the aggregate performance of these groups of DUIDs could be thought of as ‘good’, at least in terms of this metric) |
67,675 dispatch intervals |
80,675 dispatch intervals |
| Over-performing
< –30MW (in total) |
12,174 dispatch intervals Note that there are double the instances under-performing (two rows up) as there are instances here of over-performing. This is understandable, given the incentives and mechanisms set up in the Semi-Scheduled category. |
10,392 dispatch intervals In contrast, there is much less difference shown for ‘all coal’, which again is totally understandable. Because it is ‘easier’ to suddenly drop output than it is to suddenly over-overperform: |
| < –100MW (in total) |
734 dispatch intervals I’ve run out of time in this article, but aim to perform further analysis of the 100MW-200MW instances, which (by their large number) could be adding to system costs. |
204 dispatch intervals |
| < –200MW (in total) |
28 dispatch intervals |
12 dispatch intervals |
| < –300MW |
1 dispatch interval This was the most extreme negative instance for ‘all wind’, which was –301MW on 19:25 on 31st October 2019. This will be discussed in a Case Study here. |
2 dispatch intervals. One of these instances is the most negative extreme instance for ‘all coal’ which was –357MW at 15:05 on 12th October 2019. This will be discussed in a Case Study here. |
Now let’s look at different representations of the same dispatch interval results to think through what the answer might be!
(B3a) Fuel Type Aggregates, viewed across the Year by Dispatch Interval
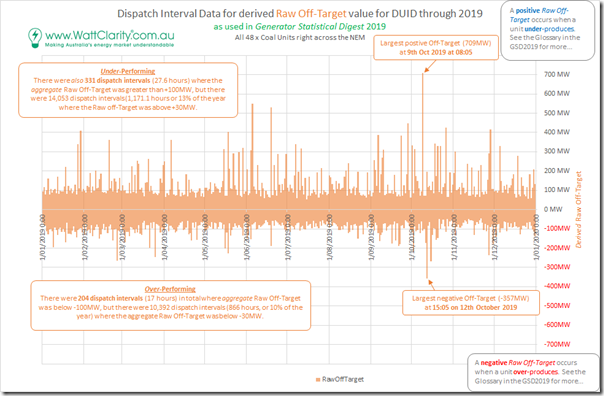
Because we are transitioning from the old (i.e. coal) to the new (i.e. wind and other), I will start with the trend view for ‘all coal’, drawing on the same source data produced for the GSD2019 to produce two trends of DI-level data across the CAL 2019 year:
Here’s the equivalent chart for ‘all wind’:
We can see the ‘bulkier’ spread on the y-axis for ‘all wind’. This seems to be particularly pronounced for the November and December months – it appears that there are many more instances with Raw Off-Target exceeding 100MW in either direction. This would be worth further exploration, to understand the extent that this was contributed to by newer wind farms being commissioned?
(B3b) Fuel Type Aggregates, viewed across the Year by Day
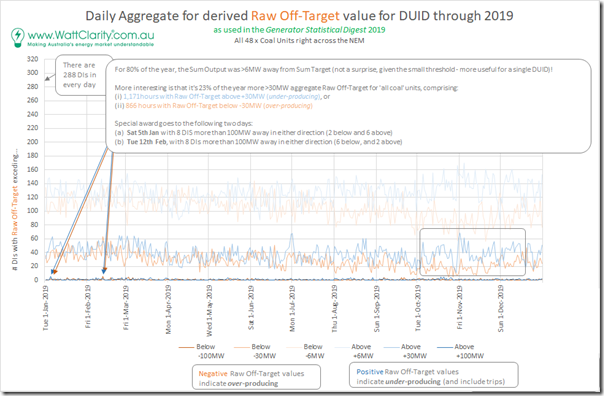
Aggregating the dispatch interval data up by day, and starting with ‘all coal’ again we have the following pair of trends:
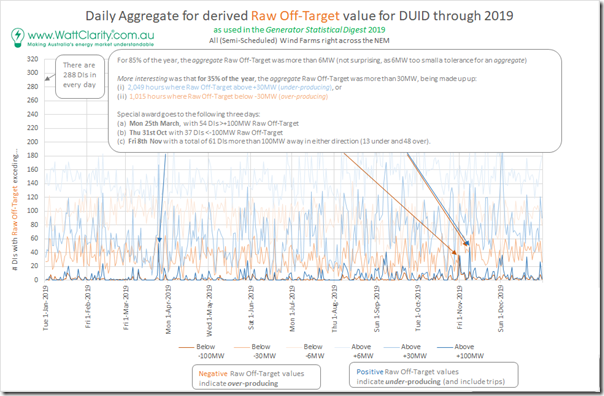
Here’s the same trend of daily stats for ‘all wind’:
In this chart we show 6 trends (3 high, and 3 low) with different thresholds used for determining ‘materiality’ and we discuss the results in the following
| Aggregating All SS Wind 39 units |
Aggregating All Coal 48 units |
|
| About variability |
There is plenty of variability from one day to the next with the results for ‘all wind’ – no matter whether looking at >6MW, or >30MW or >100MW in absolute terms. Because of this variability, please accept my apologies that this chart is quite difficult to read (i.e. much more difficult than for ‘all coal’). This raises a related question about the degree to which these discrepancies in aggregate Raw Off-Target will be predictable. This is something that would need to be the subject of further analysis. |
In contrast, the three groups of trends for ‘all coal’ are much more consistent across all days of the year. |
| General comments on under-performance (i.e. positive Raw Off-Target) to over-performance |
As already revealed in the prior tabular results, there is considerably more under-performance than over-performance (i.e. the blue lines are quite often higher than the orange lines). This is understandable, given the way the Semi-Scheduled category works. |
In the chart for ‘all coal’ I have highlighted a period in October, November, December where it appears that there is a deviation between the number high and the number low. The annotation was made for >30MW, but it can also be seen in the >6MW trends as well. It’s not immediately obvious why this would be the case – but would be worth further investigation. |
| aggregate Raw Off-Target in excess of (only) 6MW … in either direction |
On the chart we explain how for ‘all wind’, 85% of the year saw dispatch intervals in excess of 6MW Raw Off-Target: |
Eyeballing the daily trend above, it appears that there’s typically a fairly even trend of about 120 dispatch intervals high and another 120 dispatch intervals low in most days: |
| aggregate Raw Off-Target in excess of 30MW … in either direction |
There were 6 days on which more than half of the day was over-performing by at least 30MW (i.e. more than 144 dispatch intervals with aggregate Raw Off-Target >+30MW): 1) Monday 25th March 2019, with 167 dispatch intervals under-performing: —- 2) Sat 7th September 2019, with 157 dispatch intervals >+30MW Raw Off-Target (under-performing): 3) … and the following day (Sun 8th September 2019), with 171 dispatch intervals >+30MW Raw Off-Target (under-performing): —- 4) Fri 20th September 2019, with 150 dispatch intervals >+30MW Raw Off-Target (under-performing): —- 5) Sun 1st December 2019, with 158 dispatch intervals >+30MW Raw Off-Target (under-performing): 6) Mon 2nd December 2019, with a staggering 187 dispatch intervals >+30MW Raw Off-Target (under-performing):
|
Across the year there is a fairly steady trend of between 20 and 60 dispatch intervals with aggregate Raw Off-Target in excess of 30MW away from zero. Again, there is the divergence seen later in the year. This shows where the excesses (23% of the year with Raw Off-Target more than 30MW in either direction) were spread across the year. |
| aggregate Raw Off-Target in excess of 100MW … in either direction(i.e. a point at which the exceptions start looking as ‘extreme’) |
The extreme daily results for these two trends in the ‘all wind’ aggregation are much more easily visible than was the case for ‘all coal’. In the chart, I highlighted the following three days, each of which could be explored in follow-on Case Studies: 1) Mon 25th March 2019, with 54 dispatch intervals >+100MW Raw Off-Target. 2) Thu 31st October 2019 with 37 dispatch intervals <-100MW Raw Off-Target: 3) Fri 8th November 2019 with a total of 61 dispatch intervals more than 100MW away in either direction (13 under and 48 over):
|
In contrast for ‘all coal’ even the extreme days don’t jump up very far off the bottom of the chart – a much more even spread of extreme outcomes across the year. In the chart I did flag these two days of the biggest extremes: 1) Sat 5th January 2019 saw 8 dispatch intervals where the aggregate Raw Off-Target was more than 100MW away in either direction: 2) Tue 12th February 2019 saw 8 dispatch intervals more than 100MW away in either direction:
|
More discussion?
.
(C) Subsequent questions, with respect to balancing Supply and Demand in ‘NEM 2.0’
By virtue of the above, I’m currently sitting with more questions than answers – and more questions than I had when I started this small piece of analysis.
It seems certain that it’s an area of analysis that should be pursued in order to ensure that the design of ‘NEM 2.0’ is fit for purpose, given the challenges that the analysis above seems to indicate is there to be addressed. It’s certainly something we’ll be thinking more about as part of the broader project to assemble a Generator Report Card 2020 (GRC2020).


Leave a comment