Today (Tue 5th May) I posted the lengthy article ‘Balancing Supply and Demand …. in the fast approaching ‘NEM 2.0’ world’.
I invested the time to do that because we see some important questions in there that need to be answered in order to make a ‘NEM 2.0’ market actually deliver on what it needs to deliver for the energy transition to succeed. There were other reasons as well, not least of which was because thinking through changes and challenges like these stands us in much better stead to be ready to continue serving our growing client base well beyond the 2025 start date for NEM 2.0.
(A) Context…
This (much shorter) Case Study follows from this, with the objective being to illustrate the relevance of this kind of analysis using examples of extremes.
(A1) … about aggregate Raw Off-Target
Dispatch Intervals in which there is a large aggregate ‘Raw Off-Target’ will be dispatch intervals in which there will be a higher cost imposed on the market for dealing with these imbalances. For those who want to understand more, suggest you read the article.
In highlighting the ‘worst’ dispatch intervals through CAL 2019 for both the ‘all Coal’ and ‘all Wind’ groupings in Tuesday’s lengthy article, I published a summary table – which is copied in here:
| . | Aggregating All SS Wind 39 units |
Aggregating All Coal 48 units |
| Under-Performance (including trips) Aggregate Raw Off-Target >> 0MW |
The worst dispatch interval for wind was 02:25 on 1st September 2019. On this occasion, the ‘all wind’ group saw an aggregate Raw Off-Target was +375MW. Several other things that could be noted: This will be discussed in a Case Study here. |
The worst dispatch interval for coal was 08:05 on 9th October 2019. On this instance, the ‘all coal’ group saw an aggregate Raw Off-Target as high as +709MW: This is the subject of this particular Case Study. |
| Over-Performance Raw Off-Target << 0MW |
The worst dispatch interval for wind (-301MW) was 19:25 on 31st October 2019. In this instance: This will be discussed in a Case Study here. |
The worst dispatch interval for coal was 15:05 on 12th October 2019. This was just 3 days after the worst outcome at the opposite extreme! This will be discussed in a Case Study here. |
This article today is the first of four case studies.
(A1) … about why we invest time in these Case Studies
Also worth reiterating some of the reasons why we significant invest time in delving into specific instances through case studies like these (some of which make their way onto WattClarity).
Do you know of others who can help us expand our capability?
(B) A focused look at this Dispatch Interval
In this particular Case Study, we focus on the ‘worst’ example of an aggregate Raw Off-Target for ‘all coal’ units well above 0MW (i.e. where these units were, collectively, under-performing) – specifically this occurred at 08:05 on Wednesday 9th October 2019.
(B1) All Coal Units
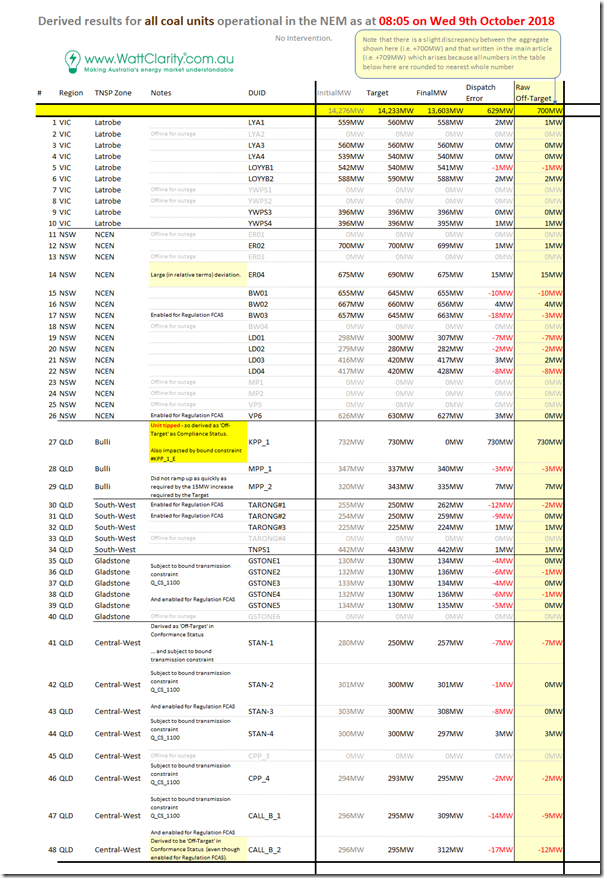
In the table below I have compiled the relevant data for all of the 48 x coal-fired units at that dispatch interval (with those offline on outage indicated):
Click on the image for a larger view.
We can see that Kogan Creek was the stand-out contributor to what was the largest positive aggregate Raw Off-Target value for the ‘all Coal’ grouping through the whole of calendar 2019….
(B2) Somewhat unexpected trip at Kogan Creek as the main culprit
… so we’d like to take a closer look.
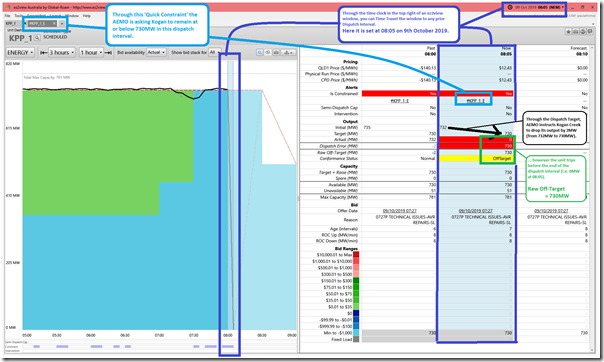
Thankfully, it is quite easy (using the ‘Time-Travel’ function in our ez2view software) to wind back the clock and review what the start of the market was at that time – using the ‘Unit Dashboard’ widget shown here:
Click on the image for a larger view.
As noted in the image, Kogan had been running close to ‘flat out’ around 730MW for the prior 3 hours (which is what could be expected, given the lower-cost nature of its operations compared to other coal plant in the QLD region). AEMO had provided it with the ‘#KPP_1_E’ quick constraint, asking for it to limit its output to 730MW – which meant a request to reduce its output by only 2MW.
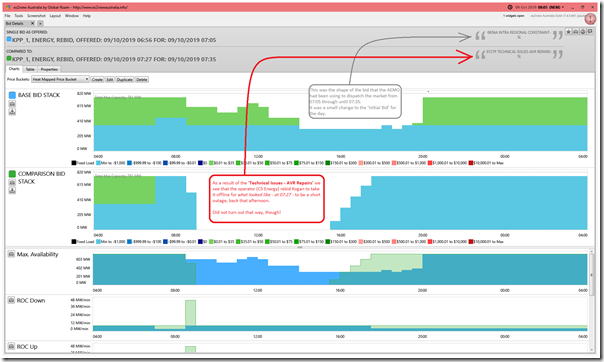
Unfortunately something had emerged, so a rebid had been received at AEMO at 07:37 talking about ‘Technical Issues – AVR Repairs’ (i.e. 25 minutes or so prior to the trip). We can use the ‘Bids & Offers’ widget to launch a ‘Bid Details’ widget to compare the prior bid (received at 06:56) with this rebid (received at 07:27, when the technical issues were detected):
As can be seen, rather than the prior plan of reducing output through the day the operator (CS Energy) had already advised the AEMO in the rebid received at 07:37 that they would be taking Kogan out of service, and that it would be fully offline by 09:00.
I flag this sequence of rebids to note that the AEMO would have been aware, over the preceding half an hour, that Kogan had issues and was in the process of coming offline. The trip in the 08:05 dispatch interval (offline an hour earlier than the AEMO was expecting) was not exactly the timing they would have been expecting – but still not* totally unexpected.
* those kinds of ‘totally unexpected’ trips do happen sometimes. The numbers work out such that none of those trips contributed to an ‘aggregate Raw Off-Target’ for ‘all Coal’ greater than the extreme showed in this dispatch interval through 2019, however.
(B3) Some other coal units
In the table above I have also included some other notes for other units – so thought it might be useful to include a few other snapshots from ez2view. In particular, I have pulled out the two units which had (apart from Kogan) the biggest ‘Raw Off-Target’ value for the dispatch interval in question.
In the case of one other unit (as with Kogan above) it was derived in ez2view as being declared as ‘Off-target’ by the AEMO (i.e. first rung on the ladder to being declared ‘Non-Conforming’ by the AEMO, which is something all generators should seek to avoid).
B3a) Callide B2
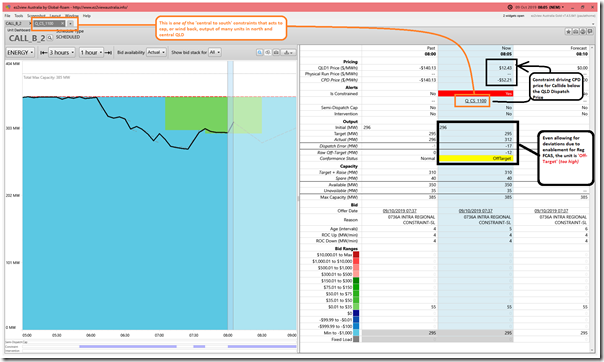
In the case of Callide B2, the unit was derived as ‘Off-Target’ because (even allowing for some deviations with enablement for Regulation FCAS) it was too high in output compared with what its Dispatch Target had been for this Dispatch Interval:
More can be deduced from this widget – however the fundamental point was that (with the Raw Off-Target being negative in this case – i.e. over-performing) this unit was inadvertently working to reduce the aggregate discrepancy for the ‘all coal’ grouping in this Dispatch Interval.
B3b) Eraring unit 4
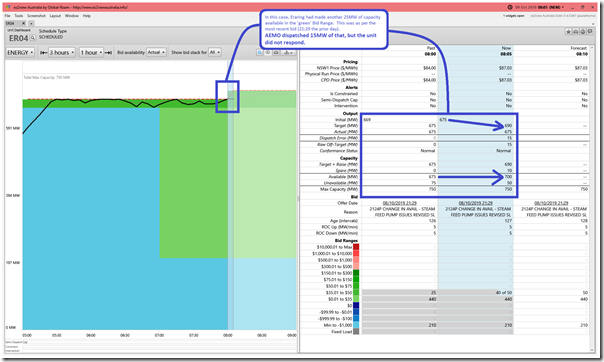
I’ve also added in this snapshot from Eraring Unit 4:
In this case, the unit was dispatched up another 15MW in response to 25MW of additional capacity being available for the 08:30 trading period (i.e. first dispatch interval 08:05). However the unit did not respond, for reasons I have not explored.
———–
That’s all I have time for today. The other 3 Case Studies will follow as time permits.


The case of Callide B2 “off target” +17 MW above dispatch was due to governor frequency response with a drop to 49.64 Hz after Kogan tripped at 08:00 on 9th October 2019. Prior to the frequency disturbance it was spot on its target.