Summer 2019-20 has been a doozy for the NEM, and we’re not done yet.
Just like that Monty Python line ‘and now for something completely different’ we’ve taken a break from the blistering heat and bushfires to be trudging around in gumboots and loading up the ark…
… however it’s been the extremes in temperature that have been the predominant factor on a what’s gone on across the sector across the NEM thus far this summer.
(A) Extremes temperature effects on the electricity system
It does not surprise us that these extremes in temperature are having such an effect. After all, we explored several aspects of how ‘the NEM is becoming increasingly dependent on the weather’ in Theme 6 within Part 2 of the 180-page analytical component within our major Generator Report Card 2018 (released just over 8 months ago now):
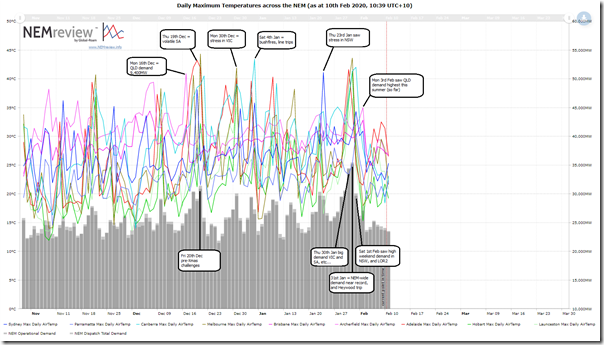
I’ll endeavour to come back and update this chart in another month or so (when we’re sliding into autumn) but I thought it useful to start with this trend query from NEMreview v7, showing daily maximum temperatures over all the days since 1st November 2019 – in conjunction with daily peak Operational Demand (NEM-wide) and peak Scheduled Demand (NEM-wide):
It should be fairly obvious from this chart that extremes in temperature are a big driver on extremes in demand (especially when we look at a more local, regional level) – however extremes in temperature have also driven other stresses in the grid in various ways. Some of the big events have been tagged on the chart, and are discussed in prior articles through summer 2019-20 on WattClarity.
The way in which temperature affects physical infrastructure can be obvious enough to anyone who wants to objectively look at the effect on performance (this is something we addressed in both the GRC2018, and also the Generator Statistical Digest 2019 partial update and extension) ….
(B) Effect by generation technology types
… however we have noted that (whilst our infrastructure suffers in various ways), it’s the quality of our reasoning* that also seems to wilt in the heat.
There are some notable exceptions, however. For instance it is worth flagging that Michael Bachelard published ‘The day from hell: why the grid melts down in hot weather’ in on 17th December 2019 as one example of a mainstream media piece that starts to grapple with the unavoidable complexities….
… but they are some relatively rare exceptions. Ultimately (if we don’t significantly improve the quality of our analysis) we’re all going to end up paying more, and being more exposed to higher risk, as this energy transition gathers pace. This is just one example of what we meant in stating ‘the transitional challenges require greatly enhanced analytical capability’ in Theme 14 within Part 2 of the 180-page analytical component within our major Generator Report Card 2018:
So given that we just released the GSD2019 (now 2 weeks ago) I thought it would be useful to quickly share some of what was contained in both the GRC2018 and the GSD2019 as an attempt to hopefully reset our discussions to be more based on objective review of data, and less based on anecdotes and emotions.
(B1) Clarifying which Aspect of Performance?
There are many aspects of performance, and that (it seems) our energy sector discourse gets itself confused with different participants thinking about performance in different terms. Hence it might be worth starting with a clarification that, in our view, there are two separate aspects which are quite important – but which are affected by extremes in temperature in different ways…
Aspect #1) High temperatures does reduce the Peak Output Capability
Most generation technologies find their peak output capability limited at times of high temperatures – the mechanisms for this are outlined briefly for each technology in the table in (B2) below.
If any unit is (no matter what the fuel type or technology type) has its peak output capability affected by extremes in temperature, then this will result in the plant being partially unavailable at these times. Mathematically, the ‘availability’ number for a dispatch interval will be greater than zero, but somewhat less than the Maximum Capacity the AEMO records for the station.
1) In the Generator Report Card 2018, we performed a number of separate pieces of analysis:
1a) For all fuel/technology types, we looked at the effects on extremes in local ambient temperature (i.e. as close to each DUID as the BOM data allowed) using a 3-year history (2016-2018) and correlating to peak output per degree in temperature. We then assembled the data together for each fuel/technology type in order, which provided an easy way of seeing patterns in all technologies (but made it difficult to pick out discrete DUIDs). Some of this is shared below.
1b) Given that coal was (and remains) so topical at the time, and that it still supplies the dominant share of energy consumed in the NEM, we took a closer look at what the data was showing in terms of performance of the 48 coal units that remain operational (i.e. post Hazelwood). Some of this discussion is copied in below.
2) In the Generator Statistical Digest 2019 we included (on the ‘B’ pages) a separate chart for each individual DUID charting much the same data but:
2a) For CAL 2019; and
2b) Also including a range of output (not just the maximum output) to provide more context; and
2c) Also including the maximum Energy-Constrained Availability, in order to help reveal if network constraints were a factor in any limitation in output.
… hence great for exploring the high temperature performance of an individual unit.
Some samples from both documents are included in the table in (B2) below.
Aspect #2) The link between high temperatures and ‘Full Unavailability’ (including ‘Sudden Failure’) is not so clear
In contrast to partial unavailability (which is increased at higher temperatures for many generation technology types), there is no clear link that we can see in our analysis* of the data that would support the notion that higher temperatures increase full unavailability of any generation plant, or make it more likely that they would trip (have ‘Sudden Failure’).
* this analysis spans through what we did for the GRC2018, and in the GSD2019 – but also extends into other analysis we have performed
In the GRC2018, in an effort to reduce the confusion inherent with respect to different aspects of ‘Dependability’ we created this simple flow chart of metrics each with respect to different.
One of these aspects we called ‘Sudden Failure’ which we defined as any incident in which both of two criteria were met:
Criteria #1 = that there is a large and rapid change in output; and
Criteria #2 = that this change is unexpected.
It’s the combination of both criteria together that makes these events particularly problematic for the AEMO.
In part 4 of the GRC2018 we used three different metrics to investigate times of ‘Sudden Failure’ with particular focus on coal units – though the same form of techniques could be considered for other types of technology as well:
In the table below, we’ll walk through each of the technology types, keeping these criteria in mind….
(B2) Stepping through each technology type
Readers should note that it’s not the choice of fuel (directly) that dictates the high temperature performance of the plant – rather it is the technology used (primarily), with age of the asset and how well it has been maintained also playing a role. For this reason each row in the table has been focused on technology, rather than specifically the fuel type.
With any of the figures shown in the table below, they have been squished into a small space – but click them to open up a larger-screen view.
| ASPECT #1 How is peak output affected by high temperatures?i.e. partial unavailability |
ASPECT #2 Are they more likely to trip or be fully unavailable (i.e. “fail”) at high temperatures?i.e. full unavailability, and ‘sudden failure’ |
|
| Boiler-driven steam cycle with steam turbine
(coal, gas, biomass – and also solar thermal, nuclear and other…) |
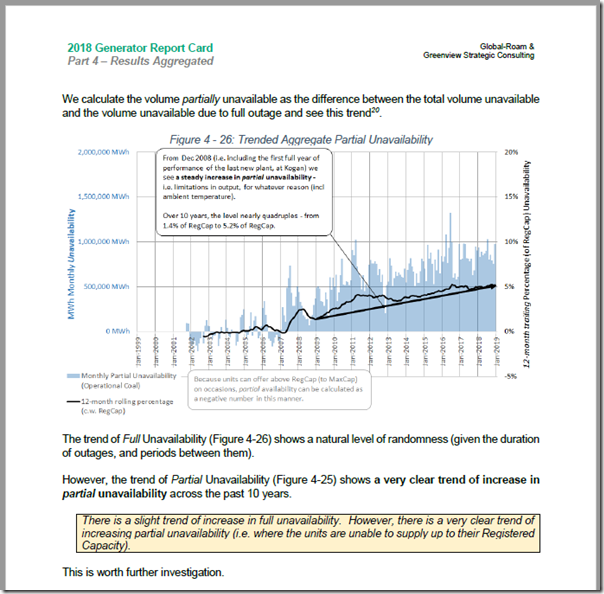
In the GRC2018 we included this trend (which was then discussed here in this article) to indicate that there has been a fairly consistent rise in partial unavailability across the 48 still-operating units in the coal fleet as shown here:
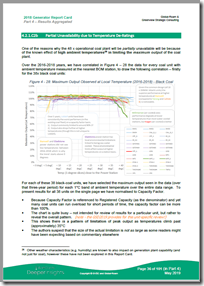
The data supports what an underlying engineering assessment would suggest – that at high temperatures the cooling efficiency of these types of units will diminish, and hence its peak output capability will reduce. This is fundamentally because of the limitations encapsulated in the Carnot cycle. For those newer to the energy sector, or without a power generation engineering background might be more surprised to know two things about this limitation: 1) Firstly, the limitation is not the result of the fuel, but more the result of the technology. For instance, these limits apply equally to: 2) The limitation on peak output is more gradual than one might be led to believe – here is the page from the GRC2018 that shows the calculated results for all 38x black-coal units still operational in QLD and NSW: As can be seen, there is a slight effect on maximum capability when ambient temperature rises above approx 35°C, but remember: Results for the 10x brown coal units remaining were also included in the GRC2018 but have not been copied in to save space here. Generally speaking, the drop-off in capability is not sharp. There were two figures from the GSD2019 included in this article about Liddell (one for LD04 and one for BW04) which illustrate the same general conclusion with data from CAL2019. |
There seems to be some general confusion about “fails at high temperature” limitations in this respect – which seems to be compounded by a campaign that is more based on emotion than on real data. This is one example where the broader set of energy sector stakeholders seems poorly served by poor quality analysis (GRC2018 Theme 14, as above).
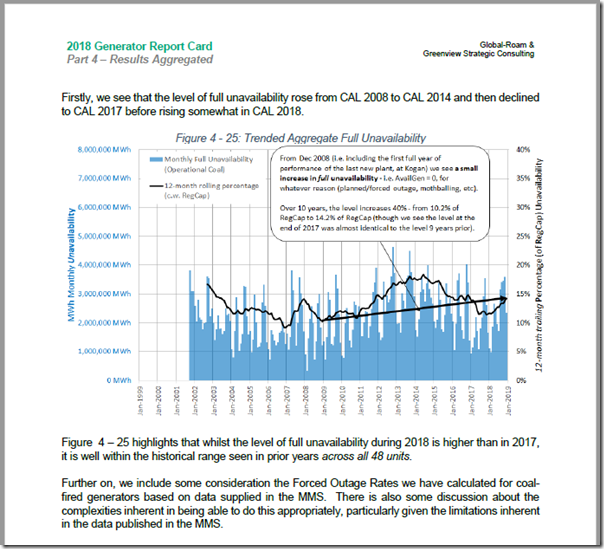
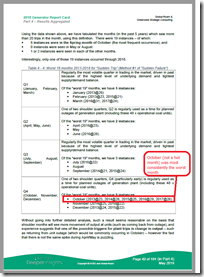
—————- In the GRC2018 we also included this trend (which was then discussed here in this article) to indicate that there has been no sustained upward trend in full unavailability across the 48 still-operating units in the coal fleet as shown here: It’s also useful to review use this figure and see that the months when the full unavailability was lowest also tended to be the times when the need for the unit was greatest – including summer times, when temperature was at its peak. The question in this column was also discussed in conjunction with this review of performance at Liddell Power Station through CAL 2019. In the GRC2018 we also used three different measures to look at ‘Sudden Failure’: You’ll need to read the GRC2018 for all of the details, but I thought it useful to include this page here that tabulates the months in which the ‘worst’ performances in terms of ‘Sudden Trip’ using the AEMO’s definition: The key take-away here is that the ‘worst’ months were not skewed towards the hotter months – indeed it was October that consistently saw the worst performances. Key takeaway seems to be: Coal-fired units are no more likely to fail in the heat than at any other time Unfortunately, it seems that a number of commentators and other external observers have become confused between the two different aspects of risk – probability and consequence: 1) We have seen no evidence to suggest that the probability of ‘Sudden Failure’ of these units is higher at higher temperature 2) However the consequence of such a failure, should it happen when the temperatures are higher, would be so much greater; 3) Hence, combining the two this means that the overall risk is larger – but this is not due to plant factors, but due to broader market/grid factors at higher temperatures. If the above is unclear (or particularly if you have evidence to suggest otherwise) please let me know! —————– In the interests of completeness, it’s worth noting that one reader (Ben) added this comment at the bottom of my article on Liddell which could be of value to some readers.
|
| Open-Cycle Gas Turbines = OCGT
(gas, and liquid-fuel fired) |
In the GRC2018 we included the following chart that mashed together the capacity factor capability curves for the large number of OCGT units deployed across the NEM
As can be seen (as is written at the time) the downward curve is capability is noticeably larger, and over a longer temperature range, than for the coal (and other) units in the first row above. This is what would be expected based on a fundamental engineering assessment of the underlying technology. |
Again, to extent that we have reviewed data for this technology type, it does not suggest either that: 1) These units are more likely to be fully unavailable in the higher temperatures; or 2) That these units are high probability of ‘Sudden Failure’ at higher temperatures. Keep in mind that these plant are predominantly peaking plant, so more likely to be called on to operate when temperatures are high (and demand and prices probably high as a result). Individual readers of the GSD2019 might want to peruse the discrete results of each of the OCGTs (there are many of them!) to see the extent to which they were able to hit all the high priced events. Leaving aside other potential limitations (e.g. portfolio bidding considerations and network congestion) these charts on the ‘B’ pages of the GSD2019 are a useful initial way to get a sense of how ‘dependable’ the unit is for what we generally expect of it. |
| Combined-Cycle Gas Turbines = CCGT
(gas) |
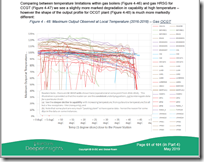
There are fewer CCGT plant operating in the NEM – historically its been the case that their capital cost has been higher than for OCGT and (despite the higher efficiency, hence lower emissions) they have found their output squeezed between: 1) Higher CAPEX but lower OPEX coal plant, at higher capacity factors; and 2) Lower OPEX but higher OPEX gas OCGT plant, at lower capacity factors; … and increasingly now production from Wind and Solar.For the CCGT plant operational in the NEM to the end 31st December 2018 we summarised their results via the GRC2018 in the following chart: 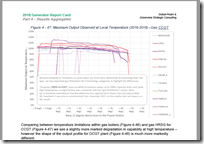 The output limitation curve is more gradual for the CCGT than the OCGT – which (technically speaking) combines characteristics of OCGT with those of steam turbines driven by boilers. The output limitation curve is more gradual for the CCGT than the OCGT – which (technically speaking) combines characteristics of OCGT with those of steam turbines driven by boilers. |
To the extent to which we have inspected the data for the (smaller number of) CCGTs, we have not seen evidence does not suggest either:
1) These units are more likely to be fully unavailable in the higher temperatures; or 2) That these units are high probability of ‘Sudden Failure’ at higher temperatures. If you have evidence to the contrary, please provide? |
| Reciprocating engines
(gas or liquid) |
In the GRC2018, we did not specifically separate out units running with reciprocating engines (though they are identified as such, so you can narrow down by searching the document).
With Barkers Inlet commencing operation in South Australia late in 2019, and the likelihood of other similar plants being installed to meet the needs for dispatchable peaking generation, interest in this category will increase. Out of curiosity I’ve attached the output chart for German Creek power station from the ‘B’ Page of the GSD2019 here: We can see a gradual curve that is similar to the effect that heat has on OCGT plant. |
We have not specifically been looking at these plant types – but, again, we have seen no evidence to suggest that either:
1) These units are more likely to be fully unavailable in the higher temperatures; or 2) That these units are high probability of ‘Sudden Failure’ at higher temperatures. As with the note about OCGTs above (perhaps even moreso) these units will be seen as peaking units even more in future years – so would be expected to run only when prices are high (which will correlate fairly well with when temperatures are high). |
| Various technology sub-classes
(hydro) |
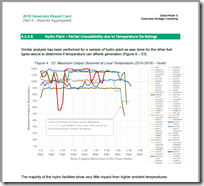
In the GRC2018, we included this diagram and brief discussion about temperature limitations on hydro plant:
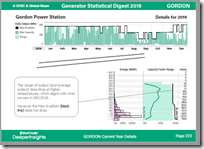
Especially because of all the hydro plant in Tasmania there are a large number of units – each is individually covered in the GSD2019. I’ve specifically extracted the singular chart for Gordon from the GSD2019 here, given that the GRC2018 chart showed the max output dropping at higher temperatures: We see this was more a factor of output than underlying capability (i.e. might have been due to storage levels or some other factor translated to bid price ranges, not aggregate capability). |
Again, evidence does not suggest either:
1) These units are more likely to be fully unavailable in the higher temperatures; or 2) That these units are high probability of ‘Sudden Failure’ at higher temperatures. |
| Wind | Coincidentally yesterday (Monday 10th Feb), the AEMO released its Quarterly Energy Dynamics for Q4 2019. On page 10 it discusses two different events early this summer that highlighted the correlation between high temperatures and low aggregate wind output:
In particular, the AEMO notes that (on Friday 20th December):
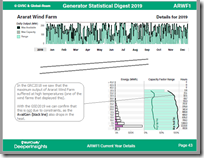
Let’s start by noting that (as discussed in the GRC2018) there might be several factors that can combine to deliver a concerning correlation between high ambient temperatures and low wind farm output: Possible Factor #1) For some wind farms, technical capability suffers under extremes in temperature (like the ‘de-rating’ noted by AEMO above). It’s my understanding that this is primarily due to insufficient cooling on gearboxes and other rotating components – though a more learned reader might help us with that? Possible Factor #2) For some wind farms, there is a nasty correlation between low wind speeds on high temperature days. Possible Factor #3) Even for wind farms that avoid PF1 and PF2 it is possible their output might be limited due to (temperature exacerbated) transmission congestion Ultimately, it does not matter which of the factors are the cause of the lack of performance – as it ends up costing the wind farmer money, and leading to a more precarious supply/demand balance In the GRC2018 we showed that Ararat Wind Farm was one of the wind farms that displayed a marked reduction in maximum output at high temperatures (this was discussed in this article, including the many incorrect guesses that help to illustrate the generally poor level of understanding there is in the broader energy sector (there’s Theme 14 in the GRC2018 again). 1) With Ararat in the GRC2018 we could not be conclusive, however, about whether this was due to plant related factors (PF1 and PF2) or grid related factors (PF3). 2) This was one of the reasons why we invested considerable effort in designing the ‘per DUID’ charts that are now available to clients on the ‘B’ pages of the GSD2019. I have copied out the relevant chart for Ararat Wind Farm for you here: From this it is possible to conclude that grid constraints at high temperatures are not the only reason why Ararat Wind Farm suffers significantly reduced capability in the heat. Hence PF1 and/or PF2 are also at work. Perhaps a reader can help us out here with the specifics of Ararat WF? … but the broader point is that the extent to which this limitation is present in each wind farm (each is distinct) is now easily accessible to you in your copy of the GSD2019.
|
On the broader topic of unexpected drops in output, it is my understanding that what happened on 19th December (in South Australia) and particularly 20th December (in Victoria) was particularly alarming for AEMO, as the substantial drops in wind production were unexpected – hence making the AEMO’s job harder in terms of balancing supply and demand.
Given the sudden disappearance of capacity that AEMO had been assuming was there, it was understandable that the AEMO issued this extraordinary appeal directly to the operators of Semi-Scheduled (i.e. wind and solar) assets the following Monday. Thankfully, though: 1) I believe that responses from Semi-Scheduled operators has improved; and, on top of this 2) We have now released our GSD2019 to enable everyone to have a clearer view of how high temperatures limit the output capability of all DUIDs (hence fewer unexpected & sudden drops in capability) —————- Understanding the extent of technical limitations in plant Technical Availability and sudden (purely plant-related) changes in Technical Availability is not currently possible to determine because of the absence of this data in the MMS – i.e. its overwritten via AWEFS with Energy-Constrained Availability to mask Technical Performance. This was something else we discussed in Theme 14 within Part 2 of the GRC2018 : |
| Solar PV | It’s been discussed in many other places (including by Finn Peacock on Solar Quotes, and also here on Solar Calculator) that high temperatures reduce the efficiency of the silicon solar cells – hence potentially limiting the maximum output of the plant.
Specifically Finn notes:
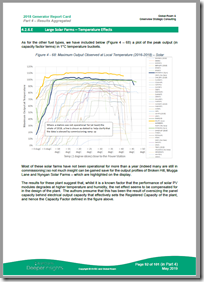
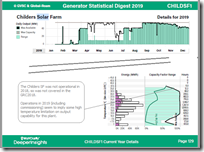
Finn’s article goes on to talk about how rooftop solar cells will end up being considerably hotter than ambient temperature – which is one of the reasons why I don’t see my own 5kW rooftop solar system produce near the rated 5kW output, especially in summer. Because of this widely understood limitation in capability, in the GRC2018 we were expecting to see some limitation in capability show through for the Large-Scale Solar PV plant. However this page revealed a more complex picture: Taking into account the fact that many of the plant were not operational for the full 3-year range used in these charts in the GRC2018 the curves looked flatter, in general terms, than we had expected. We reasoned that this is because the project proponents had undersized the inverters compared with the installed capability of the solar panels deployed on the farm – which we, in turn, believe because: 1) The relatively low price per panel has incentivised this; especially in the light of 2) Taking this decision would help to achieve a higher capacity factor (i.e. a ‘squarer’ production shape during daylight hours) hence more revenue. There are many more solar farms that began operations in 2019 and so are included in the the GSD2019. Here’s the output curve for Childers Solar Farm: In this particular case, the data suggests that the ‘oversizing of panels’ has been more limited than in other cases. Perhaps this was the result of a particular view of the market taken by the developers? Some (but not all) Solar Farms in the GSD2019 show a similar pattern. |
Just like with Wind Farms, understanding the extent of technical limitations in plant Technical Availability and sudden (purely plant-related) changes in Technical Availability is not currently possible to determine because of the absence of this data in the MMS – i.e. its overwritten via ASEFS with Energy-Constrained Availability to mask Technical Performance.
This was something else we discussed in Theme 14 within Part 2 of the GRC2018 : |
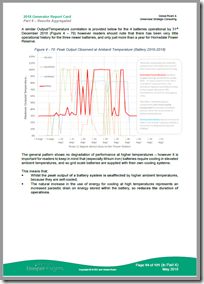
| Batteries | In the GRC2018 we looked at the performance of the battery systems that had been operational through until 31st December 2018:
… however these plant (only 3 of them) had been operational for only a limited period of time. In the GSD2019 we have access to more batteries, and also to another year’s worth of data. As with the others, it was specifically CAL2019 that was the focus of the ‘B’ Pages. PS – based on questions from John (below) I thought it would be easiest to answer by adding in this page showing the full-year results for Gannawarra BESS discharging: Note that (except for 6.5 hours up at temperatures above 45°C) the battery was able to discharge up to its MaxAvail – factoring in any limitations the inverter might have. However it is worth noting, more broadly, that it is not peak output for batteries that suffers in higher temperature – but rather it is the volume of useful energy stored. This is fundamentally because: 1) Batteries perform best at cooler temperatures: 1a) in fact there can be some concerns that batteries can be unsafe at extreme temperatures (particularly in the presence of fire); 1b) this was one of the reasons we invested considerable effort in developing an Energy Storage Register to a certain point; 1c) these concerns are much more likely to be realised in smaller residential battery storage systems. 2) The larger-scale industrial batteries deployed wholesale on the grid (and visible in the GSD2019) have resolved these issues with the deployment of integrated cooling systems: 2a) However these cooling systems act like a parasitic load on the energy stored in the battery – an Auxiliary Energy of sorts 2b) This parasitic load increases during hotter temperatures, understandably 2c) Hence whilst the peak output capability may not suffer in the battery systems at higher temperature, the duration of possible output does suffer because the available energy is lower. In the GSD2019 we have not specifically chosen metrics to focus on round-trip-efficiency of storage (and particularly how this varies at temperature), but will keep this in mind for the GSD2020!
|
We have not specifically been looking at ‘Sudden Failure’ for batteries – but, again, we have seen no evidence to suggest that either:
1) These units are more likely to be fully unavailable in the higher temperatures; or 2) That these units are high probability of ‘Sudden Failure’ at higher temperatures. |
I trust the above will be useful in helping to raise the level of understanding about all the ways in which high temperatures affect technical infrastructure on the electricity supply side of the grid?
(C) Parallel discussion on Social Media
Readers here might also want to keep tabs on the conversation that evolves on LinkedIn here, and on Twitter here.
(D) So where to from here?
Once again, if you know of people who can help us continue exploring the detailed nuances of the NEM in ways such as these (including freely sharing some insights on WattClarity), please direct them our way!







Apart from lack of cooling for wind farms the density of air declines and as the available power is proportional to mv2 and m declines from 1.2 kg/m3 at 20C to 1.1 @ 45C there is almost 10% reduction in available energy, the high temperature also reduces the efficacy of cooling of the generator as well as the gearbox so a 15% reduction in output at a given wind speed is not unexpected in high temperatures. The change in air density combined with Carnot efficiency losses is why gas turbines can be even worse than wind farms.
Coal plants often have to heat and partially dry the fuel so although the ISO ratings are usually performed at 15 C some coal plants particularly those with high moisture content coal often reach peak efficiency at up to 25 C because the higher boiler efficiency offsets the lower Carnot efficiency of the steam cycle. The brown coal plants probably have a better thermal co-efficient because the boilers are oversized to cope with poor quality coal and in Victoria unlike SE Queensland and even the Hunter, high temperatures are less likely to be accompanied by high humidity so the wet bulb temperature will usually be a bit lower.
If nuclear plants were built they would usually be de-rated more because they operate at 260-320 C vs 550-650 C for modern coal plants so the % temperature difference between Tmax and Tmin in the Carnot Cycle is higher.
Finally IC engines with properly sized cooling systems probably have the least temperature degradation of all because Tmax in a diesel is around 2000 C so a 20-30C change in Tmin is not a big amount although there will also be a reduction in charge density in the cylinders due to reduced air density
Excellent, thanks Peter. Thanks for investing the time to be so detailed!
Should you not also include Inverters? As they also suffer in hot weather as far as i know?
Thanks John, essentially thought of them as a bundled package with the upstream energy conversion tech.
So part of a battery system is the inverter.
So where you say the output of the battery in Power is not affected, from your data, a battery and inverter (the inverter is the one making the power ac, from the battery which is only dc.) system does not suffer peak delivery power reduction at all? Just length of time at peak supply.
Thanks John – have added the figure from the GSD2019 showing full-year data for GannBESS discharging above in the article. Thought it was the easiest way to illustrate the answer to your question. In terms of instances of output (and availability) there is not a derating seen in the same way as it is seen for other tech. As noted on the image, the way this analysis has been done it does not highlight worsening round-trip efficiency.
Very interesting article Paul. I just want to point out that it is important to beyond direct correlation between output and weather. In Texas, we’ve seen fossil plants show up at higher than expected rates during periods of extreme weather stress. But, especially in July 2018, these events were fairly well separated. When I talked to ERCOT (AEMO’s equivalent) folks, they were clearly worried about similar summer conditions happening with more clustered extreme heat conditions, as they had some concerns that some of the older fossil generators might not be able to hold up under much more continuous use. So it seems that cumulative use can be a predictor of generator outages. Have you guys looked at that kind of analysis?