
A short article this morning to reference some price volatility seen this morning in South Australia – with wind generation dropping away and gas generation ramping back up, coincident with Scheduled Demand climbing.
Here’s a reference to the four price spikes (at 10:30, 10:35, 10:45 and 10:55 – NEM time, of course) so far today captured in an SMS alert:

(as noted on the image, SMS alerts configurable in our NEMwatch, ez2view and deSide® software).
Certainly no ‘race to the floor’ following the price spikes that we would have seen on many occasions following the transition to Five Minute Settlement.
(A) The SA region
Here’s a snapshot from ez2view time-travelled back to 10:30, to show what was happening at the time of the first spike … but still within the current day, so no visibility of bidding behaviour:

I have marked up the snapshot with 5 notes:
1) We see the price spike to $15,000/MWh – and this pull the price forecast up for some of the dispatch/trading intervals that follow (we see, for instance, that the price forecast for 10:35 was for an elevated price).
2) One of the main reasons for the spike was low limit on flow west from VIC into SA
3) In response to (and probably partly the cause of) the spike we see:
(a) Fast response peaking suppliers (Hornsdale Battery and Barkers Point) increasing output –
(b) But also we see Willogoleche* Wind Farm and Snowtown 2 South Wind Farm both dropping off, as two of the biggest reductions in that 5-minute period;
* apologies, did not mark WGWF1 even though it’s a bigger drop than SNOWSTH1!
4) We see that there is a big drop in available capacity in South Australia
5) This coincides with a large increase in Scheduled Demand (i.e. Market Demand – measured by the AEMO’s ‘Total Demand’ figure).
(B) What was forecast in advance?
Using the ‘Forecast Convergence’ widget in ez2view we can quickly take a look and see that these outcomes were not entirely ‘out of the blue’…
(B1) Prices in ‘Forecast Convergence’
Basing the time-travel this time at 11:00 to enable us to look backwards at each of the price spikes, we see that perhaps there was some indication of some sensitivity in terms of prices … and remembering from articles such as this ‘risk is increasing in the NEM’ article following from the GRC2018* we can understand that it did not take too much to tip the scales into Market Price Cap territory:
* One of the pieces of work already completed for GenInsights21 with data to 30th September 2021 is an updated view of bidding behaviour (in terms of volumes in price ranges) – and it’s not really a surprise to see that the risk is even higher now. This is further discussed in GenInsights21 so keep in mind that you can pre-order your copy today.

Remember to look up the columns to see how AEMO’s successive P5 predispatch forecasts converged on the actual price (in the diagonal).
(B2) Market Demand in ‘Forecast Convergence’
Flipping the grid view to look at Market Demand (i.e. the AEMO’s ‘Total Demand’ figure) we see that the demand spiked a fair amount (in relative terms) unexpectedly – particularly for the 10:30 and 10:55 dispatch intervals:

That’s clearly one factor!
(B3) Available Generation in ‘Forecast Convergence’
Flipping the grid again to look at aggregate Available Generation in the South Australian region (i.e. incorporating Scheduled and Semi-Scheduled units) we clearly see there was a non-trivial and unexpected drop in aggregate capacity available from 10:25 to 10:30 for the first spike:

Remember we try to colour the grids with hotter colours being higher risk numbers – in this case, lower Available Generation.
(B4) UIGF in ‘Forecast Convergence’
Finally, we flip to look at the Unconstrained Intermittent Generation Forecast (UIGF) number for South Australia in the same grid – i.e. what the AEMO’s successive forecasts thought was the capability for Semi-Scheduled wind and solar in South Australia, independent of price and congestion:

No surprise, really, that there is a shift to much lower capability as we look up these columns – with the drop to the 10:30 dispatch interval being the significant one that (with other factors, such as those above) started this whole thing running.
(C) The culprit?!
Whilst I was finishing off this quick article, one of the team grabbed this image from the Himawari 8 Satellite and posted on our internal chat:
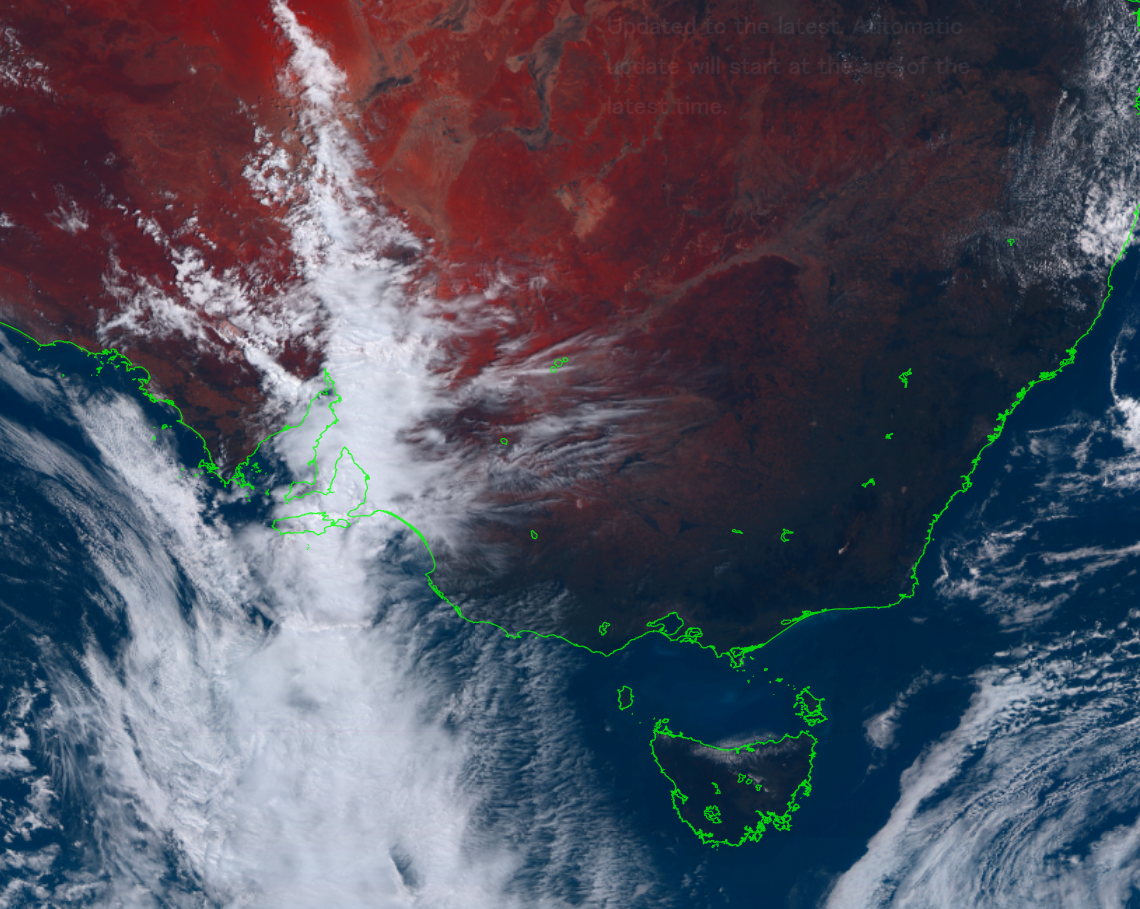
Looks like at least one of the culprits!
* One reminder about how ‘the NEM is becoming increasingly dependent on the weather’ – as discussed in the GRC2018.
(D) Alas it seems no Negawatts!?
With the WDRM having started a couple days ago, it was natural to be curious to see what happened in terms of dispatch of negawatts in the South Australia with such a lucrative opportunity… but alas it looks like not much happened at all as seen in this snapshot here from ez2view v9.3.1.7 at 11:10 looking backwards over the prior 45 minutes:

Given that much has been made about the large amount of capacity Enel-X has aggregated together for dispatch in the FCAS market, I wonder what is preventing it being used for such a juicy opportunity this morning in South Australia?
—
As a PS to this comment about Negawatts, worth highlighting Matt Grover’s comment here on LinkedIn on Wednesday, and my response:
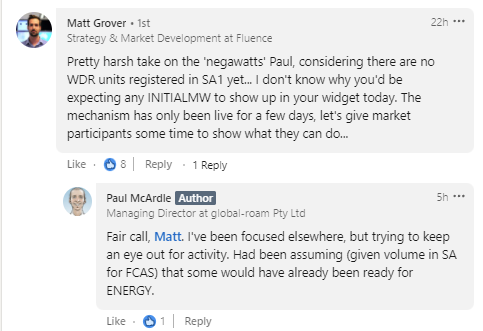
Leave a comment