Our Generator Statistical Digest 2020 will be released on Monday next week (1st February 2021) … so you have to get your pre-order in this weekend to save $300exGST on the final price.
1) The GSD2020 (as was the GSD2019 and GRC2018 beforehand) was a collaborative development between us (at Global-Roam Pty Ltd) and the team at Greenview Strategic Consulting … and we also are very grateful for the assistance provided by a number of others.
2) The dozens of clients who had already pre-ordered their copy of the GSD2020 were already provided early access to the GSD2020 this afternoon, and some have already started their weekend reading.
We’re looking forward to having this released!
—
On the ‘A Page’ for each of the DUIDs covered in the GSD2020 (i.e. all the ones that were operational in the energy market at some point in 2020) contains a chart that shows how the unit was bid during the 10 years to 31st December 2020:
1) Bids are aggregated by month as they were actually considered at the RRN, including energy constraints, and in 5-minute dispatch;
2) Bids aggregated in ‘Bid Ranges’ with identification in four general colour bands:
(a) at the bottom of the Bid Stack, in grey, are the ‘must run’ Fixed Load bids
(b) stepping up are bids at or below $0/MWh, in blue
(c) then there are bids in short-run marginal cost type bid bands (i.e. $0 to $300/MWh), in green
(d) above that are bids above $300/MWh all the way to the Market Price Cap, in red.
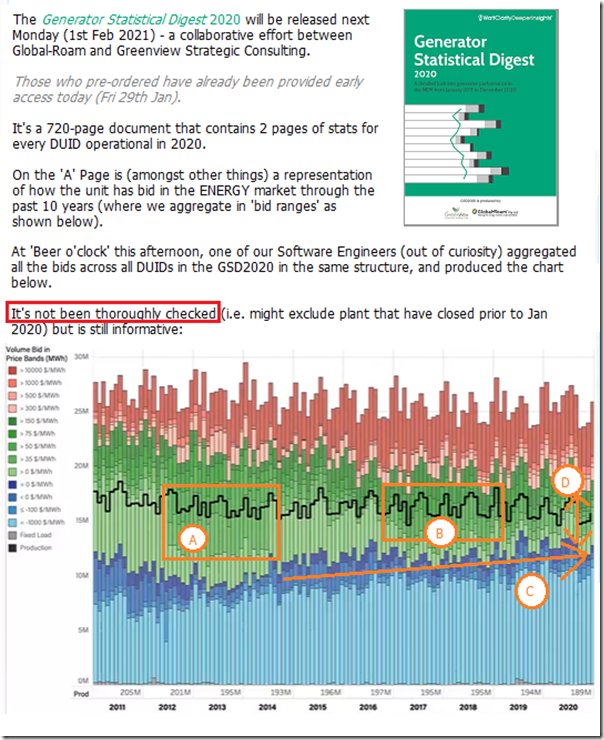
This afternoon at ‘Beer O’Clock’, one of our software engineers, because of some questions we were bouncing around, quickly threw together the following aggregated chart:
1) which has not been thoroughly checked (for instance, it occurs to me that this probably only covers DUIDs operational in 2020 … so earlier years might exclude plant – like Hazelwood – that have since closed);
2) but still would prove quite useful:
Amongst other things there are four quick observations to make – highlighted in orange on the chart:
Observation A) Carbon Tax
We can see the impact of the carbon tax on the bidding.
Observation B) Impact of Hazelwood closure (and other factors) on bidding
Hazelwood closed at the end of March 2017 … but the closure decision was announced in a rush only a few months beforehand. Factoring in the need to manage heightened risk in the NEM, there was a logical repricing of available fuel supplies that can be seen in the bid stack as highlighted (not without accusations being bandied about).
Note that the Hazelwood closure was not the only reason for the change (e.g. gas prices were also trending up).
Observation C) Increased volume below zero
We can also see the increased volume of bids at or below $0/MWh … not just from new Wind and Large Solar plant, but also a market reaction to this.
Observation D) Risk increasing
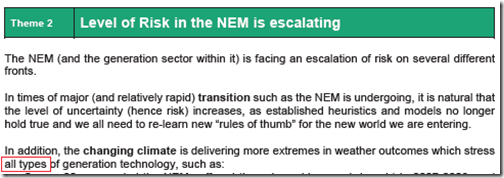
As noted in the GRC2018, the Level of Risk is increasing in the NEM:
(this was discussed in Theme 2 within Part 2 of the 180-page analytical component)
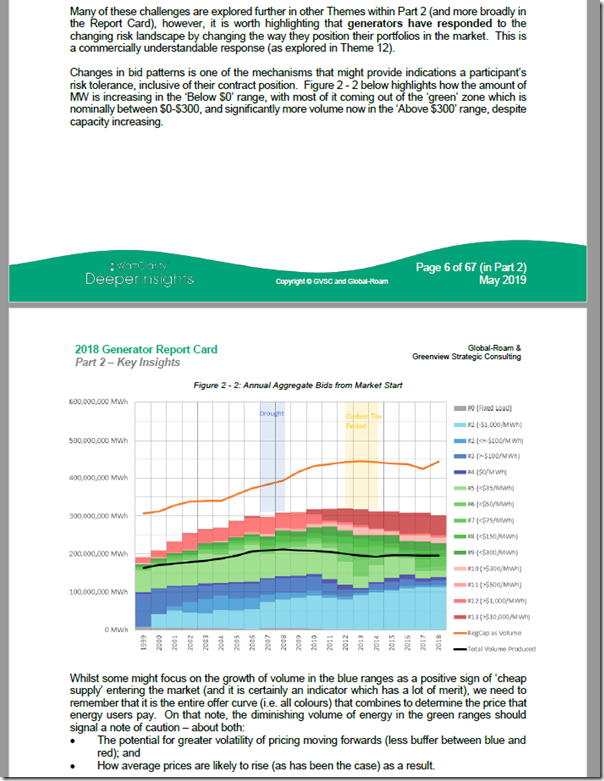
Since the release of the GRC2018 this has been echoed in a number of articles on WattClarity, including on 9th August 2019 and then on 30th August 2019. In the article from 30th August, we’d included a page extracted from this Theme 2 … which is copied in here as well:
As noted in the GRC2018, and again on 30th August 2019, the fact that the volume of energy offered in the ‘green’ bands is declining year-on-year is one illustration of how the risk of volatility is increasing in the NEM. We can see from the chart above aggregated together quickly this afternoon (note the caveat about it not being thoroughly checked!) seems to confirm that the trend continues, 2 years on from the GRC2018.
—
The advent of Five Minute Settlement (on 1st October 2021 .. so only months away now) may well prove another step forward into a more volatile NEM…


Fascinating figure! Why do we see such a big increase in total capacity bid from 2000 to 2005? Surely renewables aren’t an explanation, since they mostly came on board from 2010.
Demand in the NEM grew, Owen (up until 2009 or so)!