
“Q2 is the new Q1”, or so it’s been said in recent years.
In the first decade and a half of the NEM, the second quarter of the calendar year was typically a very uneventful period – characterised by relatively mild demand and post-summer scheduled outages for the (then predominantly thermal) generation fleet.
There were some deviations from the norm in 2013 and 2014, largely driven by the short-lived emissions trading scheme/carbon tax. However, it was really in 2016 that this paradigm began to change with, what we called at the time, a ‘remarkable’ shift in price outcomes. In hindsight, that quarter looks less and less remarkable with each new year, but it did signify a turning of the tide as we have since seen increasing volatility with each new Q2.
This held true again in Q2 2024, with at least four main drivers this time around:
- Several wind lulls that formed a ‘wind drought’, dampening wind production particularly in SA, VIC and NSW.
- Scheduled network outages, impacting a number of generators, particularly in NSW.
- Machinations in the gas market, with an extended outage at Longford impacting gas production (although it’s likely that other more structural factors are at play in the gas market).
- Dryer-than-usual weather, lowering hydro production particularly in TAS.
In this 2024 review of Q2 prices, an annual tradition here on WattClarity, I won’t focus too much on these drivers but focus rather on the shape and high-level statistics for spot prices in each region so we can compare to previous Q2s.
Region-by-Region
Queensland
We will begin with the QLD region. Despite the title of this article, this was the region to show the least ‘bounce’ compared to last year’s Q2 price outcomes. In fact, QLD was the only one of the five NEM regions where time-weighted average prices were down from Q2 last year. Also worth noting, that this coincided with a rise in the number of negative price intervals year-on-year.
As we see below, the duration curve followed a generally similar shape as to 2023, but diverged at the $100/MWh mark, and under.
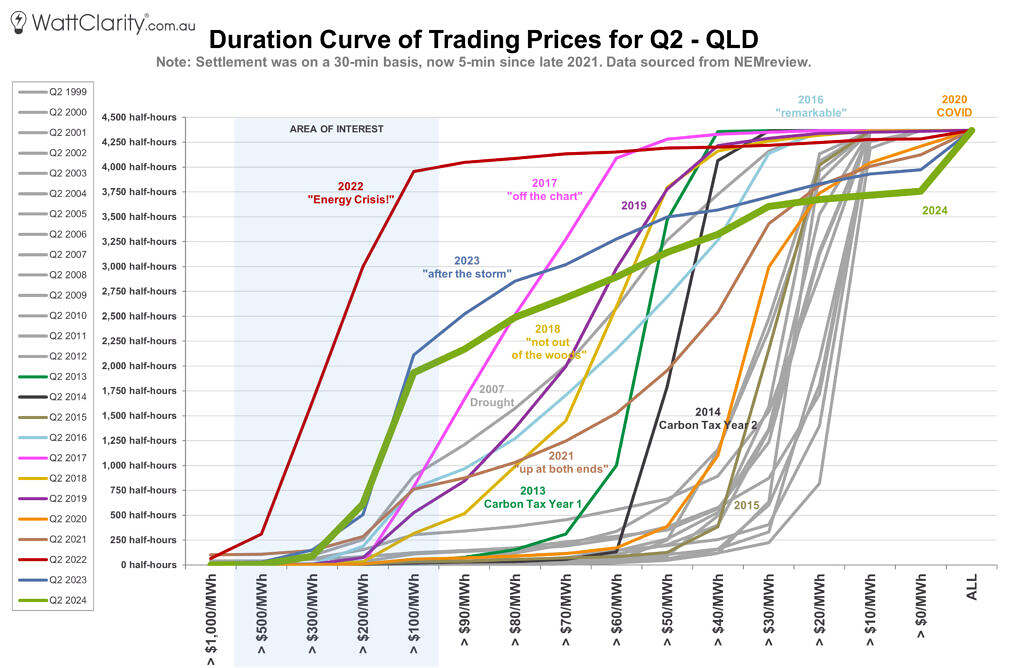
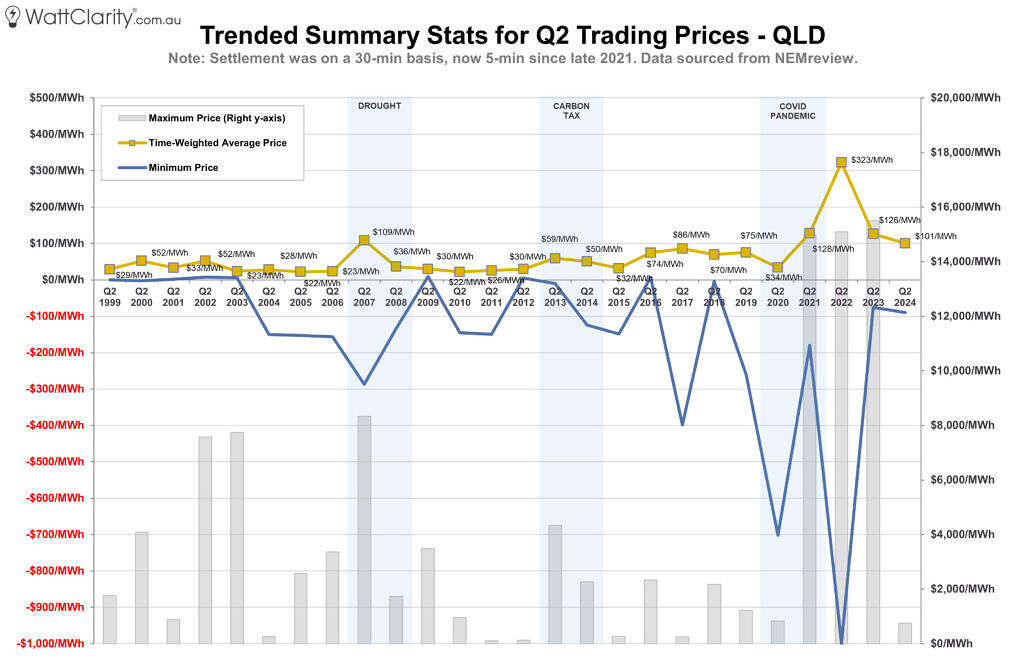
This year’s duration curve in QLD repeated a somewhat similar shape to 2023. Time-weighted average prices were down by $25/MWh. to $101/MWh compared to Q2 2023.
Source: NEMreview
The four drivers mentioned at the beginning of the article are likely to have had a smaller impact in the QLD region this quarter. We should also keep in mind that Queensland’s climate means that it is a strong summer-peaking region – hence colder temperatures in May and June (like we’ve seen this year) have less of a seasonal impact on demand than in more southern states – although weather outcomes generally tend to diverge between northern and southern regions regardless.
New South Wales
The duration curve for NSW revealed fewer incidences of negative prices, compared to QLD. Overall, NSW experienced a rise in time-weighted average prices (by $36/MWh compared to last year) to $173/MWh over the quarter.
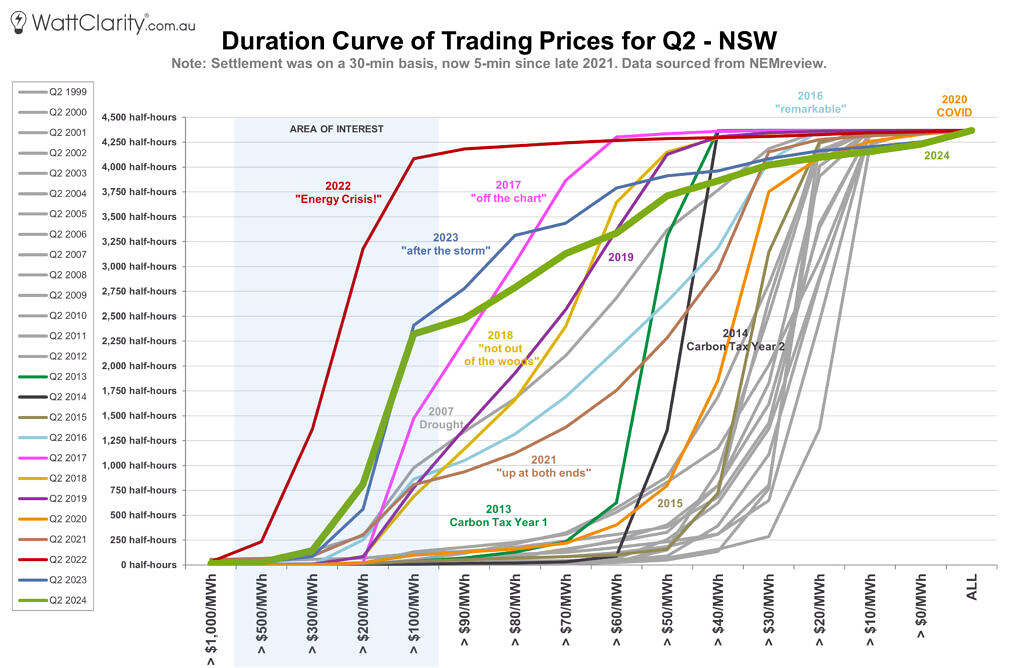
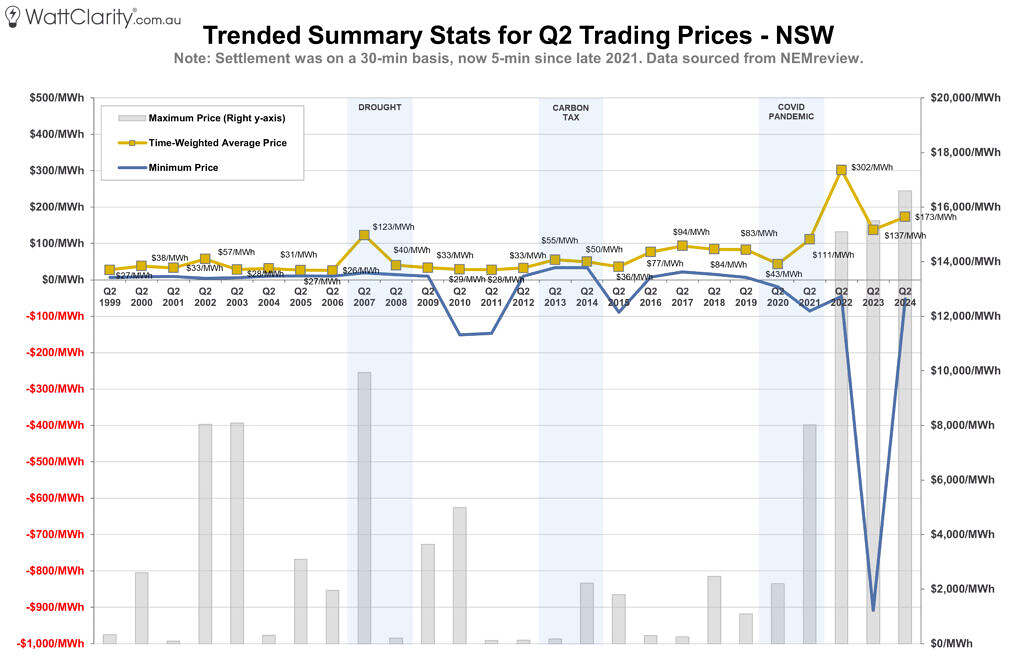 Time-weighted average prices were up $36/MWh, to $173/MWh, compared to Q2 2023 in NSW.
Source: NEMreview
Whilst QLD did not experience a single instance of prices spiking above $1,000/MWh, NSW had several intervals when the spot price jumped to or close to the market cap this quarter. Limits to flows on VNI, intra-regional network constraints (particularly the ‘N::N_CTYS_2’ constraint equation), cold temperatures, and low wind, all played a role.
As we noted at the time, the most significant period of high prices occurred in early May (where we saw price spikes on May 2nd, 3rd, 7th and 8th) where network constraints south-west of Sydney were a significant contributing factor. This eventuated with the region hitting the Cumulative Price Threshold (CPT) on the evening of May 8th and entering administered pricing for approximately one week.
Victoria
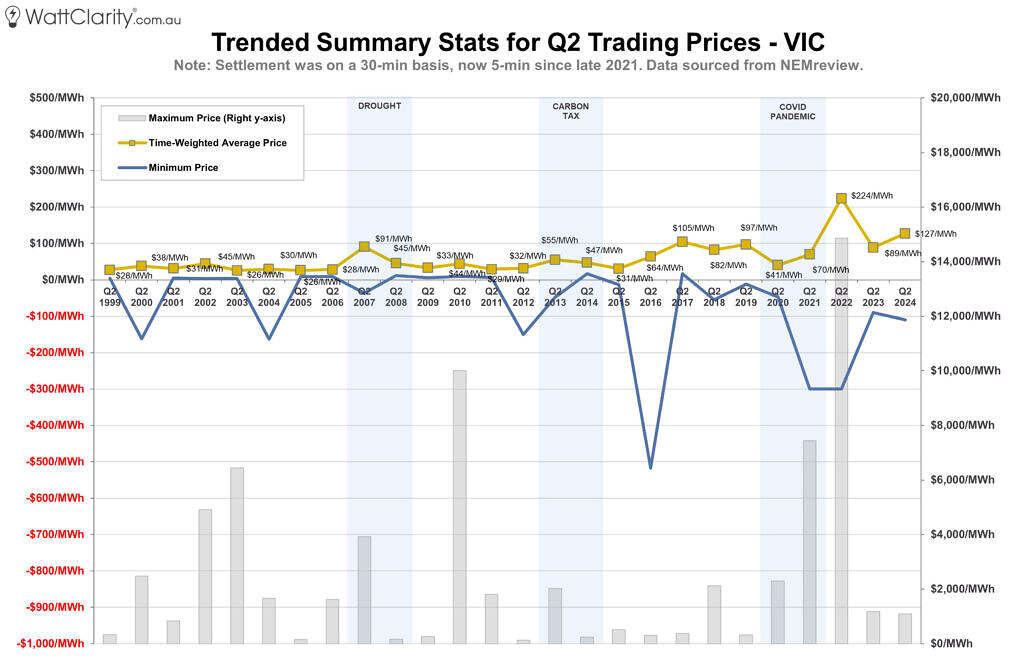
The duration curve in VIC for Q2 2024 sloped sharply around the $100-200/MWh range, compared to Q2 last year. Time-weighted average prices in VIC also increased to their second highest level ($127/MWh) since the start of the NEM, second only to the energy crisis of 2022. Although these averages were up, the maximum price in VIC this quarter did not go above the $1,000/MWh mark notably.
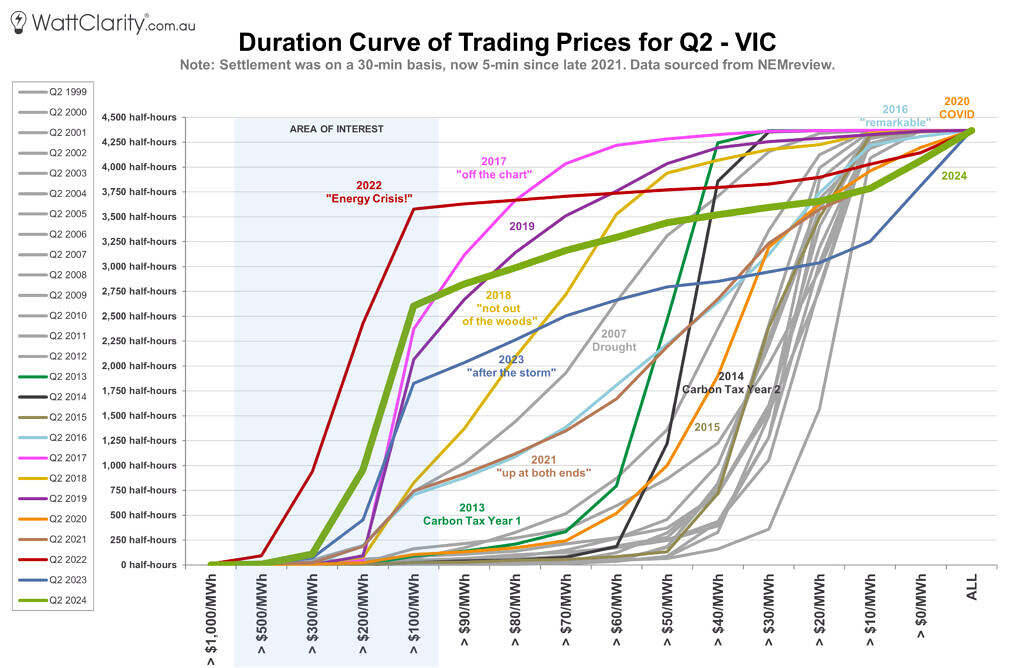
 The left side of the duration curve was significantly higher this year in VIC. Time-weighted average prices were up $38/MWh in VIC compared to Q2 2023.
Source: NEMreview
In a historical context, both the duration curve and trended stats show price outcomes in Q2 2024 that were more pronounced than Q2 2017 – which some will remember was an especially dicey quarter as the region was beset with the, relatively sudden, closure of Hazelwood.
In terms of underlying drivers, I noted last week that VIC was one of the regions where the supply stack was most impacted by a number of wind lulls that occurred in Q2. Cold temperatures and gas market spillovers are also likely to have played a role – particularly with low evening temperatures in mid-June contributing to a run of supply-demand tightness, that was felt NEM-wide.
South Australia
It was a similar story in SA, with the duration curve sloping sharper, higher and slightly further to the left compared to 2023. Unlike VIC, it is notable that SA saw some incidences of >$1000/MWh prices.
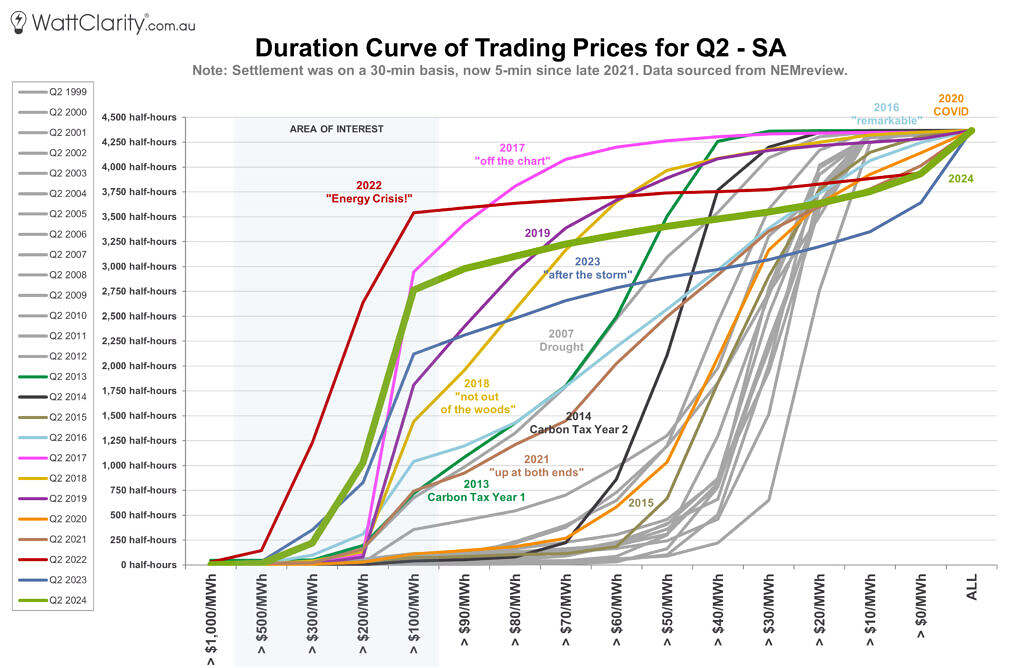
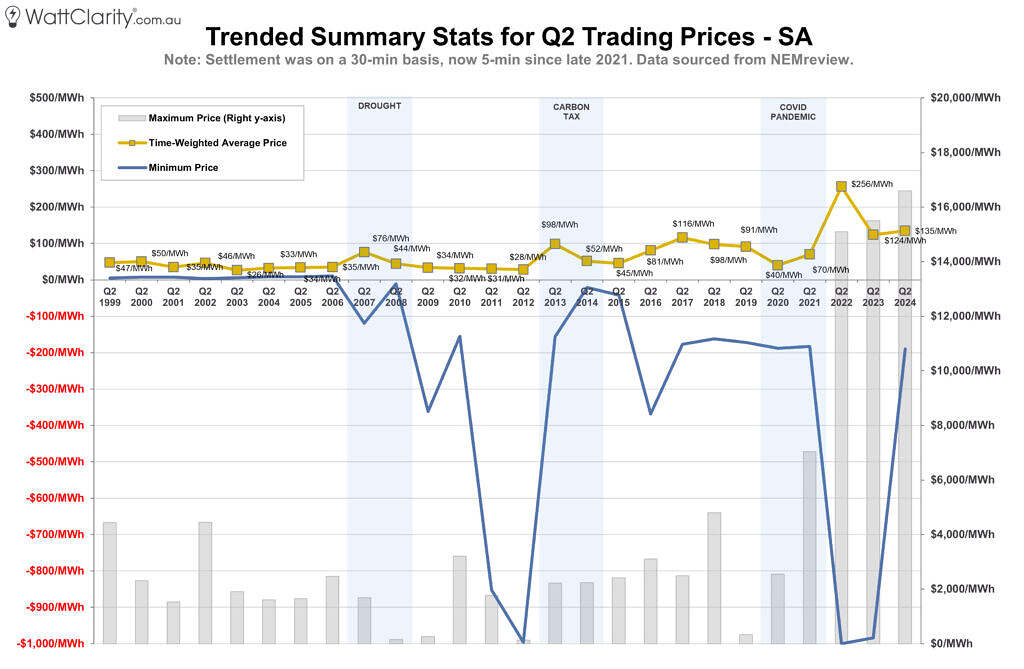 Time-weighted average prices in SA were up $11/MWh, to $135/MWh, compared to Q2 2023.
Source: NEMreview
As Linton noted at the time, there was a prolonged run of elevated prices in SA in the early evening of June 4th where we saw prices peak at $3,936/MWh. On that evening, Linton noted that limits on the Heywood interconnector and light wind conditions were likely contributing factors for this run of high prices. The region also saw more isolated price spikes on June 6th and June 18th, with the spot price hitting the market cap on the evening of the latter.
Tasmania
It was an eventful quarter in TAS, with the predominately-hydro region plagued by dry conditions. Time-weighted average prices in TAS more than doubled from Q2 2023, to $131/MWh.
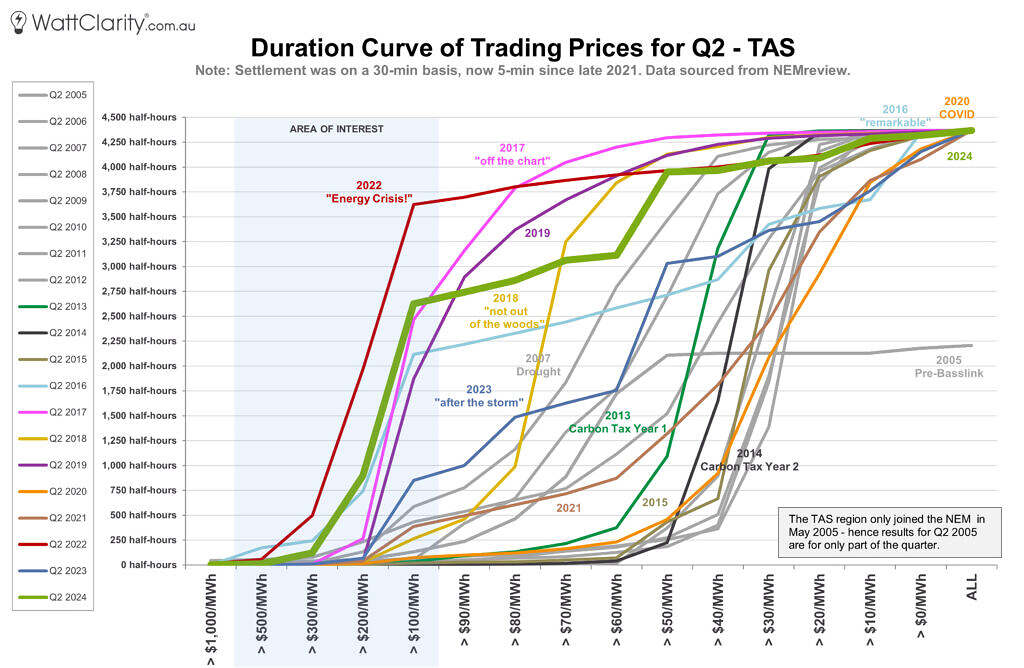
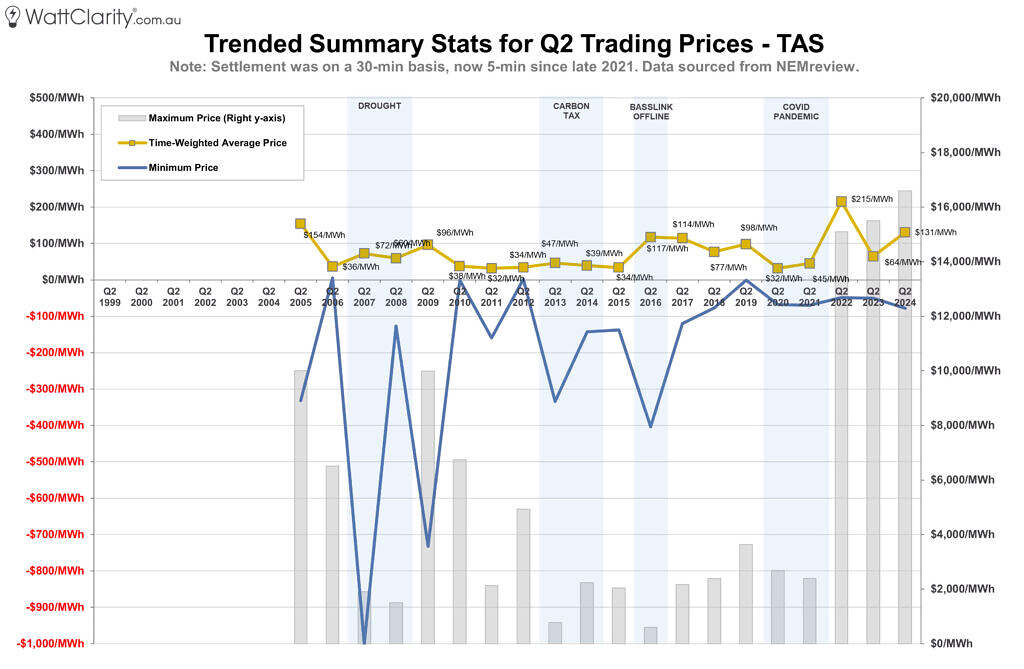 The shape of the TAS duration curve diverged significantly compared to Q2 2023. Time-weighted average prices in TAS were up by $67/MWh (to $131/MWh) compared to Q2 2023.
Source: NEMreview
Excluding the 2022 energy crisis, this quarter saw the highest time-weighted average prices experienced in TAS for a Q2 – higher than 2016, which was on the back end of the Tasmanian energy crisis (which included a six-month outage of Basslink).
As Paul noted last month, gas-fired generation ran particularly strongly this June, including a rare run of the Tamar Valley Gas Power Station (the first time it had run in roughly 5 years).
Western Australia
Although we tend to stick to commentary and analysis of the NEM here on WattClarity, for completeness is the Q2 duration curve and trended stats for WA. The data has been extracted from our NEMreview software (which currently only has WEM data back to 2017).
As expected, price outcomes in the WEM diverge significantly from the five NEM regions, owing to its distinct and fundamentally different market design characteristics.
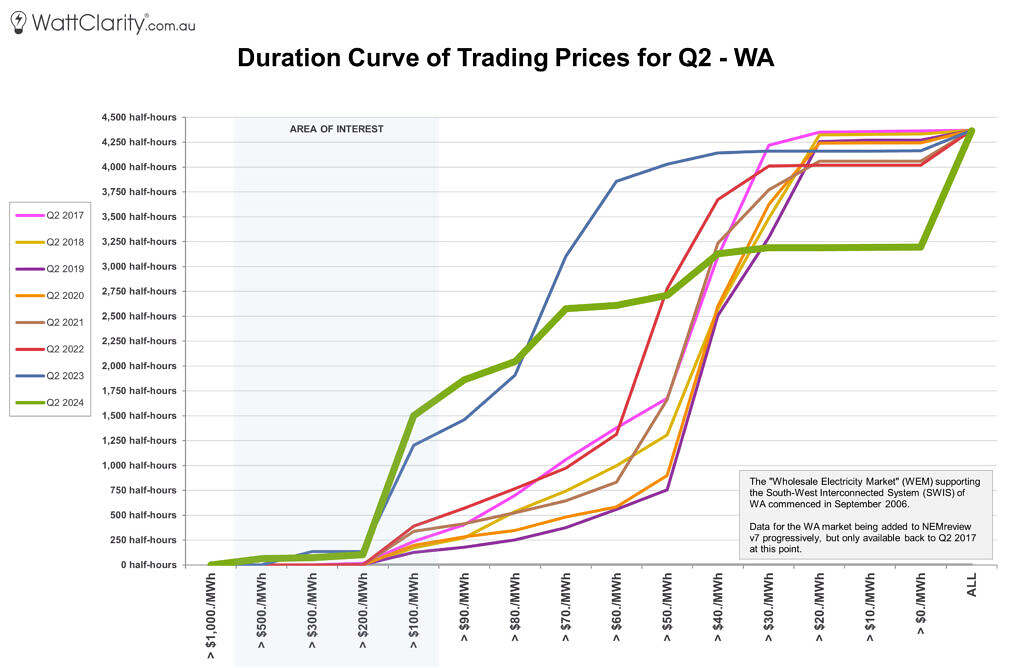
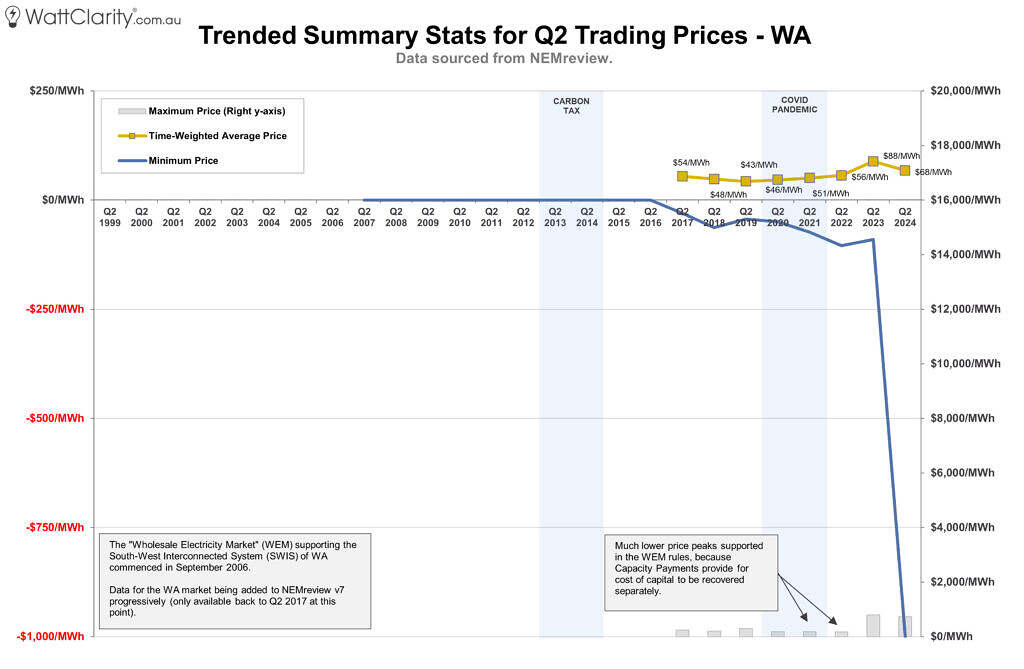 Time-weighted average prices in WA decreased by $20/MWh compared to last year, to $68/MWh.
Source: NEMreview
Worth noting here that a suite of extensive reform initiatives were implemented in the WEM in October 2023, hence this is the first Q2 since these market changes.
Summary
The chart below is the summarised view of time-weighted average prices across all five NEM regions and WA.
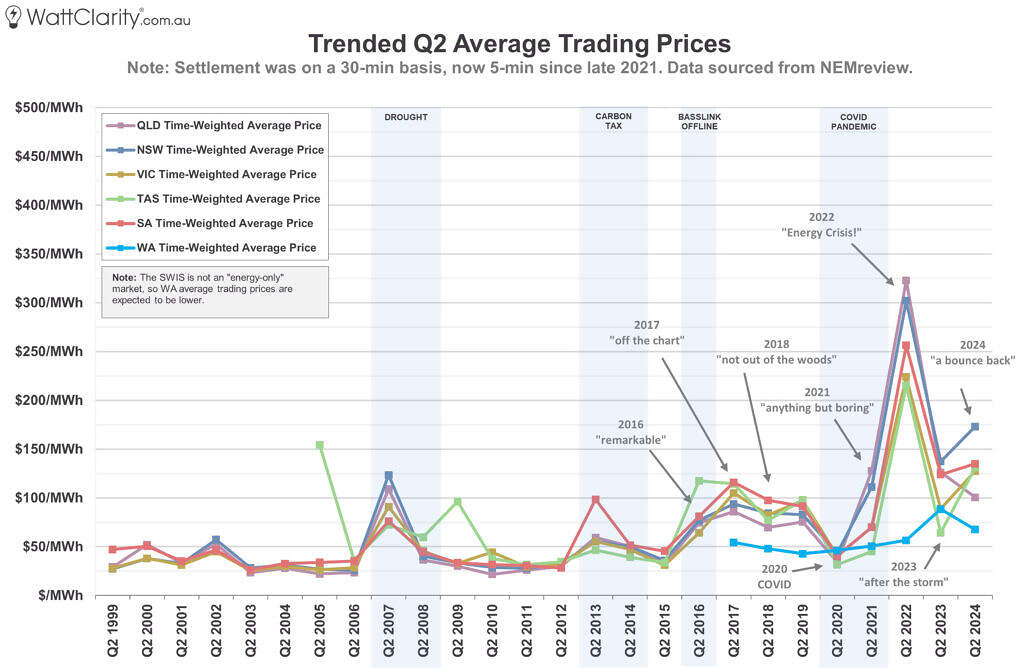
Time-weighted average prices bounced back higher for four of the five NEM regions compared to Q2 2023.
Source: NEMreview.
I labelled last year’s edition of this review “after the storm” to reflect a quarter where prices had decreased significantly year-on-year following the 2022 energy crisis, but were still trending upwards over a longer time horizon. As this year’s review appears to demonstrate a continuation of this increasing long-term trend, we’ve seen something of “a bounce back”.
For historical consistency with our previous reviews, the next three charts are displayed in terms of half-hour intervals (the average of the six 5-minute dispatch prices each half-hour), as we’ve been conducting this analysis for a number of years prior to the introduction of 5-minute settlement.
These charts show the number of incidences of half-hour periods where prices were >$1,000/MWh, >$300/MWh, and ≤$0/MWh in each region.
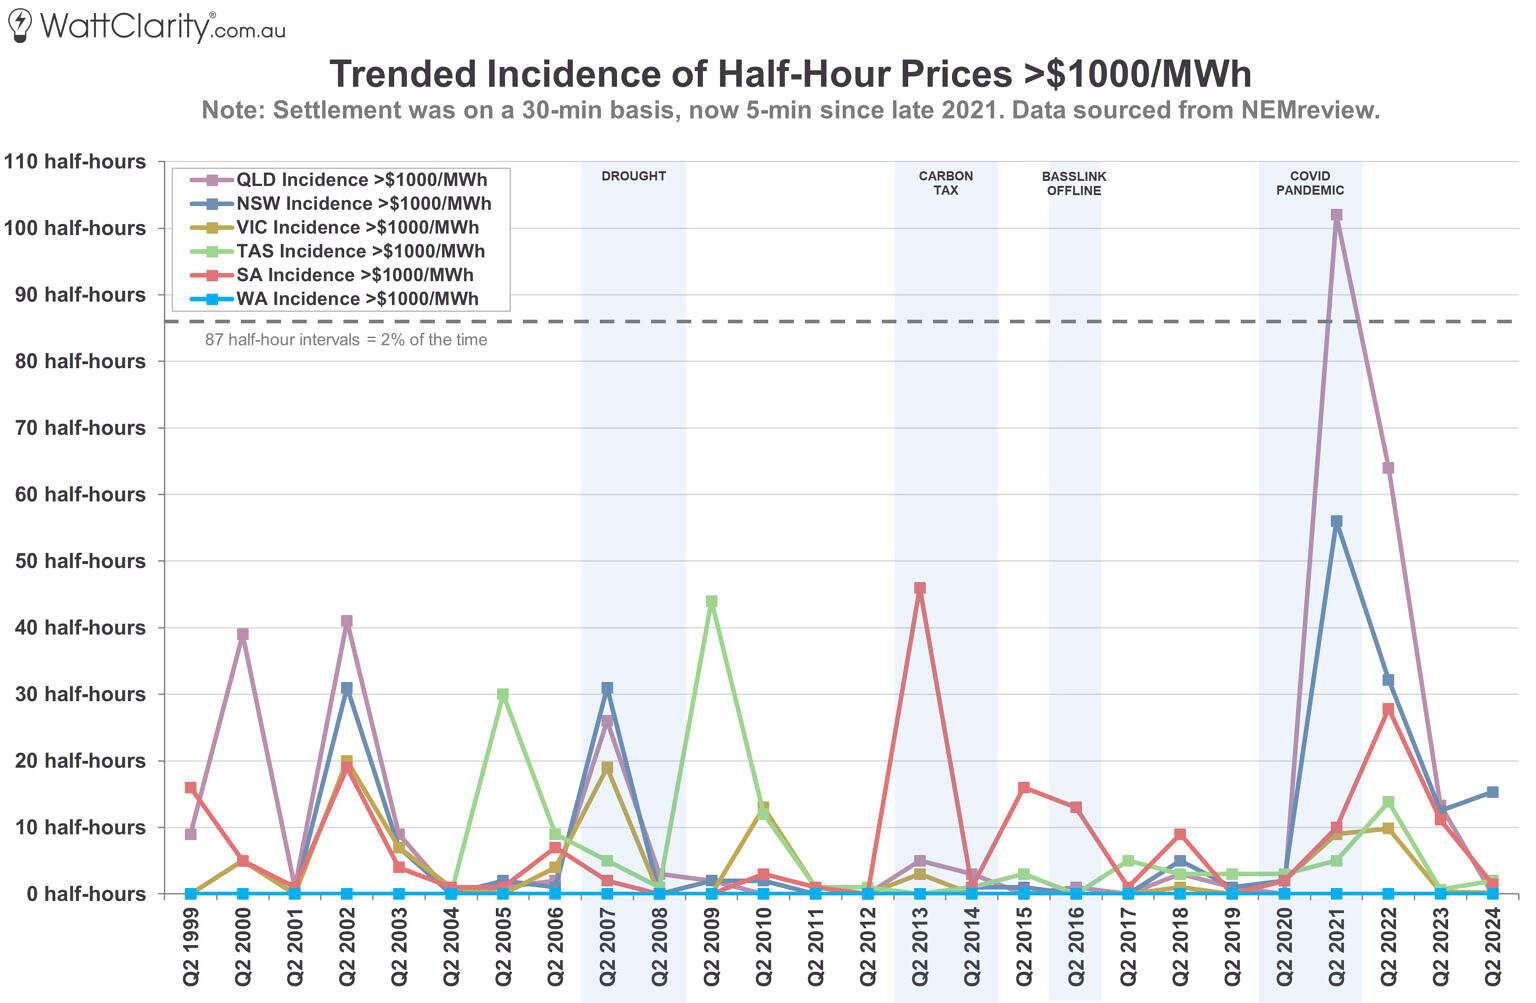
Although incidences of >$1,000/MWh prices increased slightly in NSW, and TAS year-on-year, these incidence are down on the whole compared to years 2021 to 2023.
Source: NEMreview
We can see the long-term trend of >$1,000/MWh price incidences is dominated by one-off events – the extreme price volatility that is expected (and economists would argue necessary) in an energy-only market like the NEM. Although there was a slight increase year-on-year in NSW and TAS, in general, we saw less of these extreme price occurrences compared to the previous three years.
The next chart shows the incidences of prices above $300/MWh (i.e. the price of a traditional cap contract), and shows mixed outcomes compared to 2023 across the regions, but still generally more incidences compared to 2021 and prior.
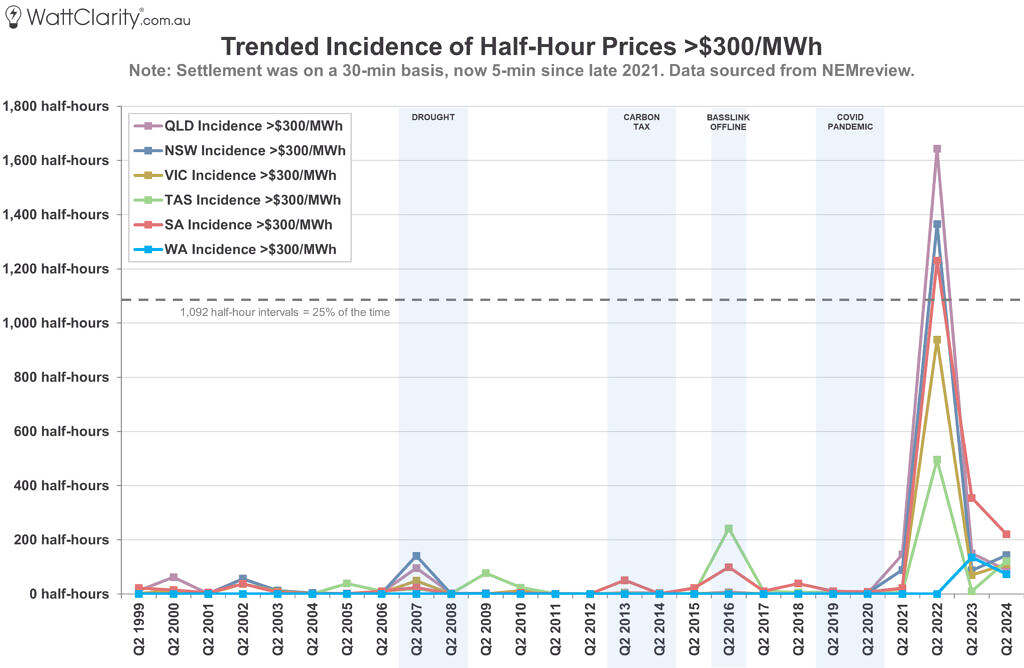 Incidences of >$300/MWh prices increased in TAS, NSW, and VIC, compared to Q2 2023.
Source: NEMreview.
And finally, we see a continuation of the long-term trend of increasing negative prices in Q2. Although the number of negative price intervals decreased sharply in SA and VIC (owing to the several wind lulls in those two regions throughout Q2), negative prices still occurred more frequently than all Q2s prior to 2023 in every region, bar TAS.
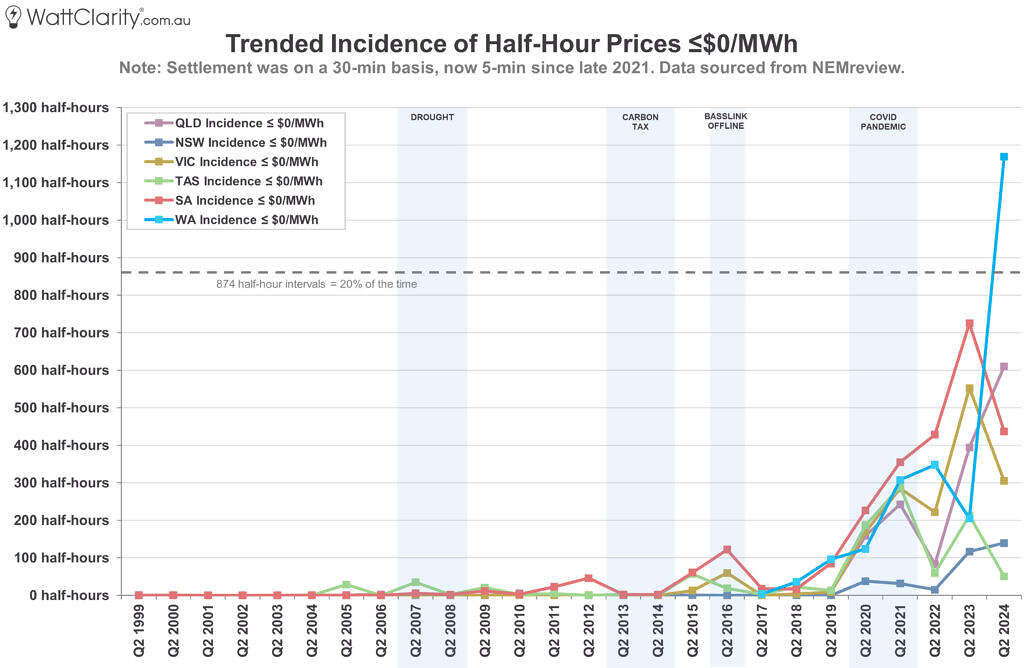 Incidences of negative prices increased in WA, QLD, and NSW and decreased sharply in SA and VIC compared to Q2 2023. The long-term trend shows a continuing rise.
Source: NEMreview.
Key Takeaways
This was a pure price analysis of Q2 with relatively little exploration of the underlying drivers, although we have had coverage of these on WattClarity in recent months.
There are still several notable insights and trends worth highlighting from this data exploration:
- Q2 2024 price outcomes showed somewhat of a QLD vs the rest divide. From what we’ve mentioned previously on WattClarity, the key prices drivers this last quarter appear to have impacted the sunshine state relatively less, with it being the only NEM region where time-weighted average prices declined compared to Q2 2023.
- Despite a relative lack of extreme prices incidences (i.e. spot prices >$1,000/MWh) compared to recent years, average prices trended upward in four of the five regions.
- Negative price intervals were down in VIC, SA, and TAS this year – but are still generally trending upwards.
- Despite what some might consider transient or short-term events driving price outcomes in Q2 2024, the long-run trend of increasing Q2 price volatility continues.
Nice to see WA included, very helpful