AEMO has been busy. This week they have released three major documents dealing with the challenges of the energy transition:
- An Electricity Statement of Opportunities (ESOO) projecting reliability levels across the NEM over the next 10 years as the generation mix continues to change
- Advice to Commonwealth Government on Dispatchable Capability which builds on the ESOO and recommendations of the Finkel Report with further discussion of the types of resources and mechanisms that may be required to address NEM reliability and security issues
- South Australia System Strength Assessment dealing with the specific technical challenges of securely operating a grid with very high and variable levels of non-synchronous wind generation alongside a traditional fleet of synchronous gas-fired generating units
In fact the ESOO brings with it a substantially updated set of NEM annual energy and maximum demand forecasts, superseding the Electricity Forecasting Insights projections published only a few months ago, so you could increase the count of AEMO’s major releases this week to four.
There’s far too much in any one of these documents to analyse or summarise succinctly here (not that that has stopped any number of commentators, some less well-informed than others, from rushing to conclusions and headlines). I’m just going to focus on the ESOO document and specifically what AEMO is trying to say about reliability for the coming 2017-18 summer.
What does “Unserved Energy” mean, and how is it measured?
Readers might find this brief explainer I have written today “What does ‘Unserved Energy’ Actually Mean” of value in interpreting the ESOO, and the commentary following from the ESOO.
Commentary following from the ESOO
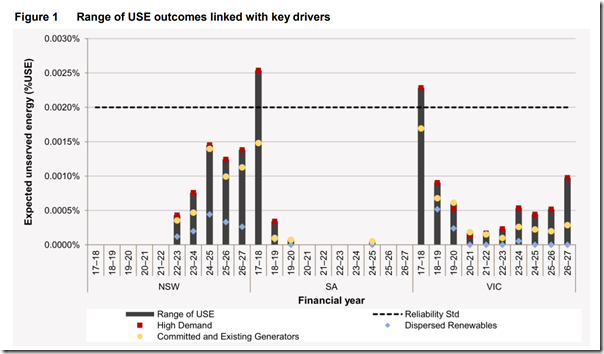
A lot of the commentary around the most recent ESOO arises from the fact that for coming summers in South Australia, Victoria, and later in NSW (after projected retirement of Liddell power station in mid-2022), AEMO is projecting USE values approaching or in some cases exceeding the reliability standard of 0.002%. This is summarised in the following chart from that document:
(The coloured marks on this chart represent USE assessments under different assumptions – or scenarios – about key drivers like demand growth and new generation investments. These scenarios are distinct from the multiple simulation cases for lower level variables discussed in the “explainer” post, which are run and combined to determine the USE value for any given scenario)
What doesn’t USE tell us?
Going back to the roulette wheel example, by itself the expected return of ~$100 on a $100 bet doesn’t tell you what the chance of winning or losing is, or what you stand to win or lose on any roll – you need to know more about the game and its possible outcomes. AEMO’s USE values are the same. By themselves they don’t say how probable AEMO thinks load shedding is to occur, or what the extent of that load shedding might be if it does.
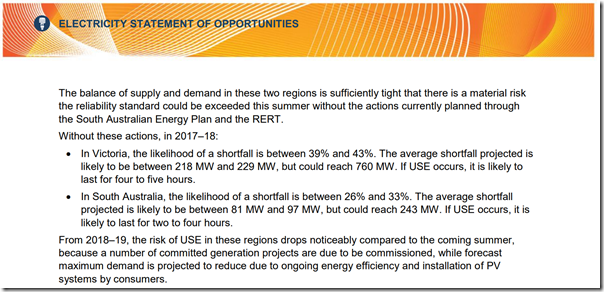
However there are some statements in the ESOO (p. 18) that refer to this, for the coming summer:
These numbers are a little difficult to reconcile with the USE measures published in the same document. Taking the Victorian example, the base case USE value is 0.0017% (s4.4.1 of the ESOO) or about 765 MWh. With the probability of any USE being quoted above at roughly 40%, then the average unserved energy in cases where it is non-zero should be 765 / 0.4 = 1,912 MWh. This is roughly twice the value obtained by combining the “likely” 218-229 MW and four to five hours duration stated by AEMO.
On the other hand the modelling does not capture all factors that might change the likelihood of actual load shedding this summer. In particular, AEMO’s most recent ESOO explicitly doesn’t assess the impact of various “outside the market” measures being put in place to shore up supply reliability ahead of this summer, including:
– The full capacity from the Jamestown (Neoen / Tesla) battery being built in South Australia
– The SA government leasing 276 MW of diesel-fuelled generation
– AEMO’s Reliability and Emergency Reserve Trader (RERT) program and joint Demand Side Response (DSR) project with ARENA together seeking up to 1,000 MW of additional capacity or its equivalent
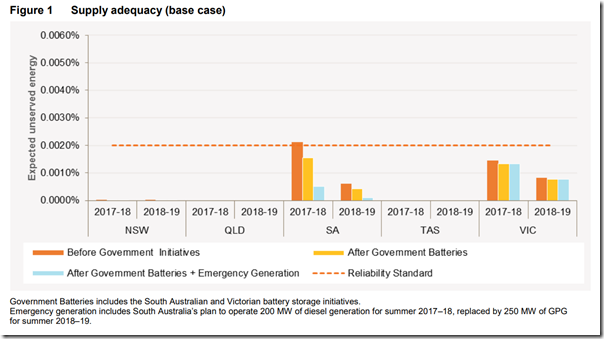
These measures would all be expected to significantly reduce USE and the likelihood of load shedding this summer. While the current ESOO does not quantify how much impact these measures might have, AEMO’s June 2017 Energy Supply Outlook (ESO) did assess the effect of similar measures on USE levels for the next two summers:
In the June ESO, the base USE levels for SA and Victoria (dark orange bars) were estimated at similar levels to the just-released ESOO, but the impact of the SA battery and temporary generators was to substantially reduce the USE level in SA, with a minor effect in Victoria (light blue bars).
It would be reasonable to expect that the RERT / DSR initiatives (not modelled in either the June ESO or this week’s ESOO) to have a substantial effect on USE levels and likelihood of load shedding this summer, given the amount of capacity being targeted, around 1,000 MW.
In conclusion, I think the best way to interpret USE measures and AEMO’s results overall is not to take them as definitive statements of how likely or how extensive any load shedding might be in coming summers – there are too many uncertainties still not captured in AEMO’s approach for that – but as relative risk indicators of supply-demand tightness in the power system.
Without the measures being taken by governments and AEMO to address these risks, AEMO’s results for this summer would indicate some justified anxiety. As we get closer to summer we’ll have a clearer view of progress on these measures (and whether anything else has changed), and a better sense of the real likelihood of any repeat of last summer’s load shedding.
About our Guest Author
 |
Allan O’Neil has worked in Australia’s wholesale energy markets since their creation in the mid-1990’s, in trading, risk management, forecasting and analytical roles with major NEM electricity and gas retail and generation companies.
He is now an independent energy markets consultant, working with clients on projects across a spectrum of wholesale, retail, electricity and gas issues.You can view Allan’s LinkedIn profile here. Allan will be sporadically reviewing market events here on WattClarity Allan has also begun providing an on-site educational service covering how spot prices are set in the NEM, and other important aspects of the physical electricity market – further details here. |


Leave a comment