There’s been a few different alerts warning about hot weather to come through until Tuesday 26th January 2021 (Australia Day, or Invasion Day, or just another day – depending on your preference).
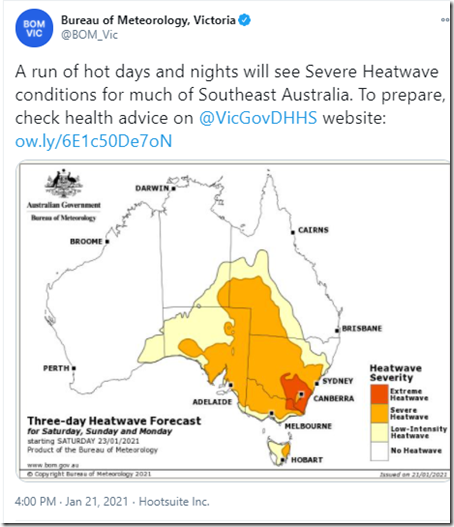
Yesterday’s tweet from the Bureau of Meteorology helpfully provided this map that indicated the geographical focus of where it is expected to be hot:
… but I also noted that Peter Hannam had written about it yesterday as ‘Health warnings as ‘intense’ heatwave to hit NSW until Australia Day’.
(A) High temperature notices for the NEM
More directly in the NEM, the AEMO issued Market Notice 082305 this morning at 10:34 that warned of forecast temperature being above ‘NEM Local Temperature Alert Levels’:
__________________________________________________
Notice ID : 82305
Notice Type ID : Subjects not covered in specific notices
Notice Type Description : MARKET
Issue Date : Friday, 22 January 2021
External Reference : NEM Local Temperature Alerts for SA, TAS, VIC from 22 Jan 2021 to 26 Jan 2021
__________________________________________________
AEMO ELECTRICITY MARKET NOTICE
AEMO’s weather service provider has issued forecast temperatures equal to or greater than the NEM Local Temperature Alert Levels for listed weather stations below.
SA
Adelaide West Terrace (39+ Deg C): 24th Jan
Clare High School (39+ Deg C): 23rd Jan, 24th Jan
Mt Gambier Ap (39+ Deg C): 24th Jan
Port Augusta Ap (39+ Deg C): 22nd Jan, 23rd Jan, 24th Jan
TAS
Launceston Ti Tree Bend (33+ Deg C): 25th Jan
VIC
Latrobe Valley Ap (39+ Deg C): 25th Jan
Melbourne Olympic Park (39+ Deg C): 25th Jan
Mildura Ap (39+ Deg C): 23rd Jan, 24th Jan, 25th Jan
The NEM Local Temperature Alert Levels are:
Launceston Ti Tree Bend: 33 Deg C, Dalby Airport: 37 Deg C, for all other selected weather stations: 39 Deg C.
AEMO requests Market Participants to:
1. review the weather forecast in the local area where their generating units / MNSP converter stations are located and,
2. if required, update the available capacity in their dispatch offers or availability submissions consistent with the forecast temperatures.
Further information is available at:
AEMO Operations Planning
For some context to these new type of Market Notices, refer to this prior article on WattClarity from 24th December 2020.
(B) Forecast impact on demand levels
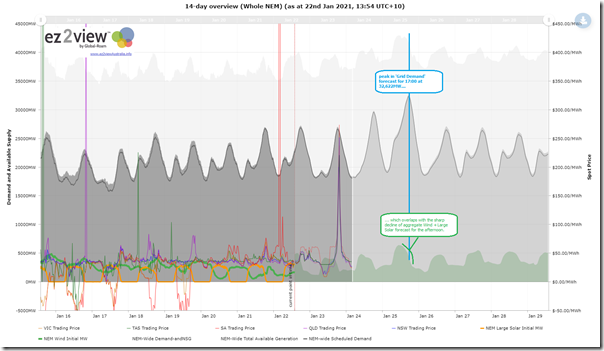
With reference to this pre-prepared trend query using the Trends Engine in ez2view online, we see that the forecast for whole of NEM ‘Grid Demand’ is currently forecast in ST PASA to reach 32,622MW at 17:00 (NEM Time) on Monday 25th January 2021:
(a reminder to click on any image for a clearer view)
Using the ‘Forecast Convergence’ widget in Installed ez2view we can drill into each region to see how successive forecasts are progressing:
(B1) SA demand peak forecast for Sunday 24th January 2021
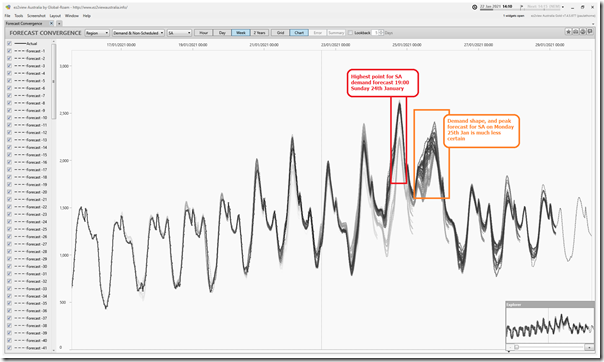
Here’s a chart-style view of the forecast peak for the South Australian region, from which we can see a number of things:
The most recent ST PASA run (published for 13:00 today) shows the highest point being 2,599MW for ‘Demand and Non-Scheduled Generation’ (i.e. forecast equating reasonably closely to what AEMO calls ‘Operational Demand’) at 19:00 on Sunday 24th January. From memory, this would be less than 1,000MW off the all-time maximum.
The demand shape, and hence the peak for Monday 25th January has more uncertainty shown in the trend.
(B2) VIC demand peak forecast for Monday 25th January 2021
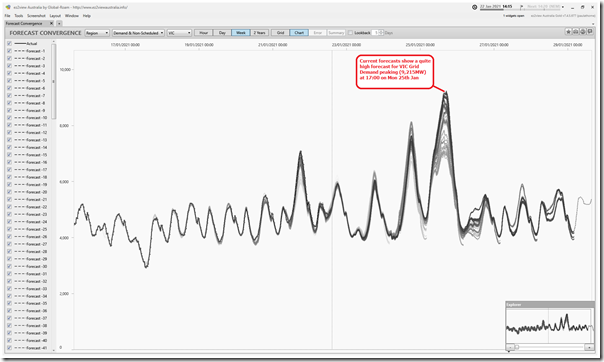
Here’s a chart-style view of the forecast peak for the Victorian region, from which a quite high relative level of demand forecast for the VIC region on Monday 25th January:
What’s perhaps more concerning, at this point, is that the successive ST PASA forecasts (now 1 hour apart) have been escalating the forecast for peak demand on Monday evening. The 13:00 ST PASA run today shows this at 9,215MW … which would be (if my memory is correct) 1,000MW or so below the all-time maximum.
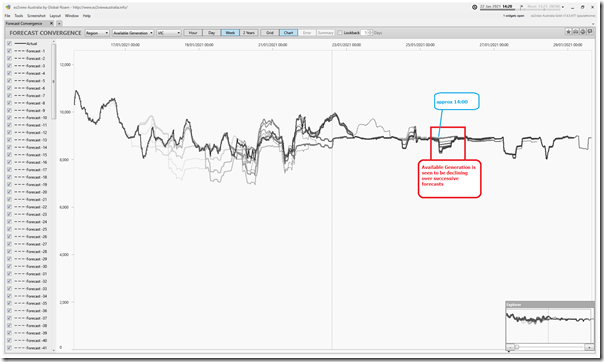
Flipping to look at Available Generation, we see that there have been some downgrades of capability coinciding with the escalating temperature forecasts for Monday afternoon/evening 25th January:
Part of the reason for the decline in capability coincident with the high temperature forecast would presumably be because of Scheduled and Semi-Scheduled generators de-rating their plant in their bids, as they are required to in conjunction with AEMO notices (see below). There may be other reasons, as well.
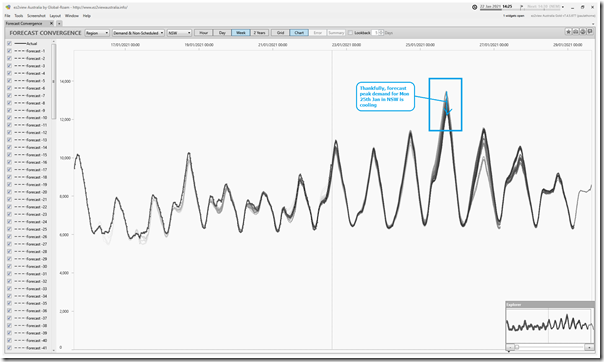
(B3) NSW demand peak forecast for Monday 25th January 2021
Here’s a chart-style view of the forecast ‘Demand and Non-Scheduled Generation’ for NSW:
(C) Forecast high-temperature impact on plant capability
Keeping in mind this context about the AEMO notices and noting the concerning drop in Available Generation capacity in the ‘Forecast Convergence’ chart above for Victoria, I thought this was another opportunity to open up the latest draft of the Generator Statistical Digest 2020 in order to check what we would be expecting to happen, with respect to different types of units.
We can do this because of the correlation charts (comparing AvailGen and Output with Local Temperature in bands of 2.5 degrees C) that are included for each individual DUID in each of the ‘B Pages’ attached with the GSD2020. Here are a quick sample:
(C1) Loy Yang A4 unit (Coal-Fired Unit)
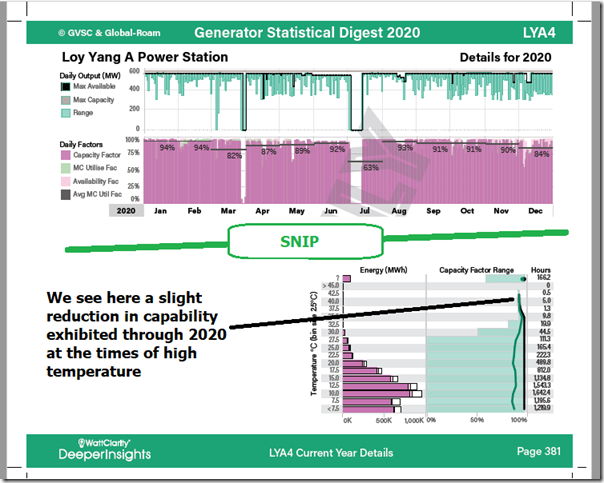
Here’s the chart for Loy Yang A4 unit:
Given the investigations we undertook earlier for the GRC2018, it’s not really a surprise to see the results above for Loy Yang A4. I notice that Loy Yang B units showed a somewhat different pattern … and I did not check Yallourn.
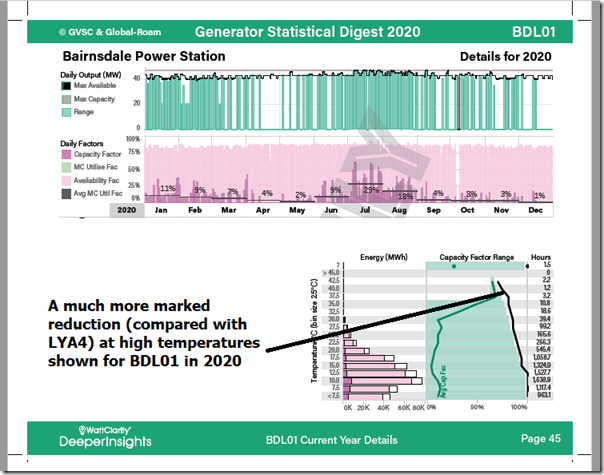
(C2) Bairnsdale Power Station (Gas-Fired Open-Cycle Unit)
An open-cycle gas turbine shows a different effect – like shown here for Bairnsdale unit 1:
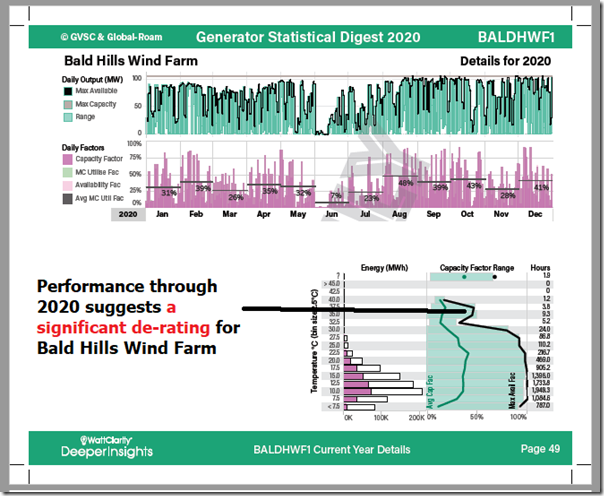
(C3) Bald Hills Wind Farm
Wind Farms are also affected by high temperatures – such as in the case of Bald Hills Wind Farm below:
(C4) Gannawarra Solar Farm
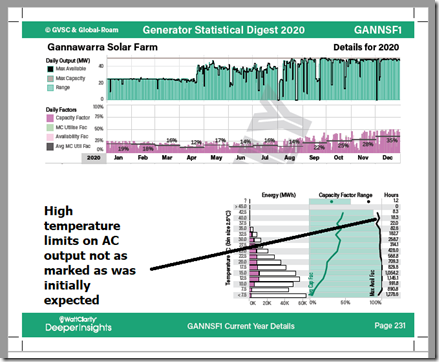
As discussed in the GRC2018, when thinking about the underlying high-temperature limits of the silicon in solar PV the (better-than-expected) performance of the commercial Large Solar Farms is initially a surprise, until we consider the higher Registered Capacity (i.e. maximum capability of the panels) to Maximum Capacity (i.e. lower capability of the inverters) used in most farms.
Here’s Gannawarra Solar Farm:
(D) What about plant maintenance?
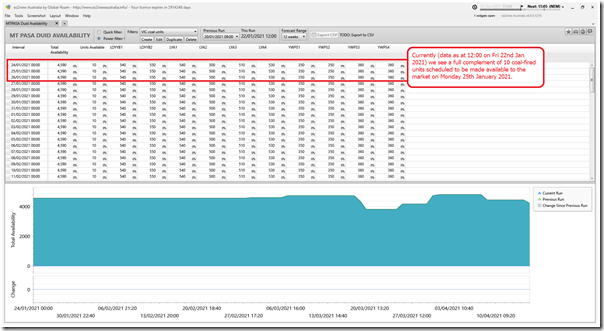
As noted in other recent WattClarity articles, version 8 of ez2view contains the new ‘MT PASA DUID Availability’ widget that makes visible the new data AEMO has been publishing since August 2020 (thanks to the AEMC’s approval of ERM Power’s rule change request discussed in earlier articles):
(D1) The Victorian coal unit ‘work horses’
For the 10 remaining coal unit work-horses in the Victorian region, we are able to see that the current data indicates all 10 are scheduled to be available for the demand peaks on Monday:
That’s good news, because it looks like they will all be needed!
(D2) What about forecast maintenance on Semi-Scheduled plant?
I use the term ‘work horses’ for the coal units because the 48 remaining units are still supplying the majority of the energy consumed in the NEM (in this article from Aug 2019 we noted how the GRC2018 showed coal units supplied ~75% of Grid Energy through calendar 2018 – will look forward to updating those stats for calendar 2020 in a GRC2020, time permitting) … but I can understand that the term might irk some people keen to see the energy transition accelerate.
As the share of energy supplied by Semi-Scheduled plant continues to grow as the energy transition continues at whatever pace, the need to view the same type of data for Semi-Scheduled plant will become increasingly, and then critically important.
However in their wisdom(?), the AEMC did not make the rule change cover the Semi-Scheduled plant – and so the AEMO are not publishing the same type of data there. Unless I am missing something, this seems (to me) just shoot-yourself-in-the-foot crazy!?


Leave a comment