Earlier today we noted that the ‘AEMO released 2024 ESOO on Thursday 29th August 2024’.
… in that article we pointed readers at the main documents, and are also building up a growing list of external references to the AEMO’s publications (in the media and on social media etc).
In this article, we’ll take a read through the ESOO itself, and highlight a number of things that jump out to us (some of which might drill further into later, in subsequent articles).
(A) Switch-a-roo with the Scenarios
A week ago today, Dan Lee wrote about ‘What the last twenty years of the ESOO tells us about blackout predictions’ … in terms of how some might use (and misuse?!) the projections being provided by AEMO.
… that article’s received a fair number of compliments – so well worth a read, if you have not already done so.
Some prior years have seemed like a royal flush for those playing ‘Blackout Bingo’ with news article headlines … whilst our early review of news headlines for the 2024 ESOO sees them much more subdued.
We’ve been reflecting on some of the factors contributing to that more mellow perception and wonder if some of it has come about ‘simply’ because of how the AEMO has chosen to order the various scenarios it has modelled:
| ESOO Year | The ‘Base Case’ Scenario | The ‘Sensitivity’ Scenario(s) |
|---|---|---|
|
2024 ESOO We’re collating articles here about the 2024 ESOO
|
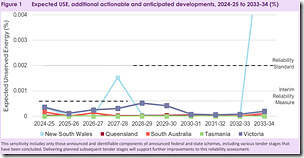
In this edition, the first scenario presented was called the ‘Federal and State Schemes sensitivity’. This one assumes: ‘existing, committed and anticipated developments to meet the ESOO Central demand forecast, delivered to the schedules advised by developers, as well as: • Actionable transmission investments and forecast growth in coordinated CER and flexible demand resources. • Firming and some renewable energy developments that have specific funding, development or contracting arrangements under federal, state and territory government schemes and programs. ’ .
As a result of the assumptions made, the Expected USE chart looks quite modest:
— Perhaps some might think of this scenario as the ‘Everything Goes Smoothly Scenario’. |
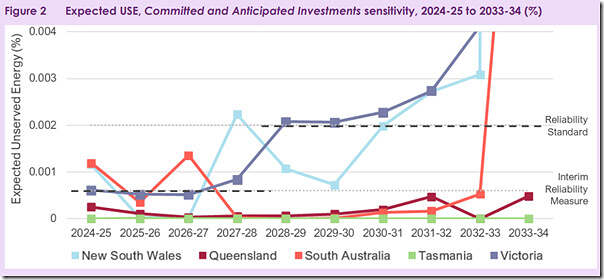
In this edition, the second scenario presented was called the ‘Committed and Anticipated Investments sensitivity’. This one assumes: ‘existing, in commissioning, committed and anticipated generation, storage and transmission projects, according to AEMO’s commitment criteria, as well as committed investments in demand flexibility and consumer batteries that are coordinated to minimise investment needs in utility-scale solutions.’ … and also … ‘allowing for historically observed commissioning delays’ … the Expected USE chart looks quite different:
— It’s worth noting that even this Scenario assumes the development of Anticipated projects … whilst in this recent article we illustrated how very different the situation might look on a NEM-wide basis looking at firming capacity if just assuming Committed (but not Anticipated) projects proceed. Compare/contrast that with the approach in prior years (below). |
|
2023 ESOO We’re collating articles here about the 2023 ESOO
|
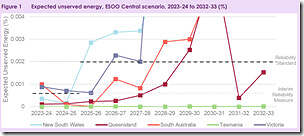
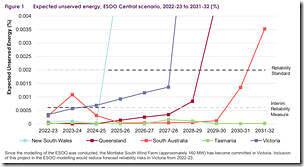
For this year, the first scenario presented was called the ‘ESOO Central scenario’, which assumed: ‘includes committed, in commissioning, and anticipated generation, storage and transmission projects, according to AEMO’s commitment criteria, as well as committed investments in demand flexibility and consumer batteries that are orchestrated to minimise grid requirements. Projects yet to reach final commissioning phases have been assumed to progress according to typical development, approval and commissioning timelines, which may be later than the dates advised by project developers’ … so there’s a significant differences to the assumptions made in the Base Scenario for the 2024 ESOO. In last year’s ESOO, the Expected USE chart was not as rosy as the one directly above: … but remember that the 2024 ESOO also contains dialled-down demand growth forecasts (and so on). |
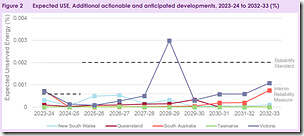
In the prior year ESOO the second scenario presented was called the ‘Federal and state schemes sensitivity’, which … ‘includes all developments in the ESOO Central scenario, delivered to the schedules advised by project developers, as well as: • Actionable transmission investments and forecast growth in consumer investments (orchestrated CER and DSP). • Firming and some renewable energy developments that have specific funding, development or contracting arrangements under federal, state and territory government schemes and programs.’
So, understandably, Figure 2 in that report showed a calmer outlook than Figure 1: Compare this to the scenario presented first in the 2024 ESOO … and which might gain most of the attention as a result? |
|
2022 ESOO We’re collating articles here about the 2022 ESOO
|
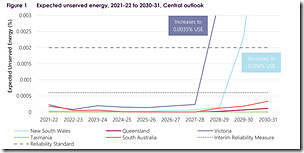
For this year, the first scenario presented was called the ‘ESOO Central scenario’, which assumed: ‘… based on existing and committed developments only’ … so note that there’s no mention of ‘Anticipated’ developments being in this scenario (compared to the Base Scenario in the 2023 ESOO for the following year). With these assumptions made, the Expected USE chart was as follows:
|
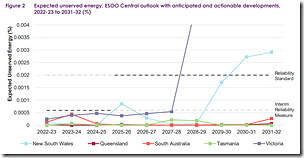
For this year, the second scenario presented was called the ‘ESOO Central outlook with anticipated and actionable developments’, which assumed: ‘… an additional 3.4 GW of anticipated investments are in the pipeline and will improve the outlook if they progress as planned. ‘Anticipated’ developments are projects which meet some of AEMO’s commitment criteria, but not enough criteria to be considered committed. When generation and storage classed as anticipated in the ESOO is considered alongside the anticipated and actionable transmission developments identified in the 2022 ISP7 , based on current schedules, the reliability forecast improves significantly. ’ With these additional assumptions made, Figure 2 in the 2022 ESOO looks better than Figure 1: |
|
2021 ESOO We’re collating articles here about the 2021 ESOO
|
For this year, the first scenario presented was called the ‘ESOO Central outlook’, which seems to take a similar approach as in this scenario in the 2022 ESOO (i.e. existing and committed developments only). With these assumptions made, the Expected USE chart was as follows:
|
There was no second scenario presented in the Executive Summary of the 2021 ESOO.
Reference to the ‘Years until a supply shortfall’ charts at the bottom of Dan’s article here will help readers understand why … i.e. the outlook in the 2021 ESOO was rosier than in the 2022 ESOO, and the 2023 ESOO (and now the 2024 ESOO).
|
I suspect that there’s some judgement calls involved in this re-ordering of the scenarios in the 2024 ESOO, but don’t know the details.
(B) Two focal points in time
Looking specifically at the 2024 ESOO (and the ‘Committed and Anticipated Investments sensitivity’ scenario, which I’d still think of as the ‘Base Case’) there’s two particular focal points in time:
B1) Summer 2024-25, which is imminent
For summer 2024-25 there’s going to be a particular focus … as:
1) it’s only 3 months away by the calendar (or actually feels like it’s here already in QLD in the last week of winter).
2) so there’s limited time for the AEMO to orchestrate responses. In the Executive Summary the AEMO wrote (p4):
‘AEMO will also take prudent action and seek to procure additional reserves for the coming 2024-25 summer, safeguarding consumers in a cost-appropriate manner’
… and
‘AEMO sought tenders from parties for out of market reserves in response to the May 2024 Update to the ESOO, and will tender for reserves in response to this ESOO.’
3) But it’s worth noting the following, also in the Executive Summary:
‘… the reliability of the NEM will rely primarily on on-time delivery of the new resources under development, and the continued availability and high performance of the existing generation fleet’
… with the ‘high performance’ jumping out to me (not a surprise, given that we’d already reported separately that the performance of the coal fleet had improved markedly to 30th June 2024.
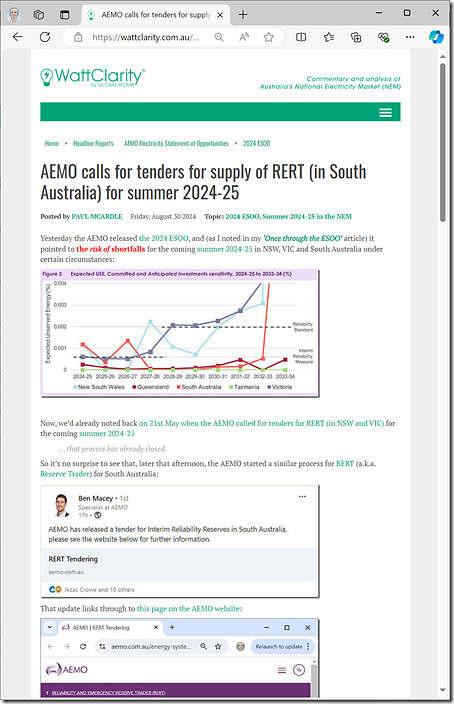
Given the above, it was not a surprise that the AEMO tendered for Reserve Trader for South Australia for the coming summer 2024-25 later that same day:
B2) Further out
Further into the future, there are more options available. On p11, the AEMO wrote:
‘Where this 2024 ESOO reliability forecast identifies a forecast reliability gap for a region, AEMO must request the AER to consider making a reliability instrument under Chapter 4A of the NER (Retailer Reliability Obligation [RRO]). In this 2024 ESOO, the forecast reliability gaps above require AEMO to request the AER to consider making the following RRO instruments:
• In New South Wales, a T-3 reliability instrument for 2027-28.
• In Victoria, a T-3 reliability instrument for 2027-28.’
<< what follows below – even moreso than above – is a work in progress, so please keep in mind! >>
(C) Questions about the Supply Side assumptions
In skimming through the ESOO on a first pass there are a number of questions that occur to me about the Supply Side (which will be explored in subsequent articles … time permitting). Here’s some quick notes:
(C1) To what extent is their delineation of VRE and Firming?
On Tuesday 27th August 2024 we wrote ‘(Update of) long-term trends of (the high points of) Aggregate Scheduled Target’ … with that metric being a reasonable guide to one aspect of the requirement for Firming Capacity (i.e. whose purpose is Capacity and Insurance) … separate from the supply of VRE (which is for Energy).
More generally, we wonder about the delineation between all aspects of ‘Anytime/Anywhere Energy’ and the complementary ‘Keeping the Lights on Services’.
More to come, time permitting…
(C2) What’s assumed for coal unit performance, moving forwards?
On Monday 26th August 2024 we wrote ‘Coal-fired unit performance has improved markedly from the ‘dog year’ that was 2022’
. But a year earlier we’d noted that ‘The 2023 ESOO report shows coal unit EFOR is still a significant factor’.
So, in reading the 2024 ESOO I have been particularly interested to see what the AEMO’s assumed in terms of coal unit performance (and closure dates as well) moving forwards.
Verging on falling into that rabbit hole through various linked documents, we prepared ‘What’s the 2024 ESOO assume, in terms of coal unit performance?’ as a linked article:
(C3) Weather scenarios and VRE performance
Given that we’ve just been through the 2024 Q2 wind drought (as the worst period since the 2017 Q2 wind drought) I’m particularly interested to see how this plays out, in terms of weather years modelled in the scenarios
More to come, time permitting…
(D) Questions about the Demand Side assumptions
Similarly, here’s some quick questions we’re looking to ascertain, about assumptions in relation to the demand side:
(D1) Changes to macro assumptions on demand growth?
In the Executive Summary it jumps out to me that (on p4) they write:
‘Several factors are driving the 2024 ESOO forecast to show an improved reliability outlook compared with the 2023 reports:
• << four other factors have been removed >>
• AEMO now projects lower growth in energy consumption and maximum demand for most NEM regions than was previously forecast. These forecasts continue to consider growth driven by the potential for electrification of household and businesses, the emergence of the hydrogen production industry, and forecast expansion of industrial facilities including the rapid development of data centres. The growth has, however, been moderated by lower electric vehicle (EV) and business consumption trends relative to 2023 forecasts. ’
So it’s understandable that I’d like to drill in further.
More to come, time permitting…
(D2) The future of Major Industrial Loads?
Given how we’ve been serving Major Industrial Loads for ~20 years (including by this form of Demand Response, and our ongoing association with the EUAA) we’re particularly interested to delve into what the AEMO assumes in terms of the future for major industrial loads
More to come, time permitting…
(D3) What’s assumed in terms of Data Centers?
In the quick skim, to date, we’ve seen commentary in several places about Data Center load.
Given that Dan Lee has been collating information about Data Centers in the NEM over this year with the objective (time permitting) of posting some analysis before the end of the year, we’ve compiled ‘What’s the 2024 ESOO say about Data Centres’ here:
For
More to come, time permitting…
(D4) Price responsive demand
In the detailed reviews of 2024 Q1 and 2024 Q2 (both recently released) we re-arranged Appendix 2 to provide a particular focus on what was observable in each quarter of price-responsive demand.
Back a year ago we’d also written ‘With the 2023 ESOO report, some real head scratching about Demand Response!’
For these (and other) reasons we will be particularly interested in delving into what we can see about this in the 2024 ESOO.
More to come, time permitting…
(E) Questions on Network assumptions
A couple years ago we flagged this specific challenge when covering ‘What’s next for market modelling’ as Key Observation #6 within GenInsights21 a few years ago now!
… specifically we wrote (in 6.5) ‘Modelling System Normal is not enough’.
With respect to the 2023 ESOO we noted that ‘The 2023 ESOO report clarifies why the transmission model only includes ‘System Normal’ – and why it’s a simplification’. Has the approach changed, since that time?
This came to mind again when writing ‘Questions, and implications, about transmission system failure?’ in this article, in response to the transmission failure on 13th February 2024.
(F) More generally, about the model itself
Last year we’d also written here about how ‘Modelling is (still) a Mug’s Game’.
We’ll be reviewing with interest to read from this perspective, as well.


Why does the ESOO state that “These systems [rooftop solar] do not tend to contribute to lowering the scale of peak demands during extreme hot conditions in the summer..”?
Geoff Eldridge wrote on here in February about the new NEM peak of 38.6GW on 22/02/2024, of which ~8GW was coming from rooftop solar. Finding this fact hard to square with the ESOO statement.
I think you’ll find that both are talking about different measures of demand.
1) Geoff is talking about ‘Underlying Demand’ or ‘Native Demand’ (not quite the same as each other, but similar)
2) The AEMO most cares about ‘Grid Demand’. Because rooftop PV has already shifted the time of peak Grid Demand to evening periods after sunset (in summer and winter), adding more rooftop PV has no additional benefit of reducing peak Grid Demand further.
To understand more read this explainer:
https://wattclarity.com.au/articles/2018/04/an-explainer-about-electricity-demand-take-1/