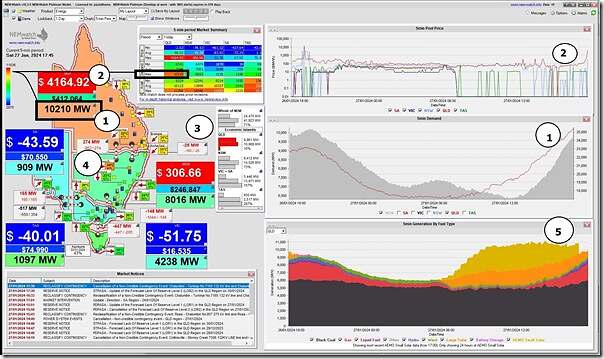
Here’s a snapshot from NEMwatch at 17:45 highlighting that the ‘Market Demand’ in the QLD region has reached 10,210MW … and looks set to climb further:
With respect to the numbering:
1) The ‘Market Demand’ in the QLD region has reached 10,210MW:
(a) Which is out of the ‘Orange Zone’ and heading to the ‘Red Zone’ which had its maximum point reset on Monday 22nd January 2024 as a result of the massive new peak demand level set;
(b) But it’s worth reflecting that 10,210MW would have been a new all-time maximum … except that Monday 22nd January was massively more!
i. On a Saturday evening in the middle of a long weekend; and
ii. When there’s a considerable numbers of customers in the dark following TC Kirrily that crossed the coast near Townsville on Thursday 24th January (as Jennifer Brownie reminds us here earlier today).
2) This is also the first dispatch interval with the spot price exceeding $1,000/MWh … so the SMS alerts (triggered by ez2view) have started up.
3) The IRPM of the QLD-only ‘Economic Island’ is down in the red zone level:
(a) With net ‘Market Demand’ of 9,961MW (i.e. a little lower because of some net supply from NSW);
(b) Being supplied from Available Generation of 10,908 MW
(c) Meaning a local surplus of only 947 MW
(d) Or an Instantaneous Reserve Plant Margin of only 9.5% (rounded up to 10% on the display)
4) This caused by constrained flow…
(a) QNI flow constrained north at a relatively low level; and
(b) Directlink actually constrained so it must flow south.
5) In conjunction with higher demand (as noted above) and the setting of solar generation.
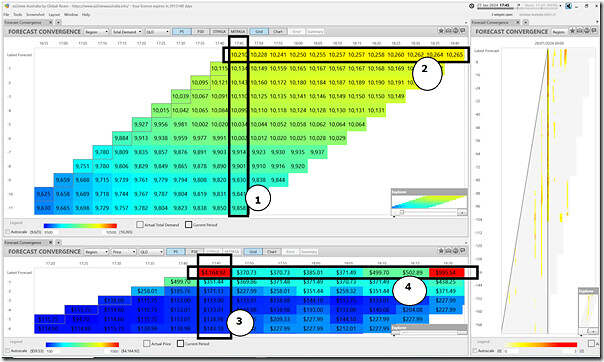
Worth providing an updated view of the 3 x ‘Forecast Convergence’ window in ez2view, focused on QLD … but now zoomed into the near-term P5 predispatch forecasts for price and demand:
With this image, there are 4 notes:
1) ‘Looking up a vertical’ we see that the ‘Market Demand’ achieved at 17:45 was higher than earlier P5 predispatch forecasts;
2) Which means, looking out to the left (into the current P5 forecast) some uncertanty about whether these forecasts are too low;
3) ‘Looking up a vertical’ we see that the price was not seen in earlier P5 forecasts (though some price action had been expected in this morning’s P30 forecasts)
4) Looking out to the left, prices were forecast to subside …
… but what actually happened?


With all the extra renewables there seems to be no problem. The sooner the coal fired and gas power stations are shut down the better.$1000 MWh would seem to be unsustainable.