A short article late on Friday 29th December 2023 to follow yesterday’s articles:
1) Firstly recapping how QLD demand reached 9,753MW on Thursday evening as the sun was ramping right down.
2) Secondly yesterday looking at demand was forecast to be higher on Friday evening.
(A) Queensland ‘Market Demand’ above 9,700MW
Yesterday the ‘Market Demand*’ in QLD reached 9,753MW at 17:55 (NEM time) …. which I noted was pretty remarkable given a number of factors, including:
* note that you can read here about the gory details of how there are different measures of demand:
i. AEMO normally talks about ‘Operational Demand’ …
ii. but market participants would rather look at ‘Market Demand’, as it better relates to market outcomes (e.g. dispatch, most importantly – but also prices as well).
1) First and foremost being a very ‘sleepy’ period between Xmas and New Year when many businesses (and schools etc) are on holidays.
2) But secondly because of power still being out to a number of areas:
(a) In south-east Queensland as a result of the storms over Xmas; and
(b) Possibly still in Far North QLD following the flooding events caused by TC Jasper.
So it was with interest we watched what happened today …
(A1) Queensland demand reached high levels
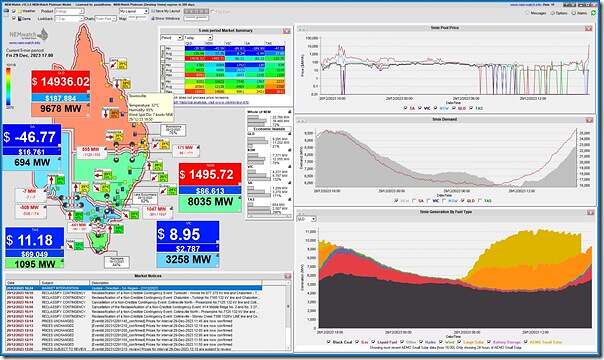
Here’s a snapshot from NEMwatch at 17:00 with a couple interesting things to note:
With respect to this dispatch interval:
1) The spot price in QLD has spiked up towards the Market Price Cap in QLD (at $14,936.02/MWh).
2) At this point the ‘Market Demand’ is sitting at 9,678MW:
(a) as demand is accelerating quickly as the afternoon/evening decline of solar (rooftop PV and then Large Solar) begins to accelerate.
(b) but this is actually 323MW lower than the demand five minutes beforehand (i.e. 9,701MW at at 16:55) … perhaps as a result of some demand response anticipating the higher prices?
3) Prices are also stretched in NSW, with NSW supporting QLD via exports north at a constraint limit … but similarly constrained on its draw capability from VIC.
(A2) QLD demand with respect to forecast
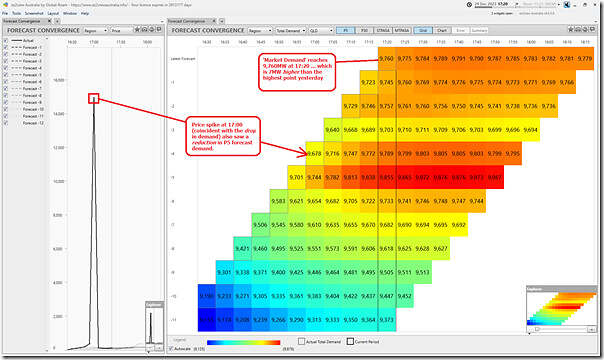
In the ‘Forecast Convergence’ snapshot from ez2view at 17:20 focusing on AEMO’s P5 predispatch data highlights a couple of things:
In particular note that:
1) From the 17:00 dispatch interval (i.e. coincident with the price spike captured in NEMwatch above) we see:
(a) The drop in ‘Market Demand’ fro m 17:55 to 17:00; and also
(b) A re-adjustment downwards of the forecast demand pattern for the subsequent dispatch intervals …
(c) … though this has since been adjusted back upwards
2) Also see the demand level hit 9,760MW at 17:20 … which is 7MW higher than the highest point yesterday.
(B) Supplies stretched
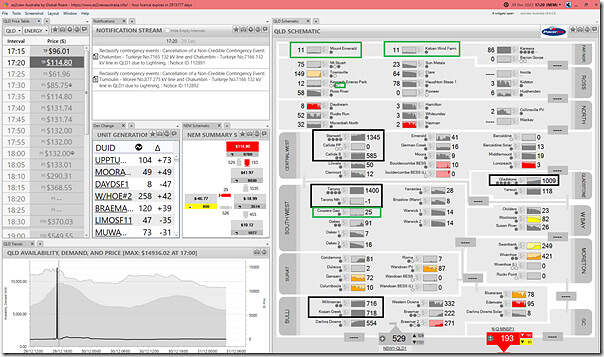
Let’s start with this snapshot from ez2view Time-Travelled back to* the 17:20 dispatch interval we can see who was generating what across the QLD region:
* so showing ‘end of interval’ FinalMW values to better line up with price outcomes.
(B1) Peak demand coinciding with low wind
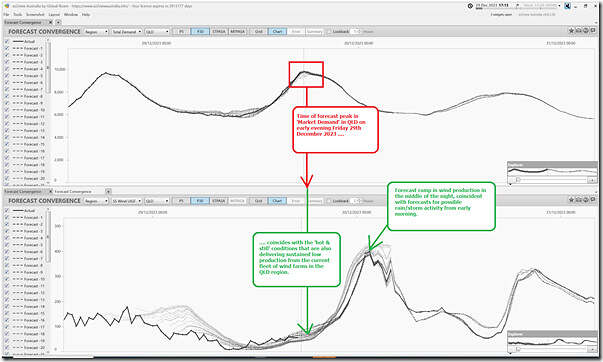
In the ‘Forecast Convergence’ snapshot from ez2view as we clocked 17:15 we can see that the time of peak ‘Market Demand’ coincides with just the start of a ramp up in wind production capability in the grid.
Very hot, and still!
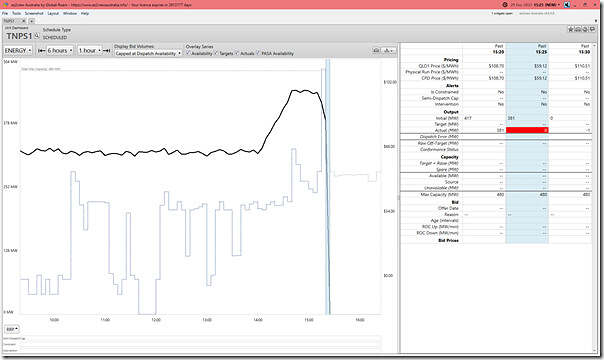
(B2) Trip at Tarong North
At the 15:25 dispatch interval, the Tarong North supercritical coal fired unit tripped, as shown here:
Should be obvious to note that this was not planned in advance.
PS1) where did the demand actually land?
As I type this note, it appears that the highest point for the ‘Market Demand*’ in QLD today might be at 9,773MW for both the 17:30 and 17;35 dispatch intervals … which would be 20MW higher than yesterday (by that measure).
——————————-
Remember the gory details (referenced above) of how there are different measures of demand:
i. AEMO normally talks about ‘Operational Demand’ …
ii. but many market participants would rather look at ‘Market Demand’, as it better relates to market outcomes (e.g. dispatch, most importantly – but also prices as well).
——————————-
For those who want to talk in terms of ‘Operational Demand’, then:
1) Yesterday the peak appears to be 9,690MW for the half-hour period ending 18:00
2) Today the perk appears to have been higher, at 9,750MW for the half hour period ending 17:30


Be the first to comment on "Queensland electricity demand climbs higher still, on Friday 29th December 2023"