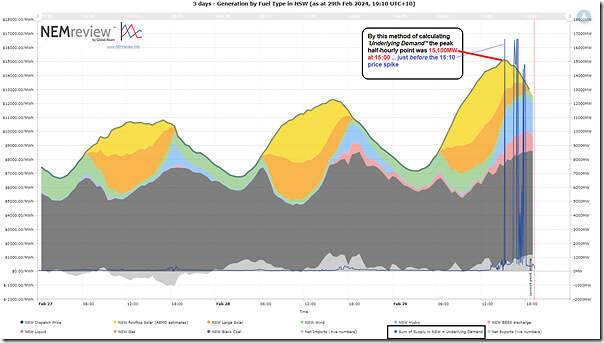
Curiosity got the better of me, so I used NEMreview v7 to put together this 3-day view of the supply stack in NSW … including:
1) FinalMW for all Fuel Types for data published by AEMO; plus also
2) Net Imports (targets) from VIC and QLD; plus also
3) AEMO’s estimates for rooftop PV (keeping in mind that there are actually invisible in real time, so all anyone has are estimates).
… plus I had to do some magic because the AEMO rooftop PV estimates are half hourly and yet the other data is metered generation at a 5 minute cadence (or target flows at a 5 minute cadence for the 3 interconnectors in question).
So the resulting chart here is of 30 minute cadence (i.e. the best ‘common’ resolution):
Those with a licence to the NEMreview software can open their own copy of this query here.
We can clearly see that Thursday 29th February 2024 was a much bigger day in NSW than the 2 prior days, in terms of electricity consumption.
Adding up all the supply side contributions I’ve noted an estimate for ‘Underlying Demand’ and note that, using this estimate, the peak point was at 15,100MW in the half hour ending 15:00 … which is incidentally just prior to this first price spike at 15:10.
But wait, what’s all this about the different measures of demand?
Just in two sequential articles here on this site, I have seen that:
1) ‘Underlying Demand’ peaked at 15,100MW in the half hour ending 15:00; and yet also
2) You also just read on WattClarity that ‘NSW ‘Market Demand’ peaks at 13,764MW’ (in the 16:35 dispatch interval).
3) Furthermore, elsewhere there are other measurements and high points as well – including at least:
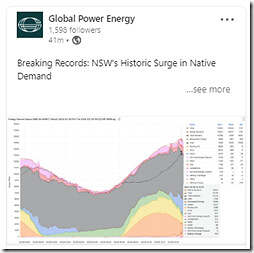
(a) Adding numbers up by a different method, Global Power Energy on LinkedIn here says that ‘Native Demand’ peaked at 15,606.7 MW at 15:10:
Well done to the team at GPE for explaining their method, as foll0ws:
‘Native Demand (or Underlying Demand) represents the Total Demand plus Non-Scheduled Generation and the output from behind-the-meter Rooftop PV. The Rooftop PV figure is an interpolated 5-minute value, derived from estimated 30-minute Rooftop PV data.
Currently, we utilise a basic interpolation method to ascertain 5-minute values for Rooftop PV. While we acknowledge this method is not ideal, it is necessary due to the limitations in the data provided by AEMO.
This approach, albeit a compromise, enables us to construct a more comprehensive picture of electricity demand. It incorporates the significant, yet often underrepresented, impact of distributed energy resources like rooftop PV.’
… so it’s a different method than mine in a couple ways.
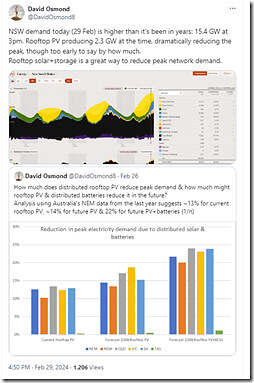
(b) Also today, David Osmond uses OpenNEM here on Twitter to say that the demand peak (he does not give a specific name for the measure) peaked at 15,400MW at 15:00.
I’ve not specifically looked at the OpenNEM method.
(c) It may well be later that the AEMO comes along and talks about ‘Operational Demand’.
(d) And there may well be others…
So it’s no wonder you might be confused!
A panadol, or an explanation?
You might let these measurements do your head in … or you could take a panadol and lie down … or you might choose to read through ‘An explainer about electricity demand [take 1]’ from April 2018 that provides the start of an explanation!
The key takeaway was that demand was big today in NSW, however you measure it!


Using AEMO’s own Operational Demand and Rooftop PV tables gets a value of 15,088 MW for the half-hour ending 15:00, close enough to your 15,100 MW Paul. David Osmond’s figure of 15,400 MW from OpenNEM seems very high, perhaps it’s based on 5 minute data and a different PV source (eg APVI).
I made some fairly detailed comments on a LinkedIn post by Geoff Eldridge of Global Power Energy that went into the basis of AEMO’s Underlying Demand figures and how they might differ from others’.
(https://www.linkedin.com/feed/update/urn:li:activity:7166574564234252288?commentUrn=urn%3Ali%3Acomment%3A%28activity%3A7166574564234252288%2C7166577230486204417%29&replyUrn=urn%3Ali%3Acomment%3A%28activity%3A7166574564234252288%2C7166610652499795968%29&dashCommentUrn=urn%3Ali%3Afsd_comment%3A%287166577230486204417%2Curn%3Ali%3Aactivity%3A7166574564234252288%29&dashReplyUrn=urn%3Ali%3Afsd_comment%3A%287166610652499795968%2Curn%3Ali%3Aactivity%3A7166574564234252288%29)