It’s much cooler today in Queensland (at least in the south-east corner), which is one of the main reasons why demand is not going to reach the same heights as the last two days:
1) On Thursday 28th December 2023 we QLD demand reached 9,753MW at 17:55 on Thursday evening as the sun was ramping right down:
(a) So only 366MW below the all-time maximum level for that ‘Market Demand’ measure (which was 10,119MW set for the dispatch interval ending 17:30 on Tuesday 8th March 2022)
(b) and ‘Operational Demand’ reach 9,690MW for the half-hour period ending 18:00
2) On Friday 29th December 2023 we saw ‘Market Demand’ reach 9,773MW at 17:30 and 17:35:
(a) So 20MW higher than the day before … and hence only 346MW below the all-time maximum level for that measure.
(b) and ‘Operational Demand’ reach 9,750MW for the half hour period ending 17:30
These were remarkable results, given a number of considerations:
1) First and foremost being a very ‘sleepy’ period between Xmas and New Year when many businesses (and schools etc) are on holidays.
2) But secondly because of power still being out to a number of areas:
(a) In south-east Queensland as a result of the storms over Xmas; and
(b) Also in pockets of Far North QLD following the flooding events caused by TC Jasper.
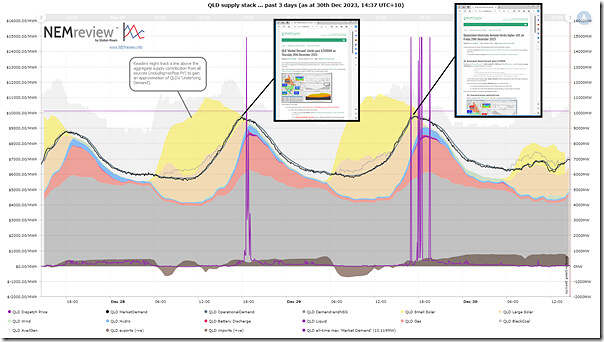
Using our NEMreview v7 software, I’ve constructed this stacked trend of contributions to the QLD supply stack over the past 3 days:
Those with a licence to that software can open their own copy of that query by clicking through on that link here.
These charts:
1) Are a useful illustration of how the peak level of ‘Market Demand’ occurred on both days in the hour leading to 18:00 (NEM time):
(a) during which time there’s still a summer-time contribution of solar
(b) remember that the contribution of both types is different:
i. Large Solar can help to meet ‘Market Demand’,
ii. whereas Rooftop PV is invisible (remember the yellow shape above is an estimate!) and does not – but rather reduces ‘Market Demand’ itself.
2) After the point of peak ‘Market Demand’:
(a) During summer in QLD this measure can (depending on the day) remain suspended at a high level for another 60-120 minutes after then as the more rapid decline in rooftop PV more than offsets a slower decline in ‘Underlying Demand’.
(b) Whilst Market Demand remains high during this period we see the sizeable decline of the contribution of Large Solar.
(c) That’s why we see most of the spot price volatility in QLD yesterday occurring after the point of highest Market Demand (i.e. as there are fewer supply options remaining to meet this still-high level of Market Demand).
3) Note that I’ve shown imports from NSW as positive additions to the supply stack, whilst exports are negative numbers shown under the bottom axis.
That’s all for now.


Leave a comment