On the weekend I noted that we were delving into more details about ‘Aggregate Scheduled Target’ on a NEM-wide basis, and specifically with respect to what’s happened through Q3 – to update Appendix 4 within GenInsights Quarterly Update for 2023 Q3.
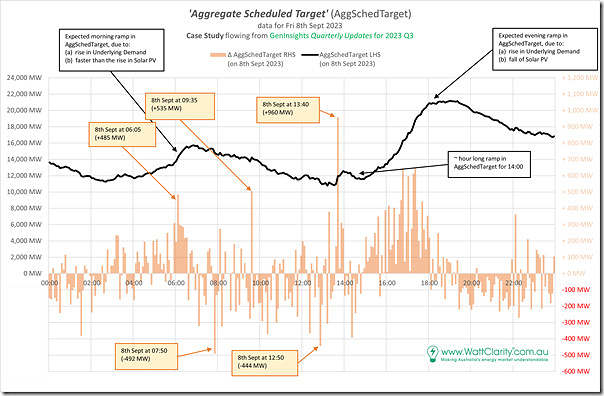
There were a number of things that jumped out in this analysis – including a significant 5-minute ramp in AggSchedTarget (+960MW from 13:35 to 13:40) on Friday 8th September 2023. This is shown in the following view for the day:
I’ve posted this as a ‘Part 1’ of a (somewhat cryptic) Case Study that we might have time to extend on later (e.g. as a ‘Part 2’ in a series, and so on).
Some (very brief) context
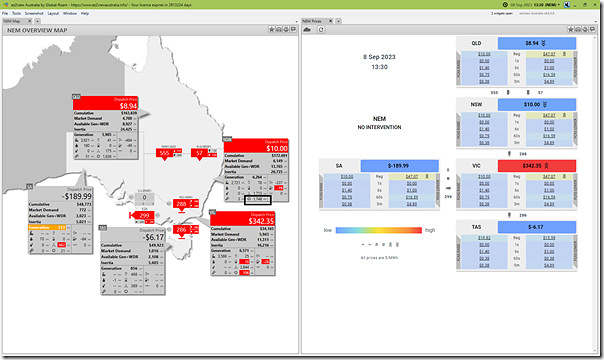
For now, I just wanted to add in three ez2view snapshots, Time-Travelled back to 13:30, 13:35 and 13:40 on the day of interest. Remember that when Time-Travelled the DUID-related output data reverts to ‘Final MW’ to align with prices:
Friday 8th September at 13:30
Here’s a view of some of what was happening in the market for the 13:30 dispatch interval (i.e. 5 minutes before the ramp in AggSchedTarget starts):
One thing that particularly jumped out to me in this series is the significant drop in aggregate output from Large Solar in NSW over a 10 minute period.
… I’ve not investigated any further, but this might be a one part of the reason why fully Scheduled units were asked to dispatch more.
Aggregate Large Solar output in NSW = 1,748MW (metered at ~13:30).
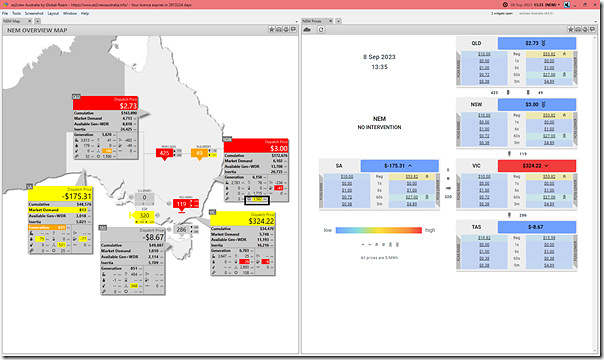
Friday 8th September at 13:35
Stepping forward to the 13:35 dispatch interval we see the following:
NSW region price has dropped $7/MWh, and is barely positive.
Aggregate Large Solar output in NSW = 1,582MW (i.e. down 166MW).
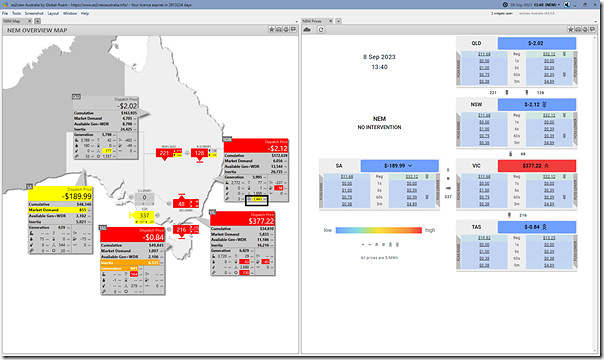
Friday 8th September at 13:40
Stepping further forward, to the 13:40 dispatch interval:
NSW region price has dropped, just below $0/MWh.
Aggregate Large Solar output in NSW = 1,443MW (i.e. down another 139MW).
That’s all for now….


Leave a comment