Recent discussions and long-term modelling suggest that wind farm capacity factors are on an upward trajectory. Much of this optimism is attributed to technological improvements that should enhance efficiency in theory, such as turbine blade design improvements, increased hub heights, and more sophisticated modelling techniques for site selection and site layout. A recent paper suggests that these ‘bigger and better’ advancements will increase efficiency by as much as 25 percent.
As wind has been in the NEM’s generation mix for the best part of two decades, I was intrigued to understand if that had been the case historically, and what underlying aspects are influencing this.
Expectations for improvement
Regular readers may be aware of my previous efforts to demonstrate why capacity factor is a metric that is becoming increasingly over-simplistic and overly-discussed. Whilst I strongly believe that to still be the case, capacity factor has nevertheless become an important input assumption for large bodies of work – such as the CSIRO’s GenCost report and the AEMO’s Integrated System Plan. These reports in themselves are influential and shape the way that many people understand where the industry is heading.
These long-term models occasionally take an opinion about how capacity factors will evolve over time. And particularly for the wind generation fleet, some assumptions have been made that these will increase materially in the coming decades.
For example, the CSIRO’s annual GenCost report attempts to calculate a Levelised Cost of Electricity (LCOE) for each generation type – another metric we’ve previously discussed as similarly popular, but limited. In the 2019-20 edition of this report, the CSIRO assumed a significant increase in the average capacity factor of wind farms in Australia from today’s levels, by modelling average capacity factor to be 44.4% for onshore and 54.2% for offshore in 2050. Since then, the CSIRO have moved to provide LCOE estimations under a broader range of scenarios. In their latest report for 2022-23, the ‘low LCOE assumption’ (i.e. best-case scenario) assumes a capacity factor of 48% for onshore and 61% for offshore in 2050, whilst the ‘high assumption’ assumes capacity factors much closer to current levels.
Paul has recently provided some context about these assumptions. Like always, seasoned market analyst Allan O’Neil was quick to comment on that article and provide useful insight about the limitations and complexities in foreshadowing capacity factor. But one specific comment from Allan provoked me to think about how the wind generation fleet has evolved:
“The existing fleet is up to 20+ years old (with its underlying design parameters even older) so we would obviously not expect that fleet to deliver to new-build levels, not even closely. Today’s electric cars probably perform a lot better than whatever you could buy five or even three years ago.”
What the data is saying
In order to test whether we are on a path of improving efficiency, I thought to examine how capacity factors for wind farms in the NEM have evolved over the past two decades.
In the animation below I’ve progressively charted the annual average capacity factor of each of these units starting in 2006. As more units connect, you should be able to compare the factors of new projects against incumbents.
Note: Capacity factors plotted by unit. Only units with a maximum capacity of 30MW or greater are included.
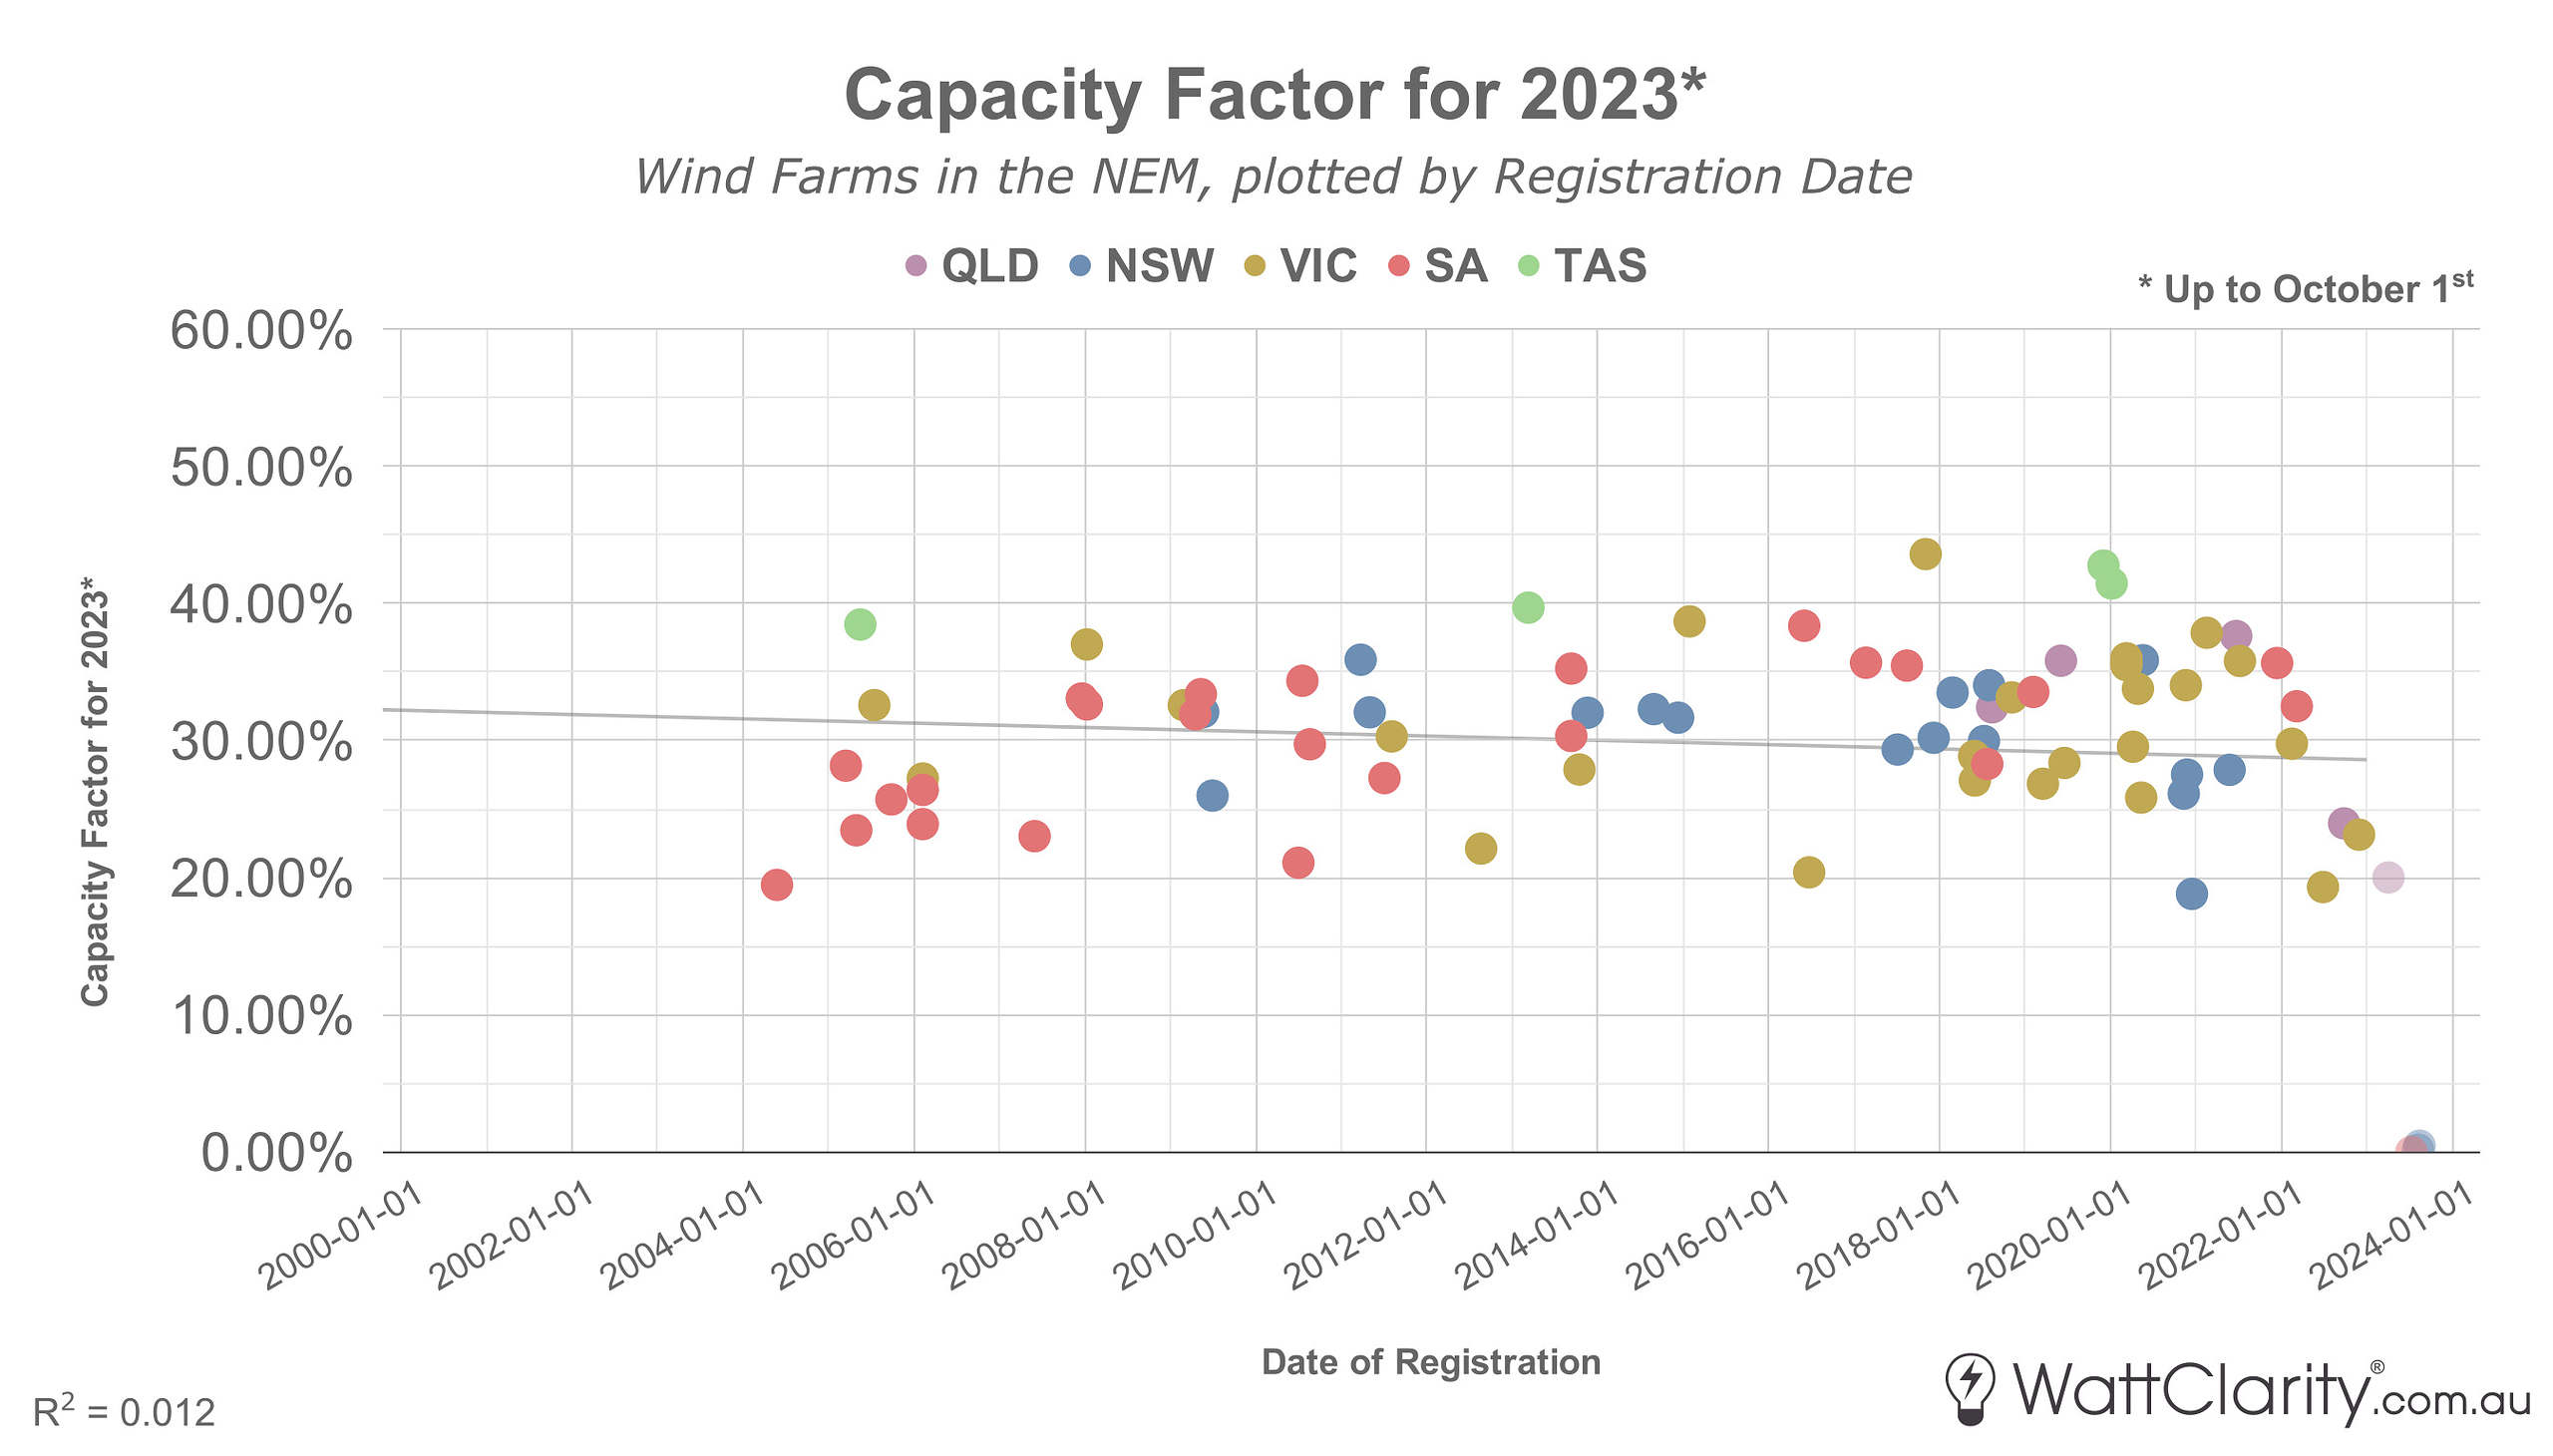
Although there are individual years where capacity factors have trended upwards, or even downwards, there appears to be no consistent trend that newer wind farms have been yielding a higher utilisation than those built in previous years (or even those built in previous decades).
South Australia looks to be the only exception, although the underlying cause remains unclear without more comprehensive examination. It could be argued that in other regions, capacity factors for newer wind projects may even be slightly diminishing with time.

There is no conclusive evidence that newer wind projects are delivering higher capacity factors across the NEM.
Notes: Data only up to October 1st 2023. Trendline and r-squared value calculated only for units registered prior to the start of 2023.
Wind farms typically yield a lower output during commissioning phase, and hence their capacity factor is temporarily lower than typical. In order to account for this effect to some degree, I have excluded units that were registered part-way through 2023 from the calculated r-squared value and trendline in the chart above.
Scaling up
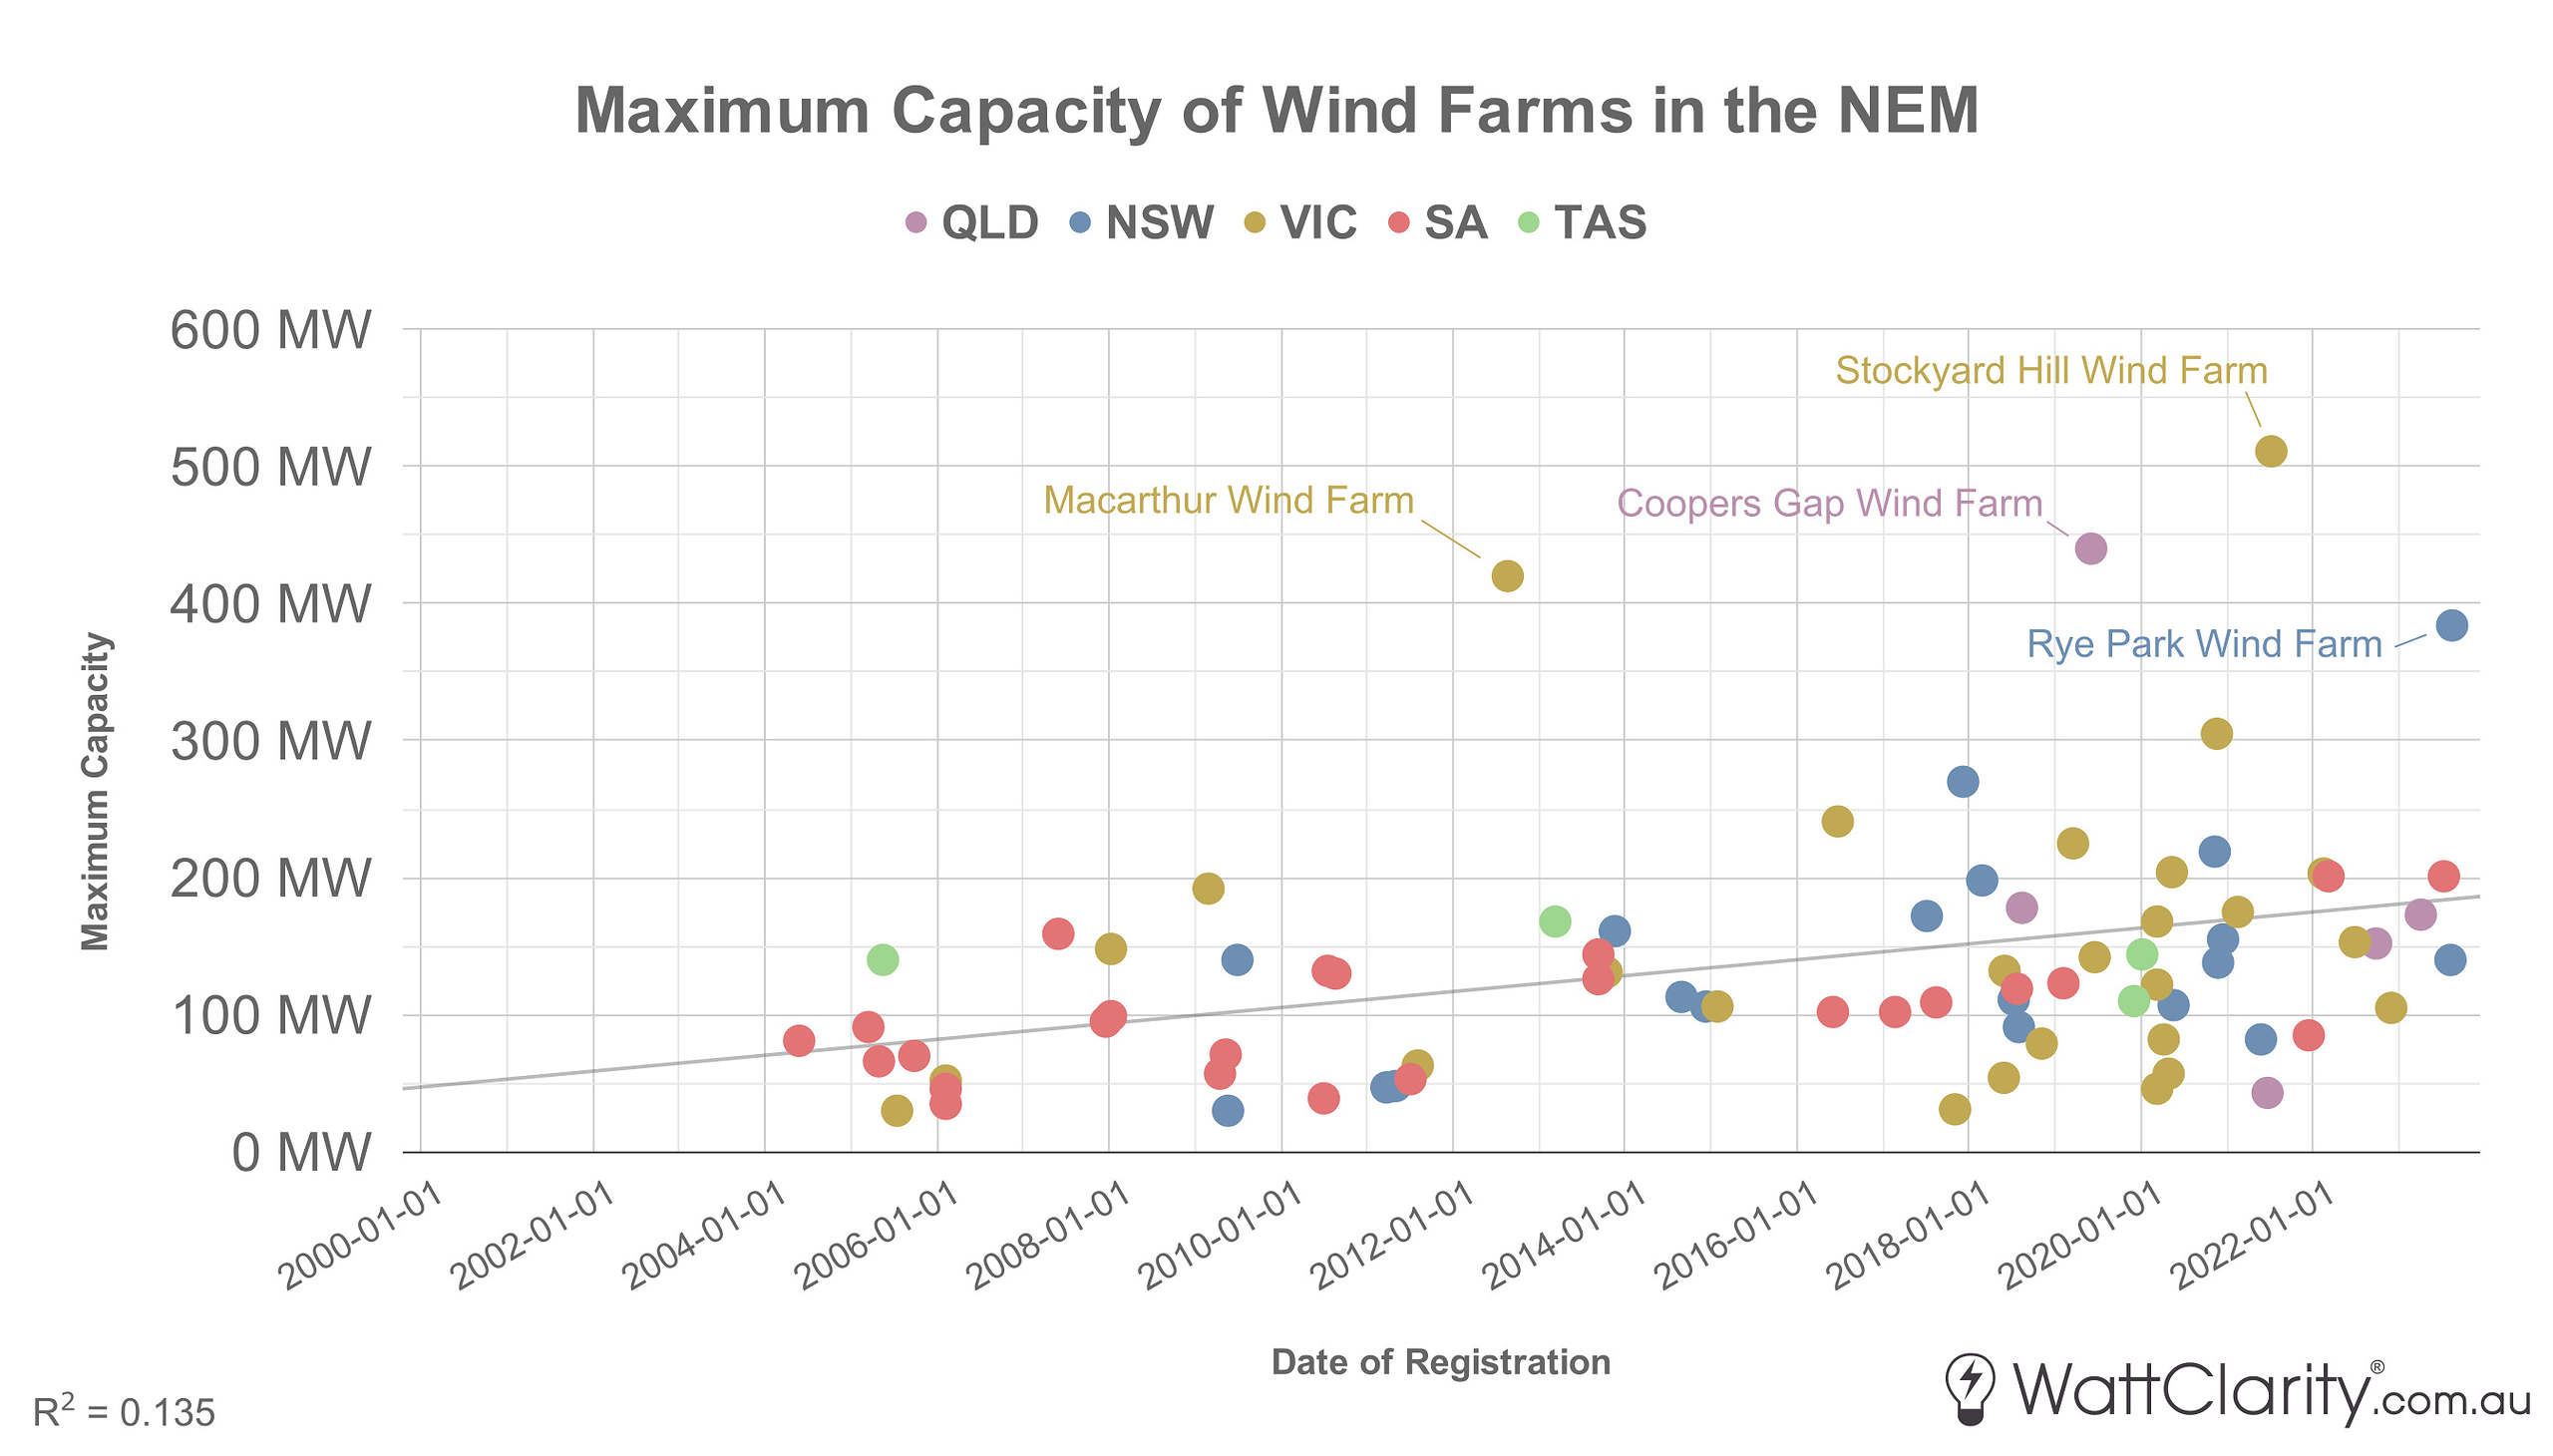
One trend that is more pronounced within the development space, is that the number and size of projects have been increasing steadily. The chart below shows the increase of max capacity for these units, and shows the increase in projects with capacities above the 200MW mark in recent years.

Capacities of wind units across the NEM have been slowly trending upwards over the past twenty years.
Source: Generator Statistical Digest 2022.
Note: Maximum capacity plotted by unit. Only units with a maximum capacity of 30MW or greater are included.
When weighted for each unit’s maximum capacity, the NEM’s wind generation fleet had a collective capacity factor of 31.04% in 2022, and 30.93% so far in 2023 (up until October 1st). That is a far way away from the 40%+ capacity factors assumed in those models discussed above.
Why are capacity factors flattening out?
Whilst some may have expected efficiency to have improved with recent technological advancements, there are a number of counter-factors that are likely to have contributed to this flattened trend including, but not limited to:
- Site scarcity. As new wind farms get developed, the pool of undeveloped sites that are optimal for wind resource and network location may be diminishing.
- Curtailment due to economic reasons. This may be having an effect, particularly considering the increase in incidences of negative prices in recent times.
- Curtailment due to network constraints. Also referred to as ‘forced curtailment’, Allan explored the overall impacts of this factor on wind and solar units earlier this year.
- The increasing value of wind diversity. As we move through the energy transition, I would expect that the value of diversification of sites should increase over time (from both a portfolio, and a system security perspective). Therefore, as developers may not necessarily focus their effort on harvesting the most optimal wind resources available, this may have a small but albeit negative effect on wind capacity factors in aggregate. Our previous work assessing the diversity and correlation of wind speeds across the NEM has explored this topic.
Other aspects such as capital cost optimisation, and avoidance of FCAS regulation costs during extreme events, should also be considered.
Key Takeaways
Capacity factor is a popular, but far from a comprehensive metric. Further analysis into availability, revenue, bidding volumes. etc. is needed to help separate some of the underlying technical and operational elements at play. However, there should still be some clear takeaways from this analysis:
- Bigger doesn’t always mean better. Whilst the number and size of new wind projects in the NEM are increasing, there is no conclusive proof that capacity factors for newer wind farms are significantly improved over wind farms constructed 5, 10 or perhaps even 15 years ago.
- Capacity factor: the factors and counter-factors underneath matter. Whilst it may certainly be the case that newer projects have benefited from technological advances, counter-factors such as site scarcity, curtailment, etc. appear to be balancing out any efficiency gains in this regard.
Further Reading
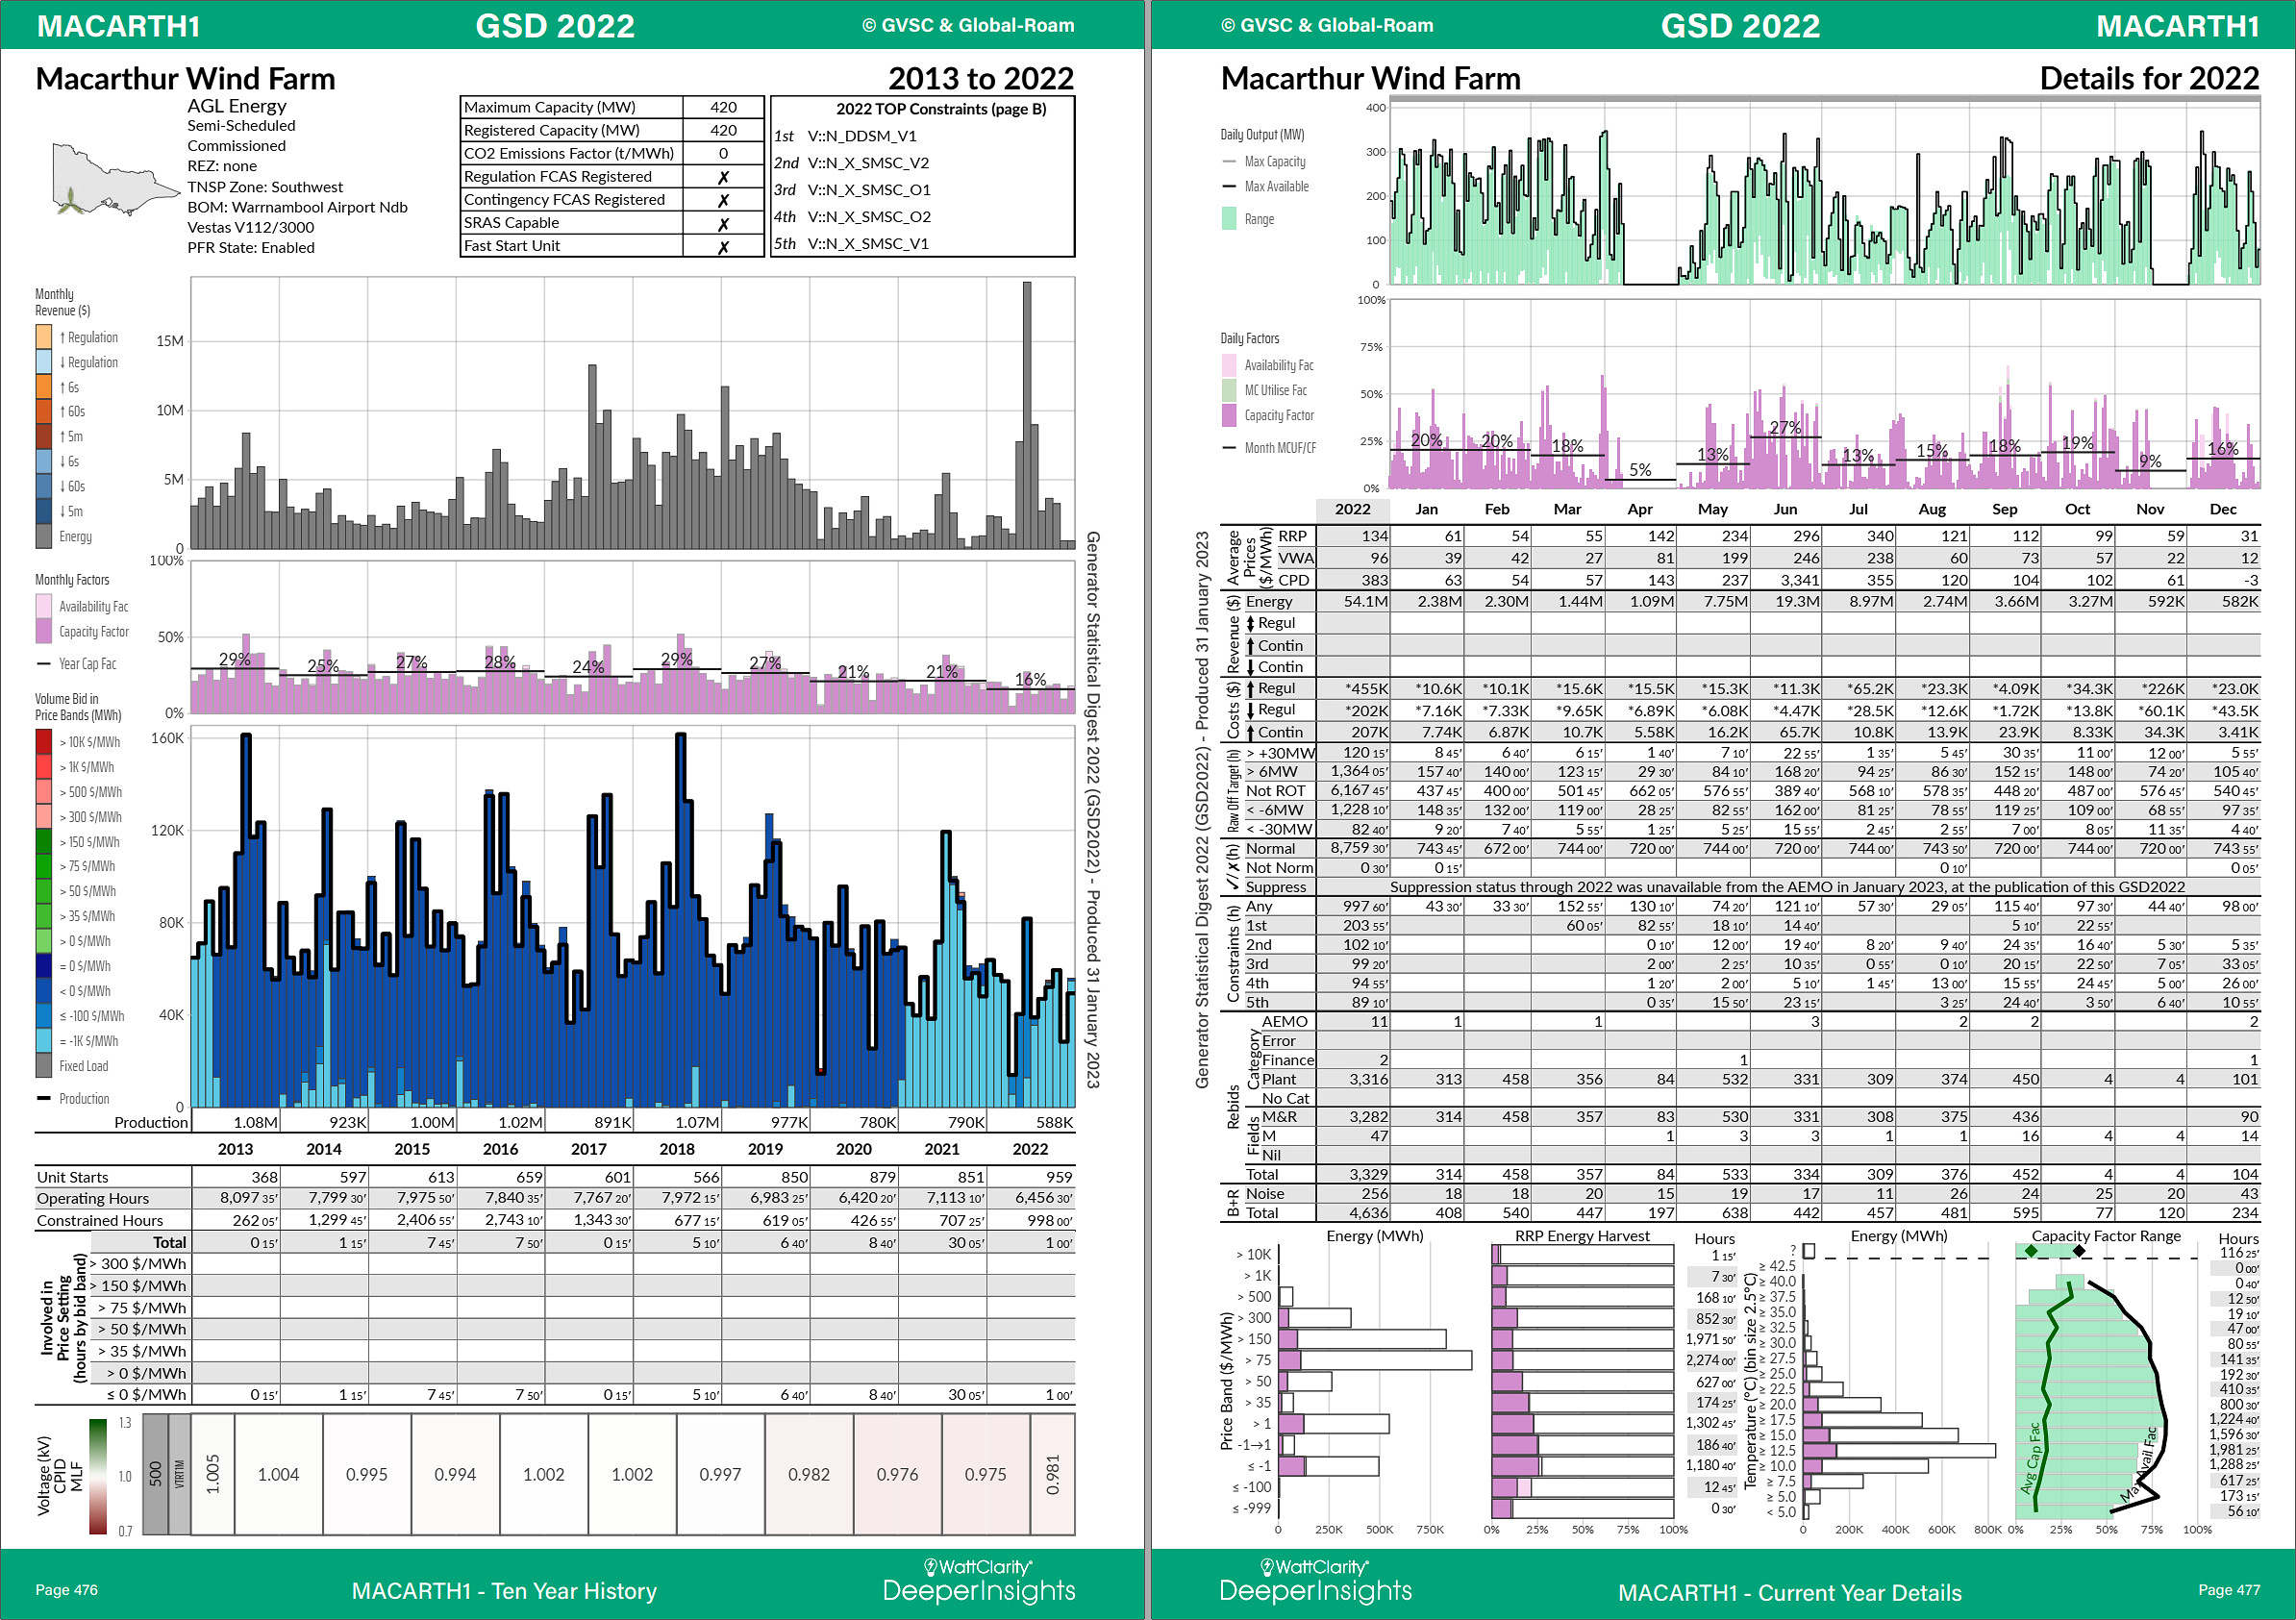
The data used in this analysis has been sourced from our Generator Statistical Digest (GSD) data extract from successive years. For each generating unit in the NEM, the GSD provides detailed operational and financial performance statistics such as spot and FCAS revenue, bid volumes, marginal loss factors, price harvest, capacity factor range, etc. The image below shows the profile of Macarthur Wind Farm taken from last year’s edition.

The next edition of our GSD is scheduled to be released in early February 2024. You can pre-order your copy today using this form.


Thanks Dan
I think you should be able to adjust for (2) and (3). (E.g. QED reports do). I expect this would be material and give some support to the improving technology claims.
Thanks Ben. Yes if I have time in future I will loop back and examine how availability factors have been evolving.
Is there a tool where capacity factors for individual years or overall for all wind farms and individual wind farms that could produce a lust of the selected criteria?
Hi Peter, the closest thing might be our GSD reports:
https://wattclarity.com.au/deeper-insights/