As the title suggests, this email will touch briefly on four different market developments …
Development #1) AEMO’s MMS v5.2
Today is the day that the AEMO’s MMS v5.2 is scheduled to go into Production.
1) Given that we’re helping a growing number of clients in various ways with respect to the EMMS (either directly by provided Hosted MMS Services, or indirectly through software like ez2view that helps to visualise this data) this has been of keen interest to us.
2) With this particular upgrade, there’s been a bit of iteration amongst the AEMO and the Participants about this one … so we’re waiting to see if this is stable before deploying to our clients.
3) This upgrade is of particular interest to us, as it contains a structure to support a number of market enhancements that we’ll be upgrading our software to support.
Development #2) ez2view v9.7
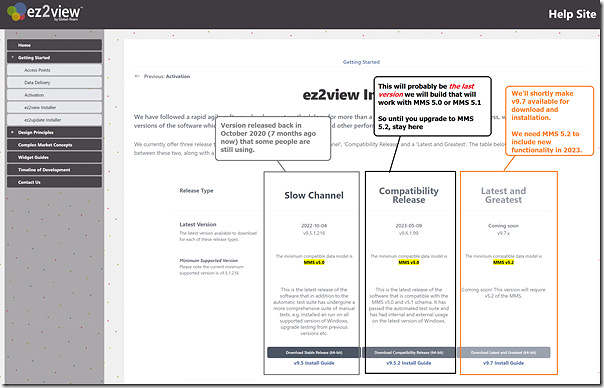
… which brings me to the second market development … the release of ez2view version 9.7 … which clients will shortly be able to download and install from the Installers Page:
We’ve been frequently building new versions in the 7 months that have followed the release of v9.5.1.216 on 10th October 2022 … but we’re a bit behind on publishing Release Notes.
With respect to the image above, note that:
1) Version 9.5.1.216 was described in the Release Note at the time.
2) Since October there have been many enhancements to the software, such that we bumped the version to v9.6.1.99:
(a) This will be the last version compatible with MMS v5.0 and MMS v5.1
(b) When we get a chance, we’ll belatedly publish some Release Notes for v9.6 to sum up what’s changed since 10th October 2022.
(c) Subscribe there if you want to be emailed when they are published.
3) Shortly we will make v9.7.1.6 available:
(a) Which will be the first version compatible with MMS v5.2
(b) Though, as evidenced in the image below, it won’t work perfectly with MMS v5.1 and preceding versions
(c) Thereafter all upgrades will require at least MMS v5.2
4) All versions older than 9.5.1.216 will be switched off shortly.
We’ll endeavour to contact all ez2view clients individually in the coming weeks … but this takes longer and longer with client numbers growing, and general busyness in the NEM. Hence I’m taking this opportunity to note this via WattClarity.
Development #3) Market Developments requiring MMS 5.2
There are a number of Market Developments coming down the pipe in 2023 that will require MMS 5.2 … which is the reason why we’re making the move above. Three of these are as follows:
Imminent Change = MaxAvail for Semi-Scheduled Generators
There’s only a couple weeks to go (it might be as early as Monday 12th June 2023) that the AEMO will start enabling Semi-Scheduled generators to utilise MaxAvail in their Bids to provide an easier (and more robust) ability to inform the AEMO of plant limitations.
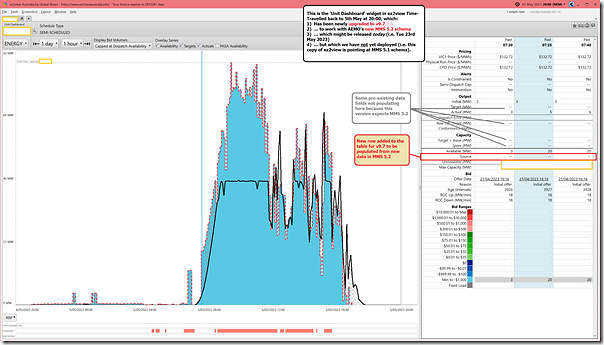
Linton will be along shortly in another article to provide some background to this change and more details of ez2view … but that’s the reason for the upgrade to v9.7.1.6, with the new data to be visible in the ‘Unit Dashboard’ widget as shown below:
There’s four milestones that need to occur before this data will be available in ‘Next Day Public’ data set:
Step 1) You’ll need to upgrade to v9.7
Step 2) You’ll need to be pointing your copy of ez2view to an MMS with v5.2 schema:
(a) Note that the software images in this article are not pointing at MMS 5.2 but instead to an earlier version;
(b) Our ‘Global-Roam ez2view Cloud Data Source’ will be upgraded soon in this respect.
Step 3) The AEMO will need to make the change to start publishing this new data … we understand this might happen as early as Monday 12th June 2023 (i.e. under 3 weeks away).
Step 4) Participants will need to remember about the change and those who are currently bidding zero for MaxAvail (i.e. because it’s currently ignored for Semi-Scheduled Units) will need to change their practices. Linton will have a look at these units shortly.
by 9 October 2023 = Fast Frequency Market
The EMMS 5.2 schema supports the addition of the fast frequency markets later in 2023. We’ll be upgrading ez2view to address this.
by 9 October 2023 = MT PASA Generator Recall Times
The EMMS 5.2 schema supports the addition of the Generator Recall Times as an enhancement to the MT PASA information that generators submit to the AEMO in their bid. We’ll be upgrading ez2view to address this.
Development #4) An example of Self-Forecasting for Semi-Scheduled units
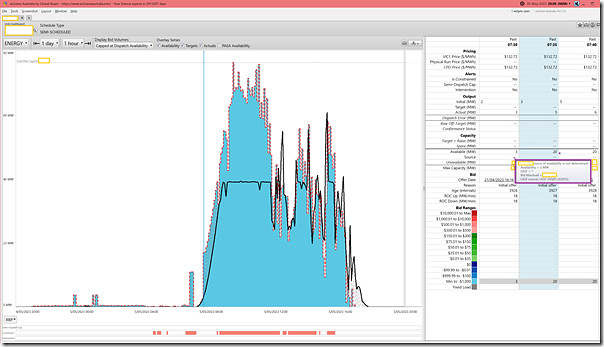
In the snapshot above we wound the ‘Unit Dashboard’ back to the 20:00 dispatch interval on Friday 5th May 2023. The window is focused on the [OBSCURED UNIT] with a 1-day look-back.
The black line on the chart shows the profile of actual output, and the blue shaded area shows the profile of ‘energy-constrained bid’, given all volume was bid down at –$1,000/MWh at the RRN (i.e. the bid submitted by the unit capped by the Availability from the UIGF … soon also to be capped by the MaxAvail in the Bid (though that’s another story)).
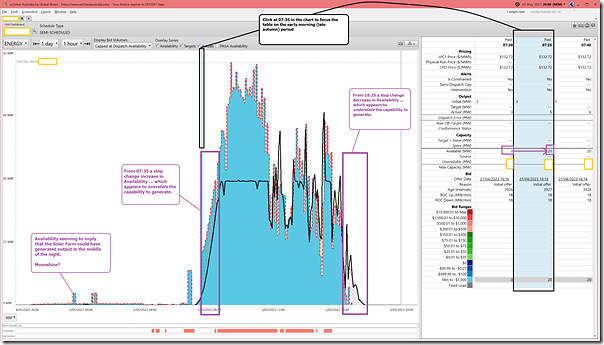
With this widget, we can focus the three columns of the table by clicking on a particular vertical slice (i.e. Dispatch Interval) of the chart … so I have chosen to focus on the 07:35 dispatch interval as follows:
I’ve added additional notes to highlight three time blocks within the 24-hour lookback:
1) Through the night there are strange periods where availability in the UIGF appears to suggest the unit could generate something overnight. That does not seem correct.
2) Early in the morning (i.e. at 07:35 dispatch interval highlighted):
(a) there is a step change increase in the Availability in the UIGF (i.e. setting the volume in the bid) from 3MW to 20MW that:
(b) persists for about an hour; and
(c) with reference to the black line (i.e. actual output, which is considerably lower) appears to consistently overstate the capability of the unit to produce output.
3) There’s a mirror of this late in the afternoon (i.e. from ~16:25) whereby:
(a) there is a step change decrease in the Availability in the UIGF (i.e. setting the volume in the bid) down to zero;
(b) that persists for about an hour; and
(c) with reference to the black line (i.e. actual output, which is considerably lower) appears to consistently understate the capability of the unit to produce output.
Some readers might wonder how frequently this type of pattern occurs, for which units, and why it occurs.
Other readers will recall we’ve been looking into this for some time. For instance on 14th April, Linton wrote ‘Delving deeper into dispatch availability self-forecasting performance’ … which will provide some useful context, including links to earlier articles that provide more context.
In this article we’ve just picked [OBSCURED UNIT] as a unit just because we happened upon this example recently, but readers should understand it’s a fairly common practice. We’ve obscured the unit so readers can focus more on what’s happening, and not the ‘who’.
4a) Source of the Availability
All of the above is visible in v9.5 and v9.6 of the software … but what comes next is new to ez2view v9.7 …
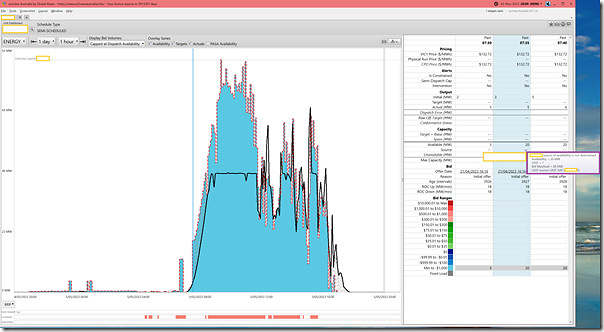
With the new version of the software I can mouse-over the Availability field for 07:35 to shed more light:
Despite the fact that I’m not yet pointing to an MMS 5.2 and that the AEMO has not yet started publishing the new data, we can see some additional details already!
For the 07:35 dispatch interval (i.e. where the Availability jumps to 20MW) we see that the – specifically that the source of the availability used to cap the bid in this dispatch interval comes from the self-forecast.
… the mouse over also provides the specifics of which self-forecast (there can be several in use).
Mousing over the previous dispatch interval in the table (i.e. 07:30, where the Availability was only 3MW) we see a bit more…
In the mouse-over for that dispatch interval, we see that the source of the UIGF (and hence the Availability) at that time was AEMO’s ASEFS data feed.
So to sum up this particular morning period …
At 07:30 = Availability set at 3MW by ASEFS, the unit is unconstrained and bid down at –$1,000MW and gets a 3MW target which it meets happily.
At 07:35 = several changes happen:
(a) the Availability jumps to 20MW because the switch is made to the Self-Forecast (the participant, or those acting on their behalf – like the self-forecast provider – is able to flip this switch (e.g. by un-suppressing the self-forecast)).
(b) The unit is still unconstrained so NEMDE says ‘thanks, I’ll have all that cheap energy’.
i. The Target is set at 20MW.
ii. This is shown in dotted grey line in the chart … and would be shown in the table except I have temporarily (and intentionally) mixed up the version of the software and version of the MMS.
(c) However actual output remains on its slower increase through the morning as the sun ramps up.
(d) Hence the unit is significantly under Target.
4b) Why take this approach?
The question ‘why are some operators of Semi-Scheduled units adopting an approach similar to the above?’ is a good one to ask!
As with many things in the NEM the answer has complexity involved, but some ingredients in the answer are as follows:
1) The current method for allocating Regulation FCAS costs involves a complicated process called ‘Causer Pays’ that Harley Mackenzie wrote about in 2017.
2) Some vendors of self-forecasting approaches have marketed their solutions on the basis of delivering zero Causer Pays Factor for the units they deliver self-forecasts for. That’s a compelling commercial proposition!
3) The approach taken appears to include a delicate balancing act between:
(a) managing availability in UIGF such that the unit:
i. systemically under-delivers on target (when Semi-Dispatch Cap not set) when system frequency is typically high, and
ii. vice-versa, over-delivering on target (when Semi-Dispatch Cap not set) when system frequency is typically low;
(b) noting that (as we showed via ‘Observations of differences in system frequency in the Mainland NEM ’ in May 2021) it appears to be the case that for the period 1st March 2021 to 2nd May 2021:
i. From 06:00 to 07:59 the frequency was strongly skewed high (to do with different rates of ramp up of rooftop PV and underlying demand).
ii. The skew varied at different points in the day
iii. And we should expect the skew would also change based on month of year, as well.
(c) in some cases, reverting back to ASEFS or ASEFS (by self-suppressing the self forecast) when Semi-Dispatch Cap is set … as we explored in GenInsights Quarterly Update for Q4 2022 and shared more broadly via ‘Some revelations in GenInsights Q4 2022 about Self-Forecasting’.
(d) and managing to remain permitted in the AEMO’s 1-week, 4-week or 8-week acceptance cycle that Linton discussed here.
4) But the carrot of achieving low (and in some cases zero) Causer Pays Factor means a big boost to the bottom line of a Wind or Solar Farm, so it’s no surprise that the adoption of this approach has grown.
4c) Some thoughts
My understanding is that different people view the behaviour described above in different ways…
1) On the one hand some people describe the behaviour along the lines of ‘optimising a generator’s commercial position within the current market rules’;
2) Whilst others believe that the behaviour ‘does not pass the pub test’ and perhaps describe the behaviour as ‘gaming the market’.
Frequent readers here will remember that I’m interested in helping to ensure the energy transition actually succeeds … (that’s what we’re focused on doing, at Global-Roam Pty Ltd) – but I do have questions about the long-term wisdom of a number of different behaviours and technical limitations.
Will they ultimately help, or hinder, the transition?
To conclude this article, I’d remind readers that (back in GenInsights21) we asked the question ‘What is the purpose of self-forecasting?’ (as Observation 15 of the 22x Key Observations in GenInsights21).
1) Later (on 27th February 2023) we shared Key Observation 15 here in its entirety on WattClarity.
2) It’s nice to see the looming changes in June 2023 will address some of the points raised there and elsewhere on WattClarity.
We’re looking forward to having these changes above implemented and in use by our clients…


Under and over deliveries to target may be manageable with the NEM’s existing 19 GW of large-scale solar and wind. However, imagine the impact when solar and wind farms reach 44 GW in 2030 and 141 GW as per AEMO’s 2022 ISP. Then what if Australia becomes a global green hydrogen superpower as per the Bloomberg/BNEF report yesterday and large scale solar and wind reaches 812 GW by 2050???