
Including outcomes of the ASEFS and AWEFS upgrade in November 2022 and changes to the assessment procedure in April 2023
Back on Wednesday 23rd November 2022 the AEMO released an enhancement to its ASEFS and AWEFS forecasting systems for Wind and Solar assets:
- Prior to this time, the approach had been a vendor-based approach (i.e. outsourced); but
- From this point forward, AEMO has been using its own internally-developed system.
In conjunction with the upgrade to AEMO forecasts, suppressions of participant self-forecasts from the performance assessment process were paused to provide some time for participant forecasts to adapt.
In short, the AEMO performance assessment:
Compares AWEFS/ASEFS forecasts to the participant’s forecasts and aims to ensure that forecasts no worse than AEMO’s (on average) are used in dispatch. If worse, AEMO will suppress the forecast from being used in dispatch.
Each week, participant forecasts that have been approved for dispatch undergo the weekly assessment.
There are three possible outcomes of the ongoing assessment process:
-
- Insufficient data: the suppression status does not change.
- The forecast passes: Forecast is unsuppressed by AEMO.
- The forecast fails: Forecast is suppressed by AEMO.
Three months after the AWEFS/ASEFS upgrade (on Tuesday 28th February 2023) the AEMO ‘Grace Period’* ended, and AEMO re-commenced suppressing self-forecasts (as discussed here the day beforehand with reference to some insights shared from GenInsights Quarterly Update for Q4 2022)
>> * the description ‘Grace Period’ is our term, not the AEMO’s.
Our expectation was that there would be a fair number of DUIDs that saw their self-forecasts suppressed as a result of the AEMO reactivating the suppression of self-forecasts that fail the performance assessment process.
At the highest level this was based upon:
-
- The enhanced AEMO forecasts had improved by more than 10%, setting a higher benchmark.
- We had observed occasional yet wide differences between actual output and participant self-forecasts through spot-checks, from time to time.
- We are aware of periods when some participant self-forecasts appear to be set to overestimate or underestimate generation potential to minimise regulation FCAS costs.
Yet, on Tuesday the 28th February, there was not the surge in suppressions we expected…
Since that time the assessment procedure has been updated:
The new procedure relaxes the dispatch self-forecast gate-closure time to 10 seconds for assessments (was 15 seconds), and is applicable to assessments from 11 April 2023.
And because of all this, we have delved deeper into dispatch availability self-forecasts and the assessment process to further enhance our understanding of this important aspect of the operation of the modern National Electricity Market.
(A) AEMO suppressions
Let’s start by explaining which units were suppressed on 28 February when suppression resumed, and then view the trend since Jan 2020:
(A1) Suppressed on Tuesday 28th February 2023 (end of the grace period)
The weekly assessment process resumed on this day after a 3-month hiatus.
There were four DUIDs that saw their self-forecasts being newly suppressed:
-
- In QLD:
- RRSF1 (Ross River Solar Farm)
- In SA:
- HDWF1 (Hornsdale Wind Farm 1)
- HDWF2 (Hornsdale Wind Farm 2)
- HDWF3 (Hornsdale Wind Farm 3)
- In QLD:
Although we focus this article on suppressions, there were two DUIDs that saw their self-forecasts being newly unsuppressed:
-
- In SA:
- LKBONNY2 (Lake Bonney 2 Wind Farm)
- LKBONNY3 (Lake Bonney 3 Wind Farm)
- In SA:
(A2) Trend since 1st January 2020
We were curious to see how these results compared with a trend over time and so have compared daily stats over recent years in the chart below.
It captures the number of units issuing self-forecasts that:
-
- Were suppressed by AEMO over the whole day,
- Transitioned from one state to another over the day, and
- Were unsuppressed.
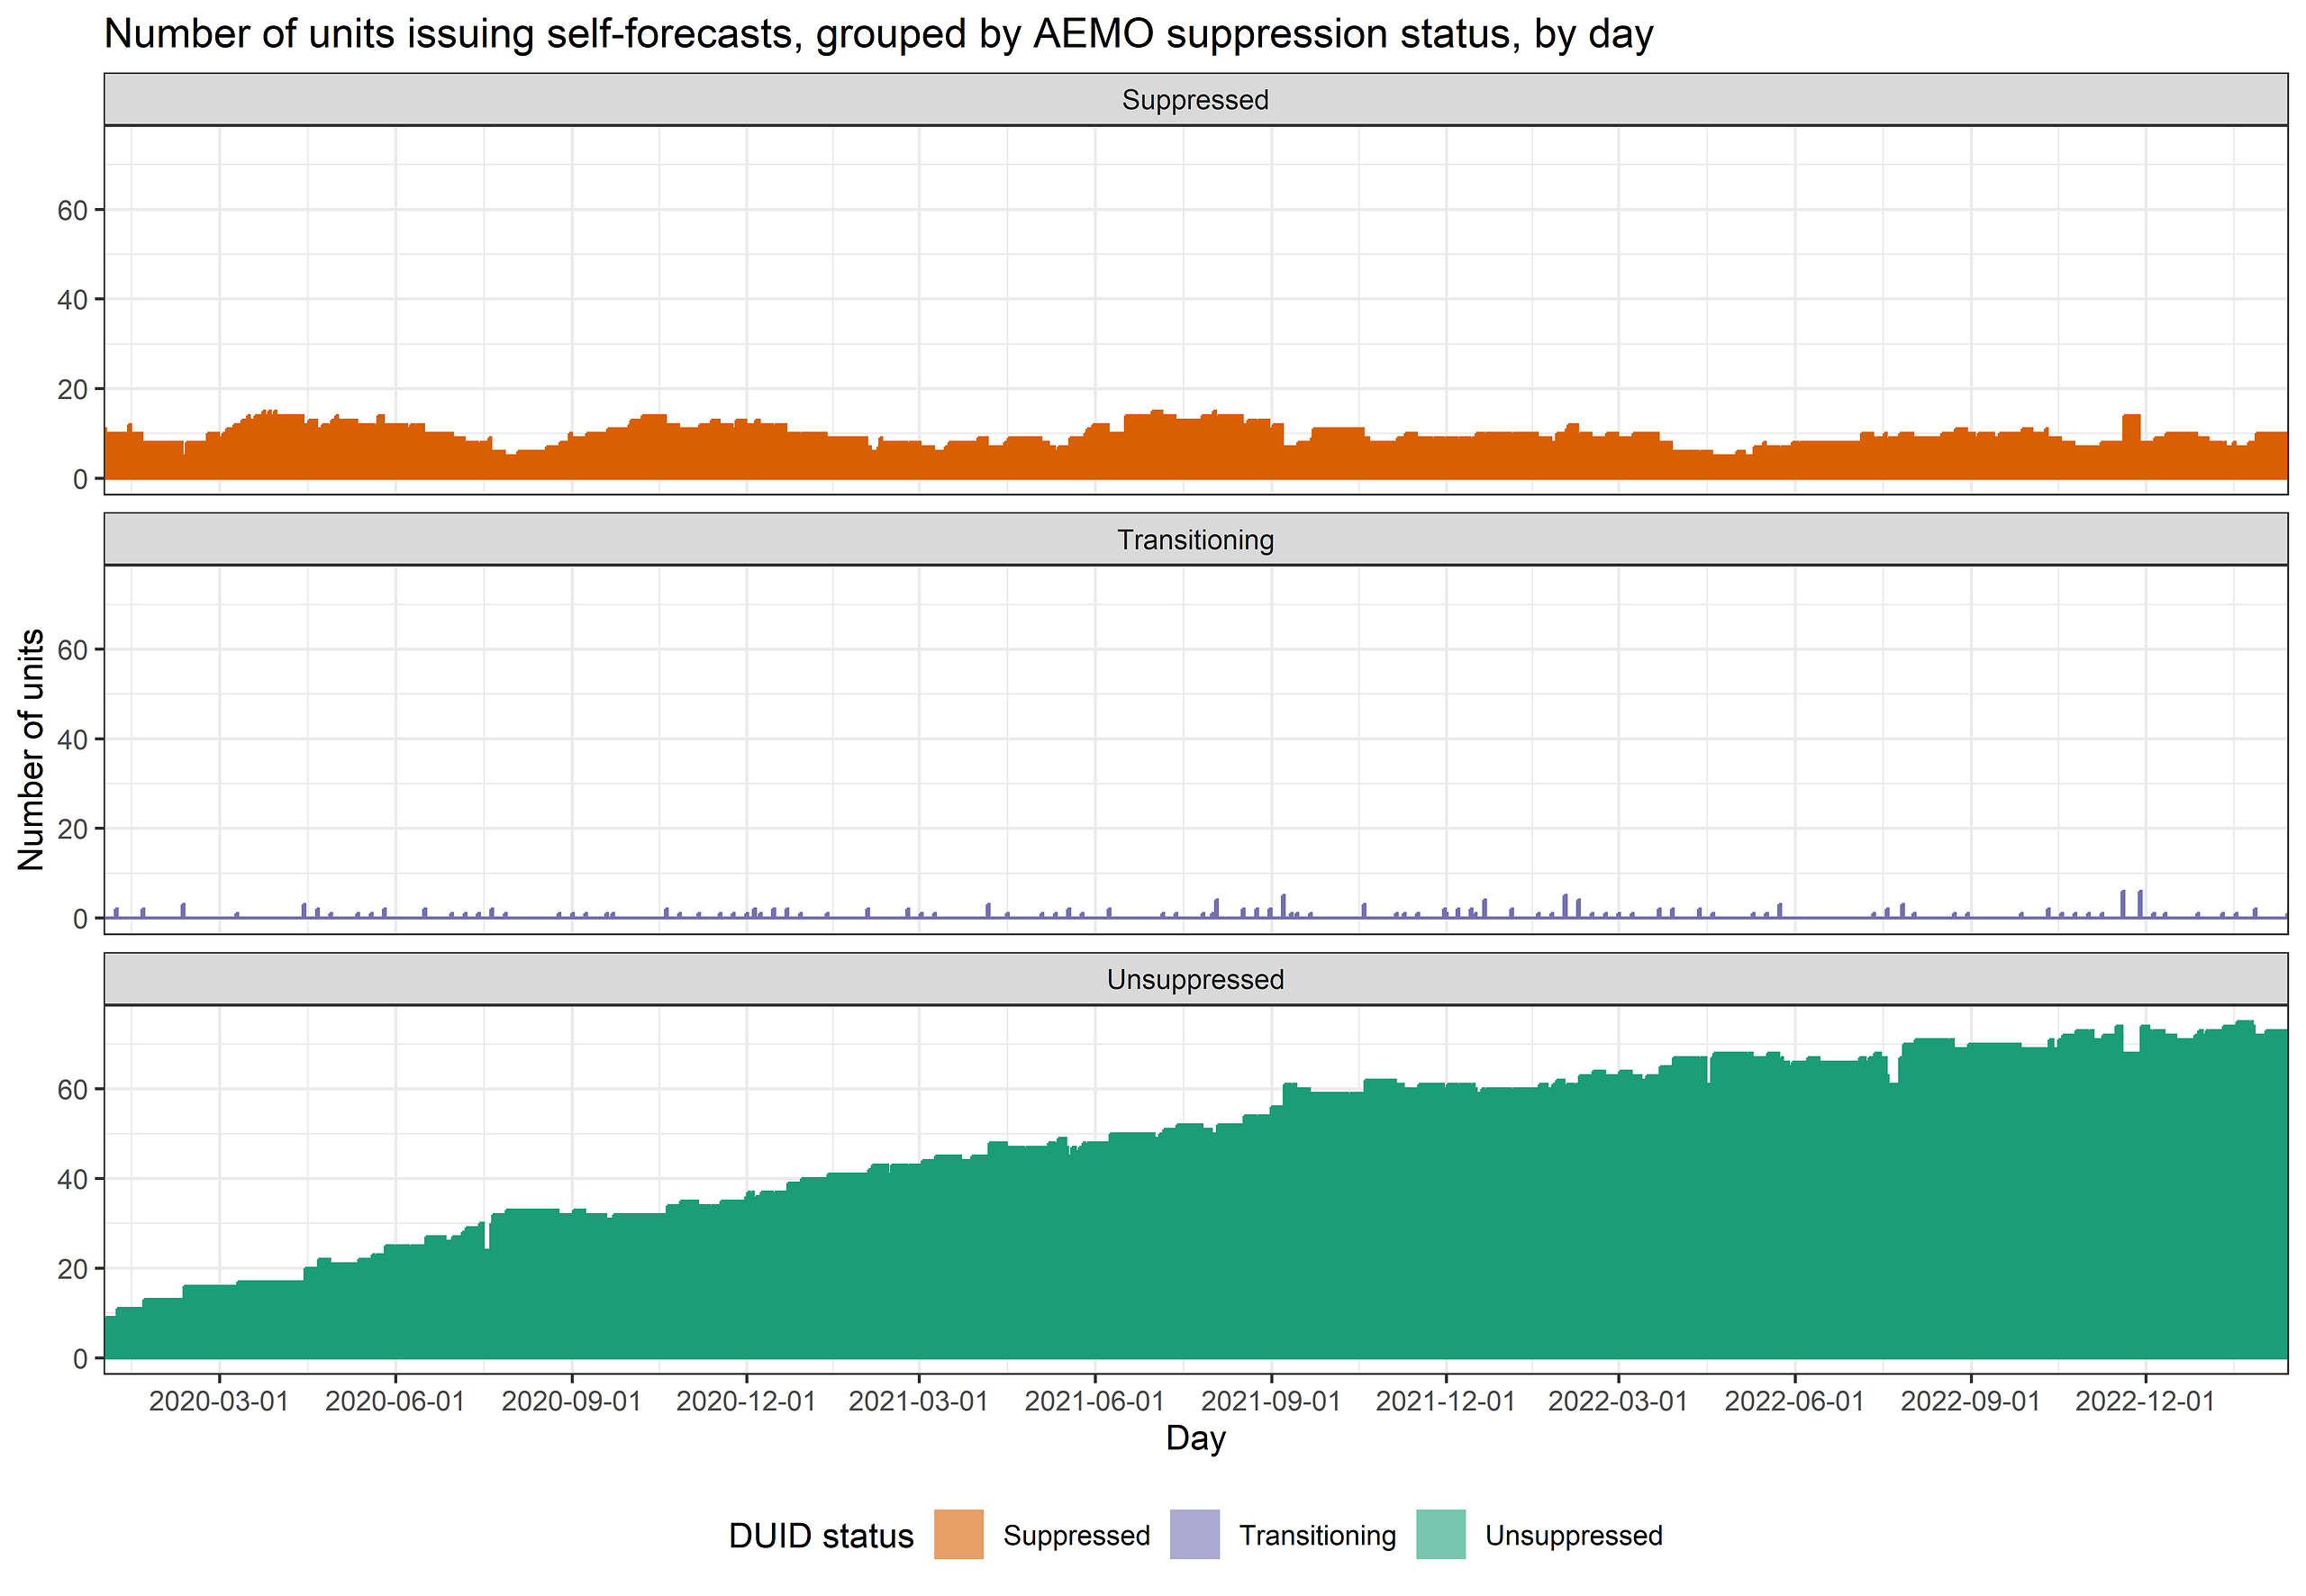
Units not issuing any self-forecasts in a day or issuing only self-suppressed forecasts are not counted.
The chart above helps highlight:
-
- The weekly cadence in assessment cycles which shows up in the Transitioning category: Each Tuesday units passing or failing the weekly assessment may transition to a new state.
- It is not unusual to have a couple of units transitioning each week.
- We see some units transitioning during the ‘grace period’. It appears that AEMO continued to approve new self-forecasts and these transitioned from suppressed to unsuppressed during December, January and February.
- The number of units participating in self-forecasting (as indicated by the counts of unsuppressed units) has grown but the growth rate has slowed in recent times.
(A3) Unpicking the assessment procedure
Given that the results were a little different than we expected, we pondered on what we might be able to do to understand more – and ended up building our own assessment engine that (we hoped) would be a faithful replica of the process AEMO uses internally.
In doing this, we followed AEMO’s assessment procedure for self-forecasts that are to undergo ongoing weekly assessment.
(A3-a) Our implementation
At the broadest level there are three possible outcomes of the assessment process:
-
- Insufficient data for the assessment: the suppression state does not change.
- The forecast passes: Forecast is unsuppressed by AEMO.
- The forecast fails: Forecast is suppressed by AEMO.
The following flow chart is our representation of the process for the ongoing weekly assessment that determines the self-forecast suppression state. Note that the AEMO procedure holds the official description with more detail.
Even after doing our best to condense it as much as possible, it’s still fairly long.
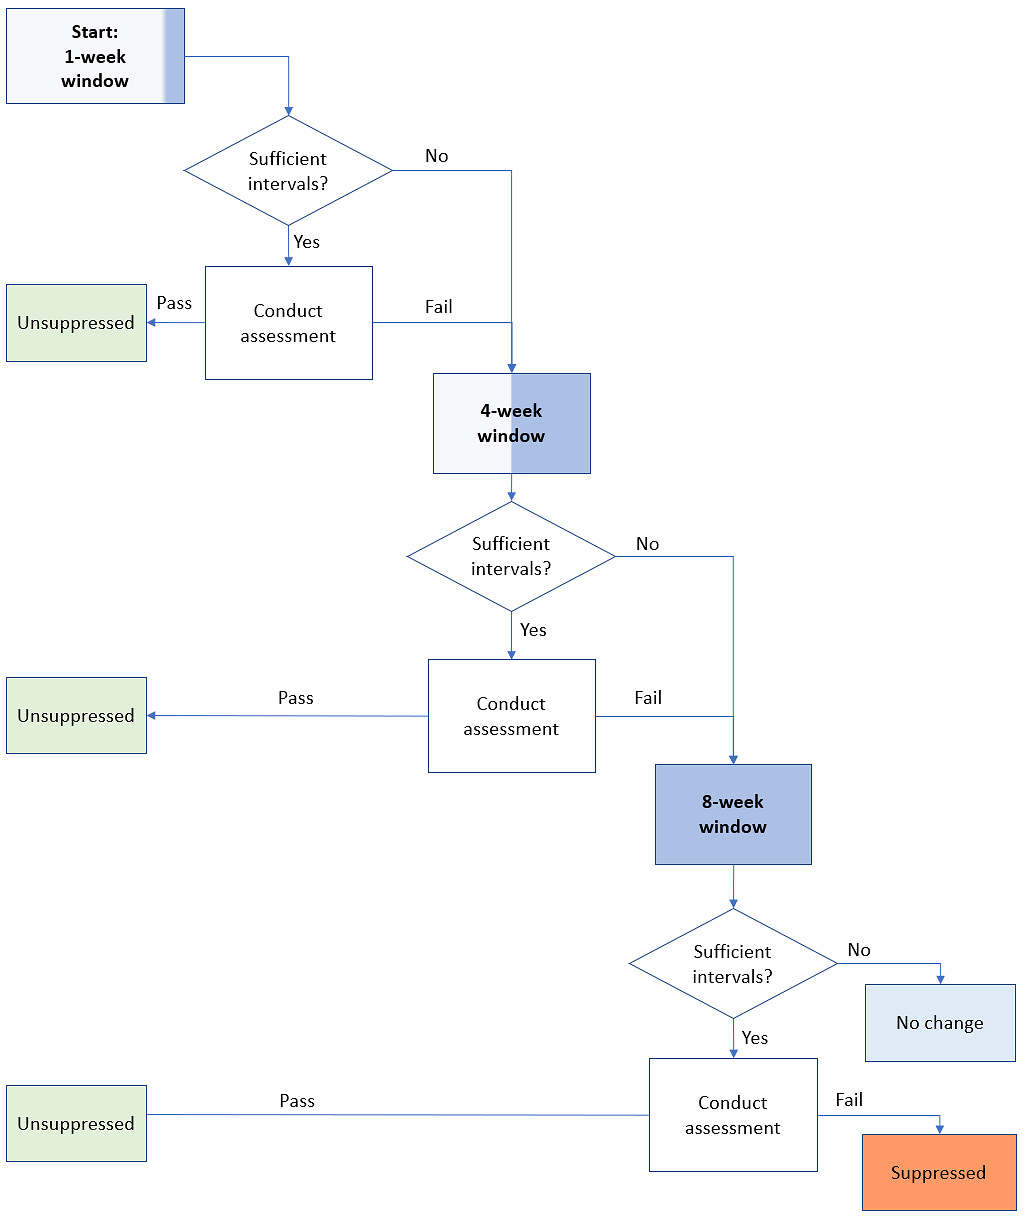
The flow chart demonstrates how a unit has up to three opportunities to pass assessment! For example, a fail on the 1-week window does not preclude a pass on the 4 or 8-week windows.
A fail result is only converted to suppressed state on the 8-week window assessment, if conducted.
And, it there are insufficient intervals in the 8-week window the assessment is not conducted and the unit remains in its present state.
And there is plenty of complexity in the detail, when it comes to implementation.
Sufficient intervals
The procedure requires datapoints for more than 60% of intervals in the assessment window to conduct the assessment.
To determine whether an interval is eligible for assessment we are in fact required to determine whether we have:
-
-
- an eligible self-forecast,
- an AEMO-forecast (generally always) and
- a representative actual.
-
In other words, determine what the forecast/actual pairs should be, and exclude the interval if there is no pair that meets the procedure’s requirements.
We must select only one forecast for assessment. But which?
Application of the assessment procedure necessitates excluding forecasts submitted after the dispatch gate closure time, in line with the procedure’s phrasing “received on or before the dispatch gate closure time at i-15 seconds” (prior to April 2023). This means that a self-forecast submitted later than i-15 seconds would not be eligible for assessment and would be excluded. Adding to that, all participant-suppressed forecasts are excluded. And, of course, the interval is excluded if no self-forecast is submitted.
Can we compare the forecast to a representative actual?
The actual is the unit’s MW output at the end of the interval, the “final MW”. However, the procedure requires the unit’s target be greater than or equal to the unconstrained generation forecast. Otherwise, the unit is assumed constrained, and the interval is excluded from assessment.
Constrained targets are often experienced by units involved in binding network constraints. This was one reason why the proportion of intervals required to be “sufficient” for assessment was lowered from 80% to 60% in 2022.
When comparing targets to unconstrained generation forecasts, we observed differences due to rounding at the last significant figure.
We understand this is addressed in AEMO systems by rounding targets and forecasts to 3 significant figures for the comparison. We adopted the same approach.
(A3-b) Outcomes following the procedure as effective in March 2023.
Our calculated suppressions line up quite well with what actually happened.
The following figure summarises how our implementation determined the correct suppression state (top bars in green). Counts ranging generally between 71 to 79 units.
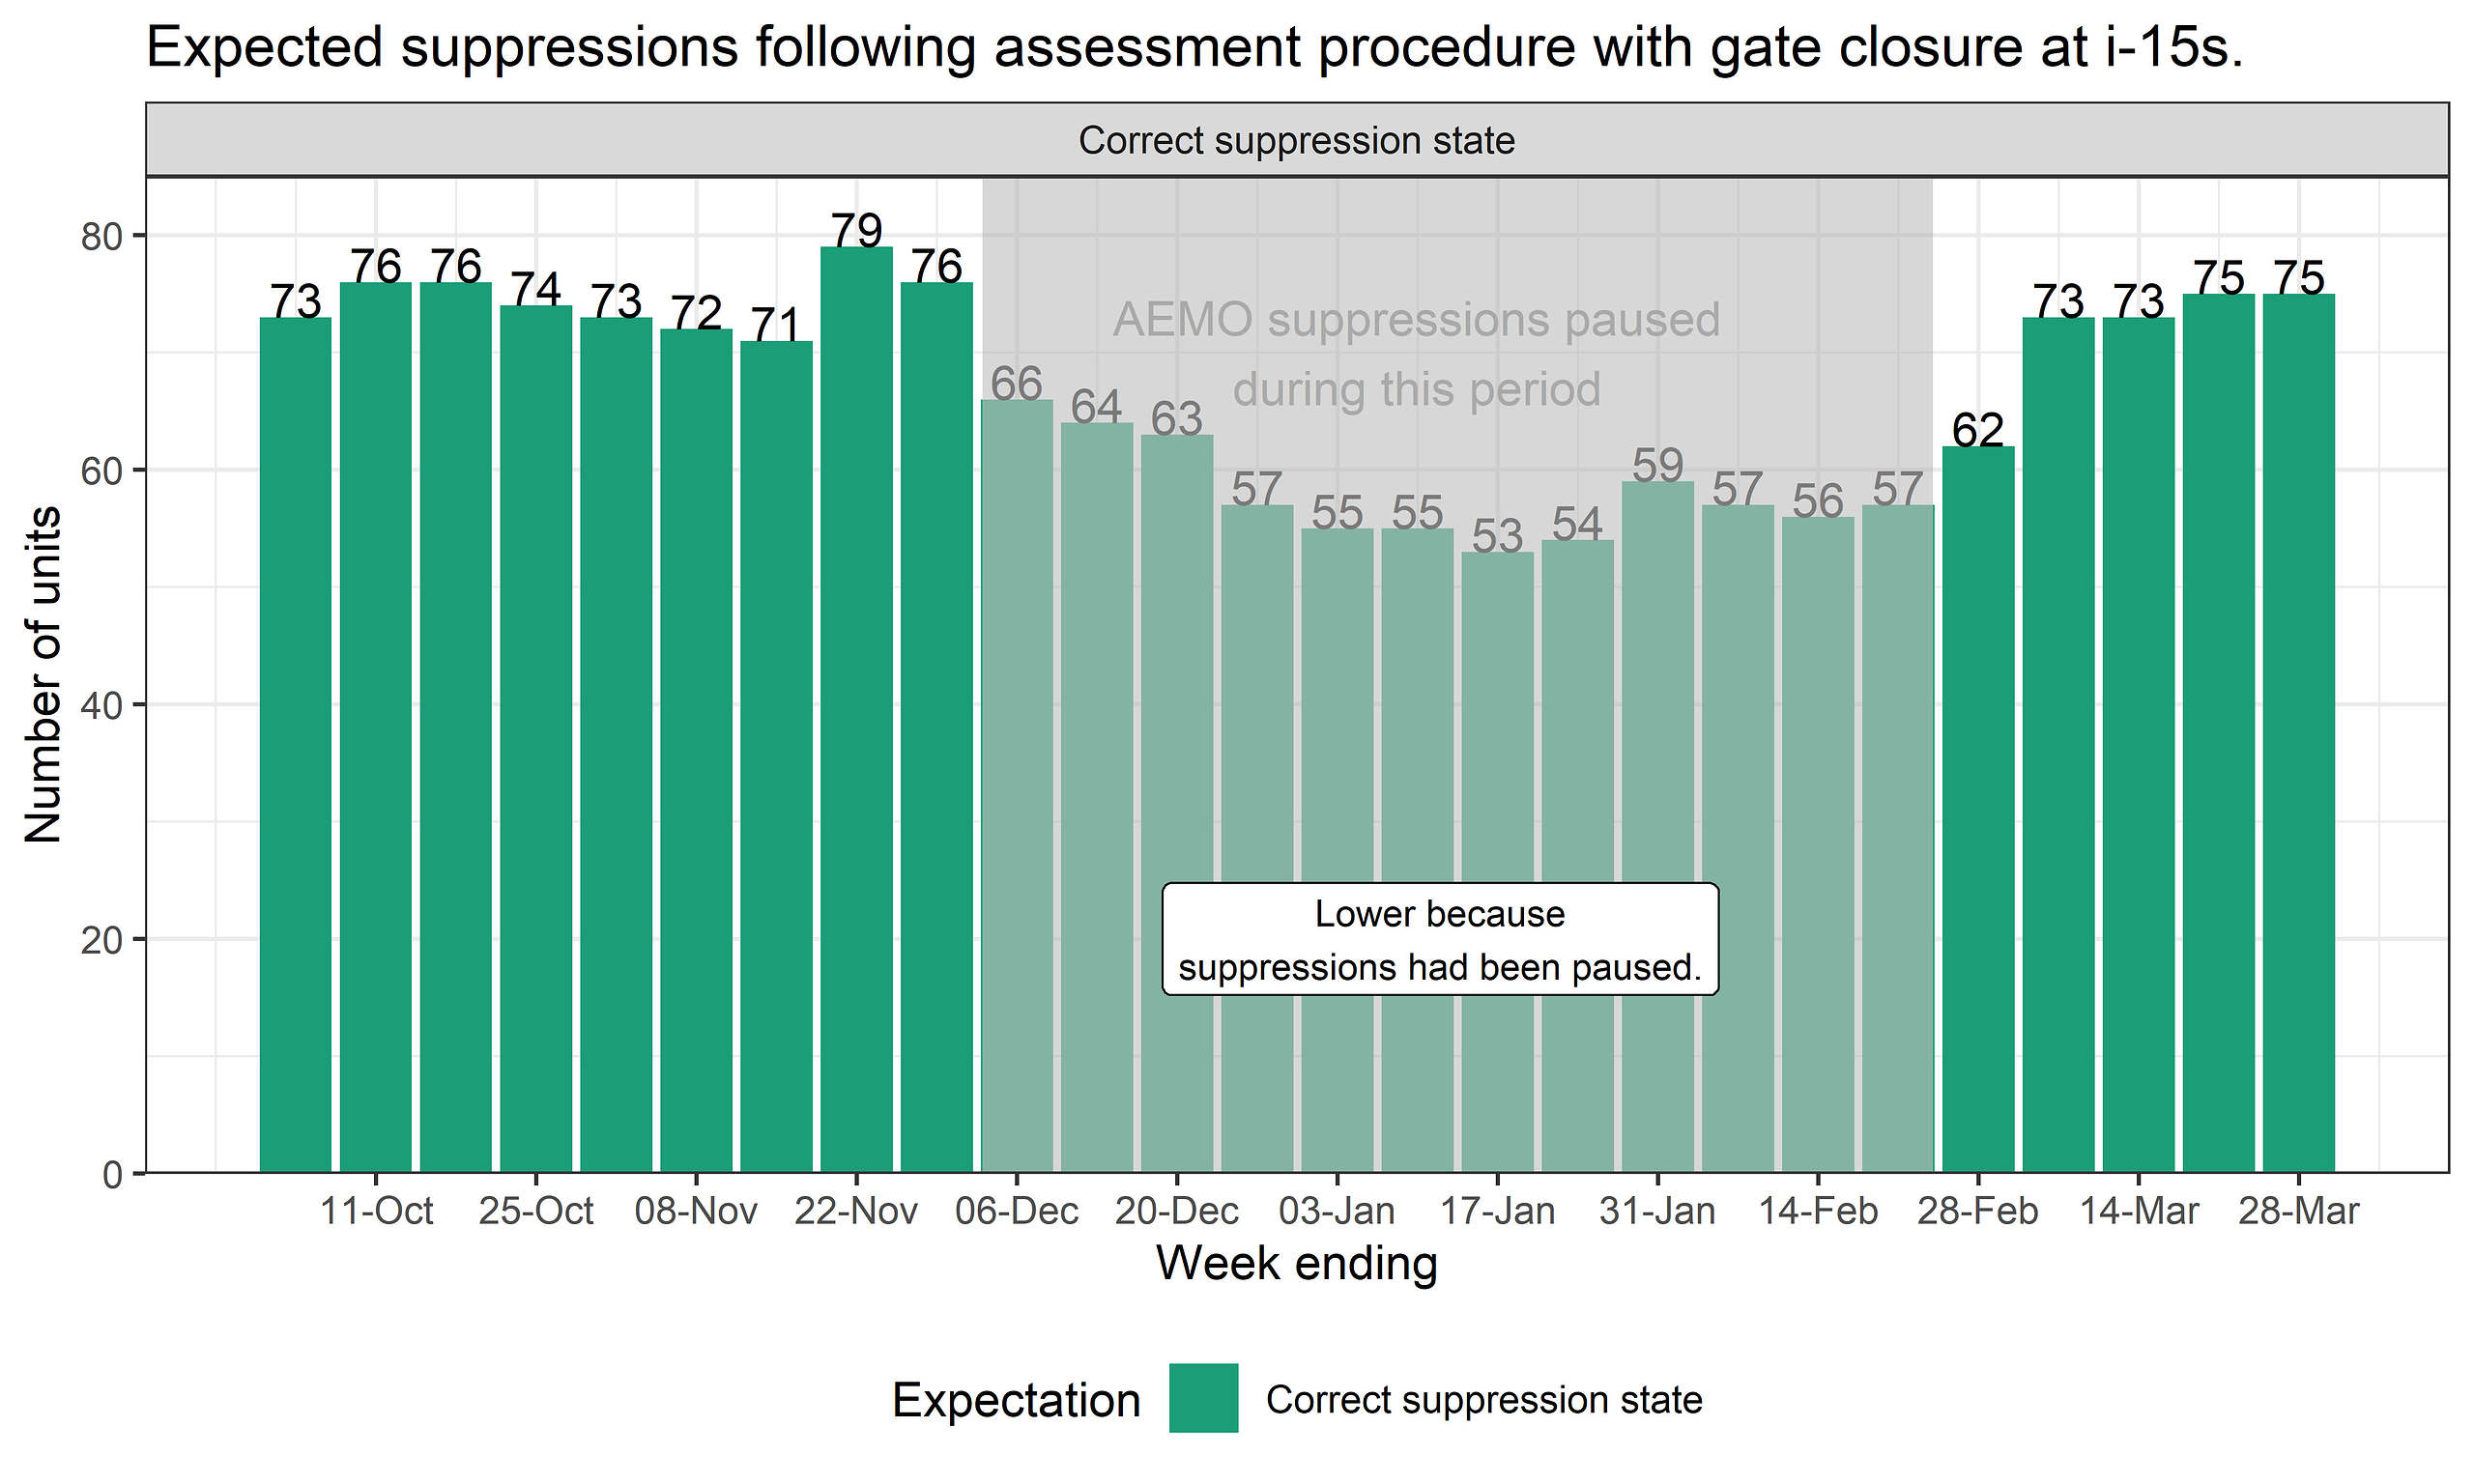
During the time when AEMO suppressions were paused our implementation suggested 10 to 20 units had performance that could have led to suppression. Outside this time (and excluding 28 February) the number expected suppressed but not ranged between zero and four.
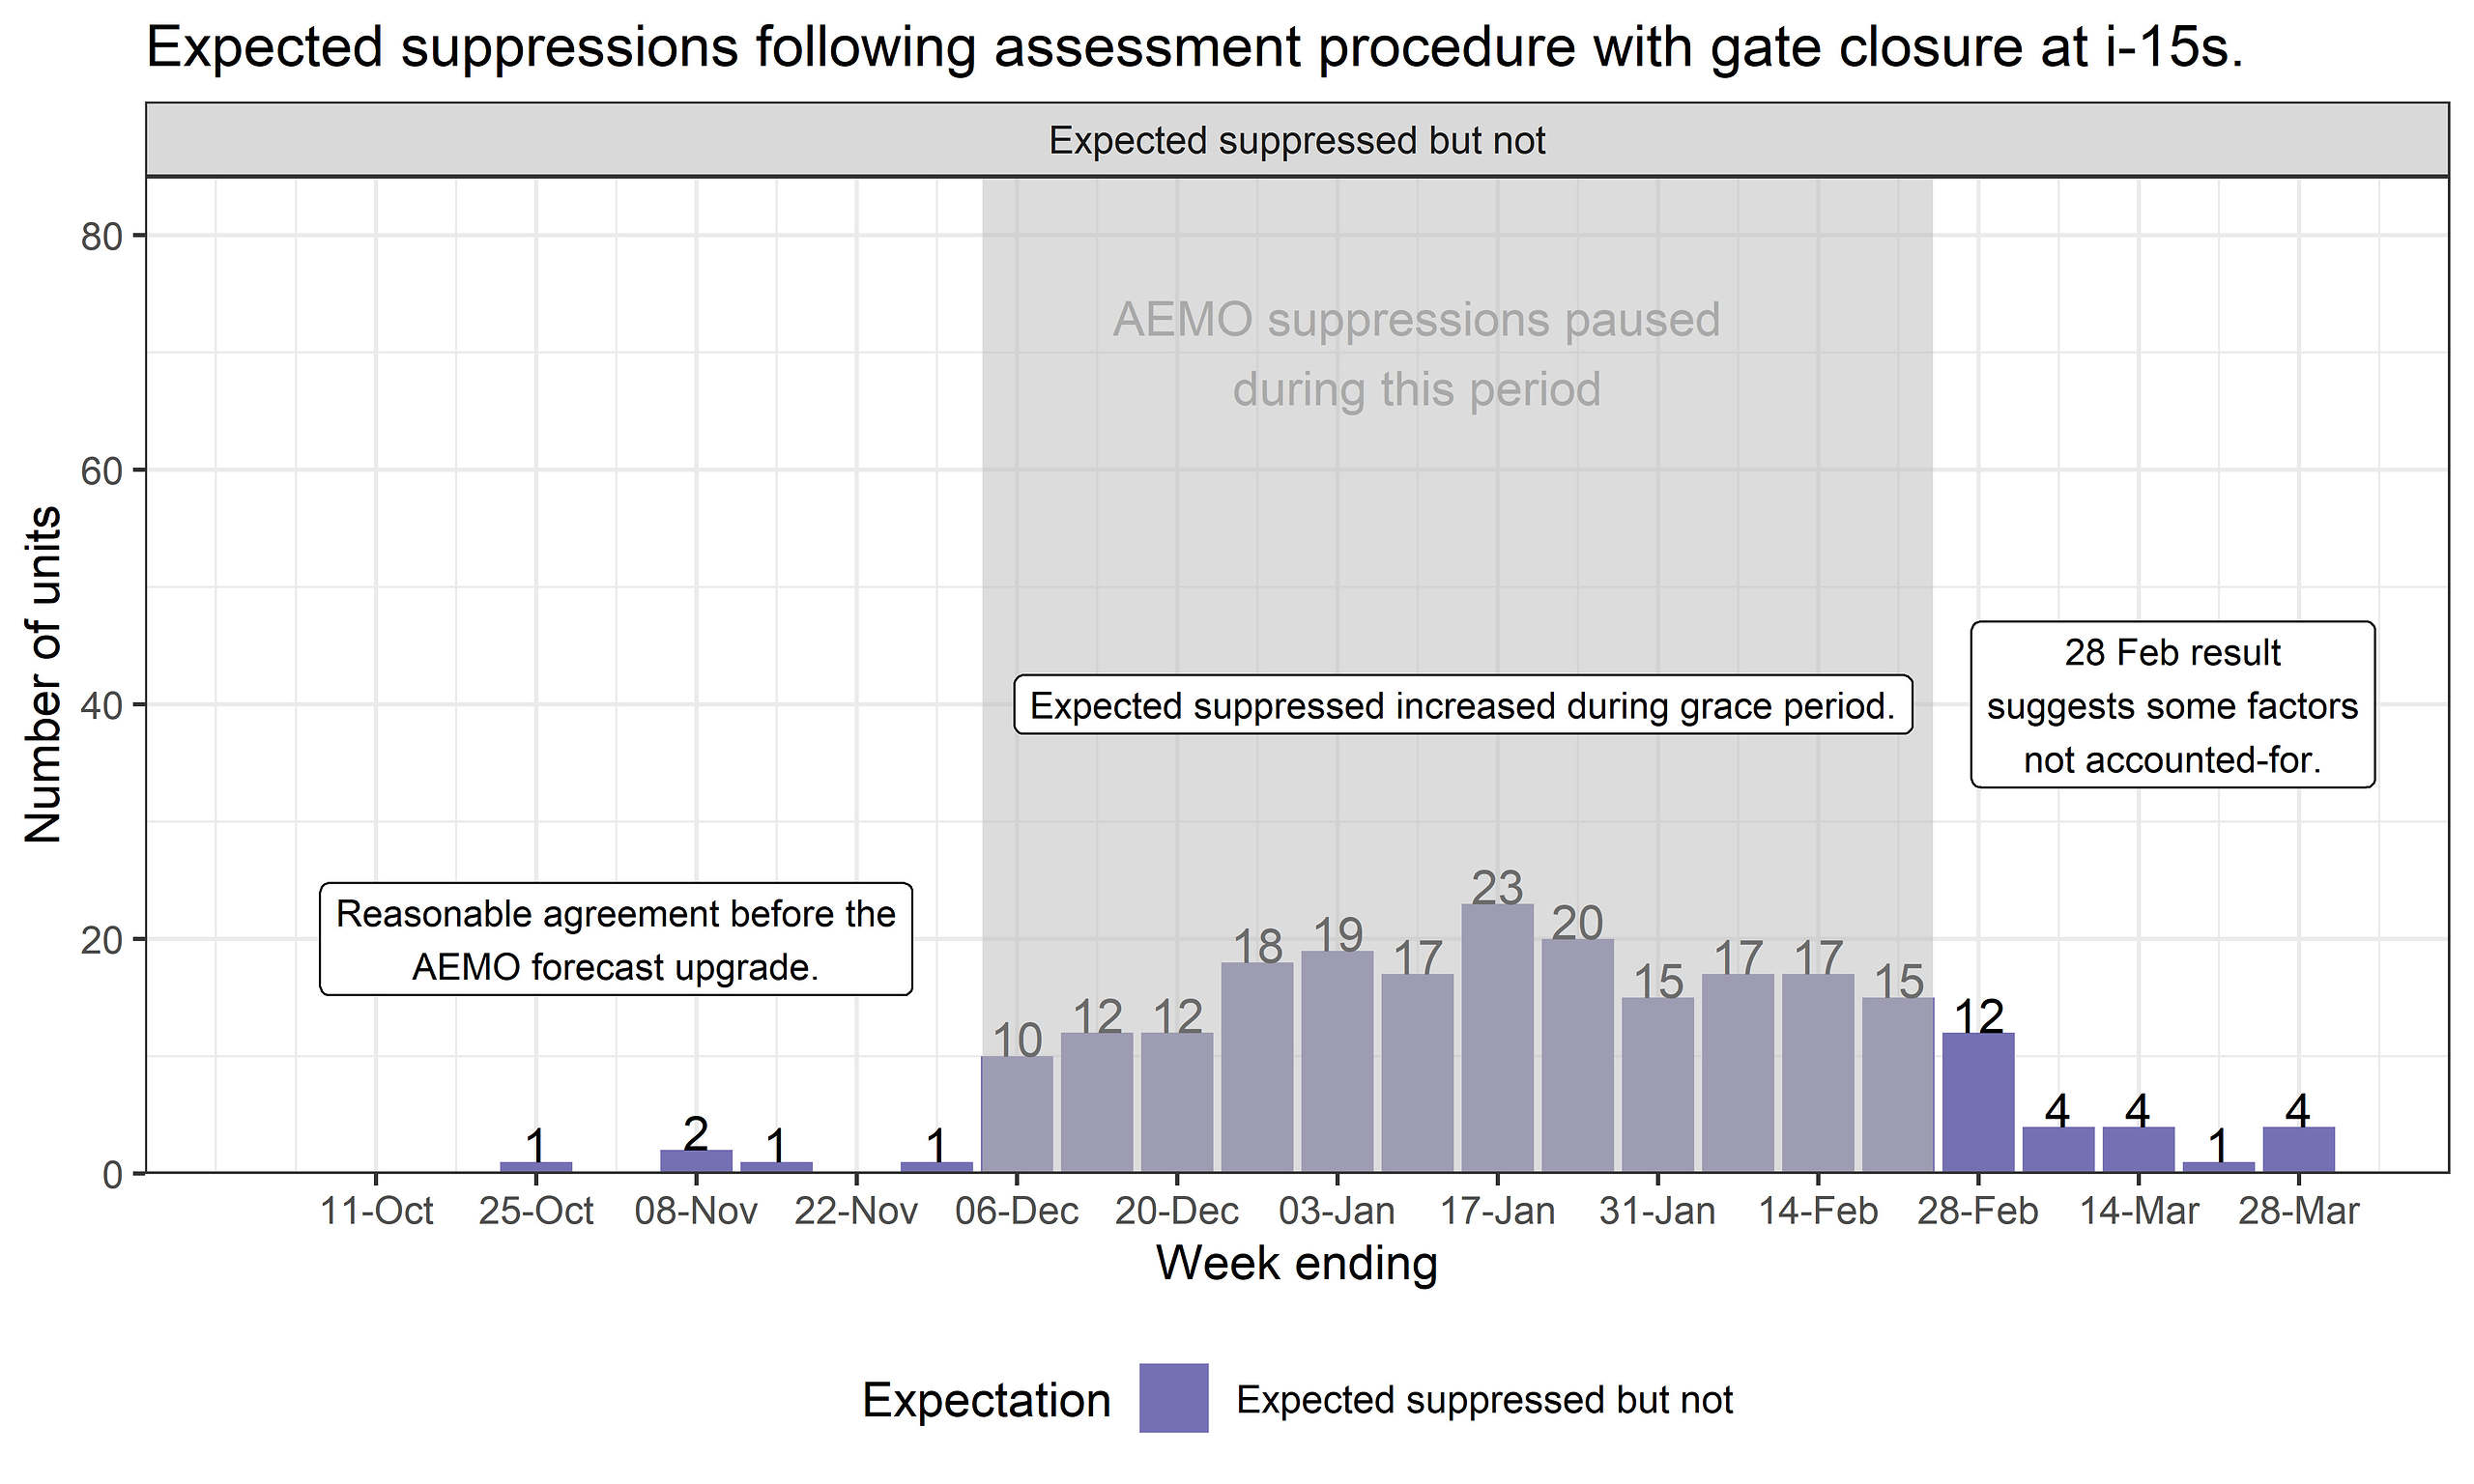
Prior to the grace period in the weeks of October and November the number of expected suppressed but not was low indicating good alignment with AEMO results.
A small number of units (between zero and six) tended to remain suppressed when we expected they would be unsuppressed:
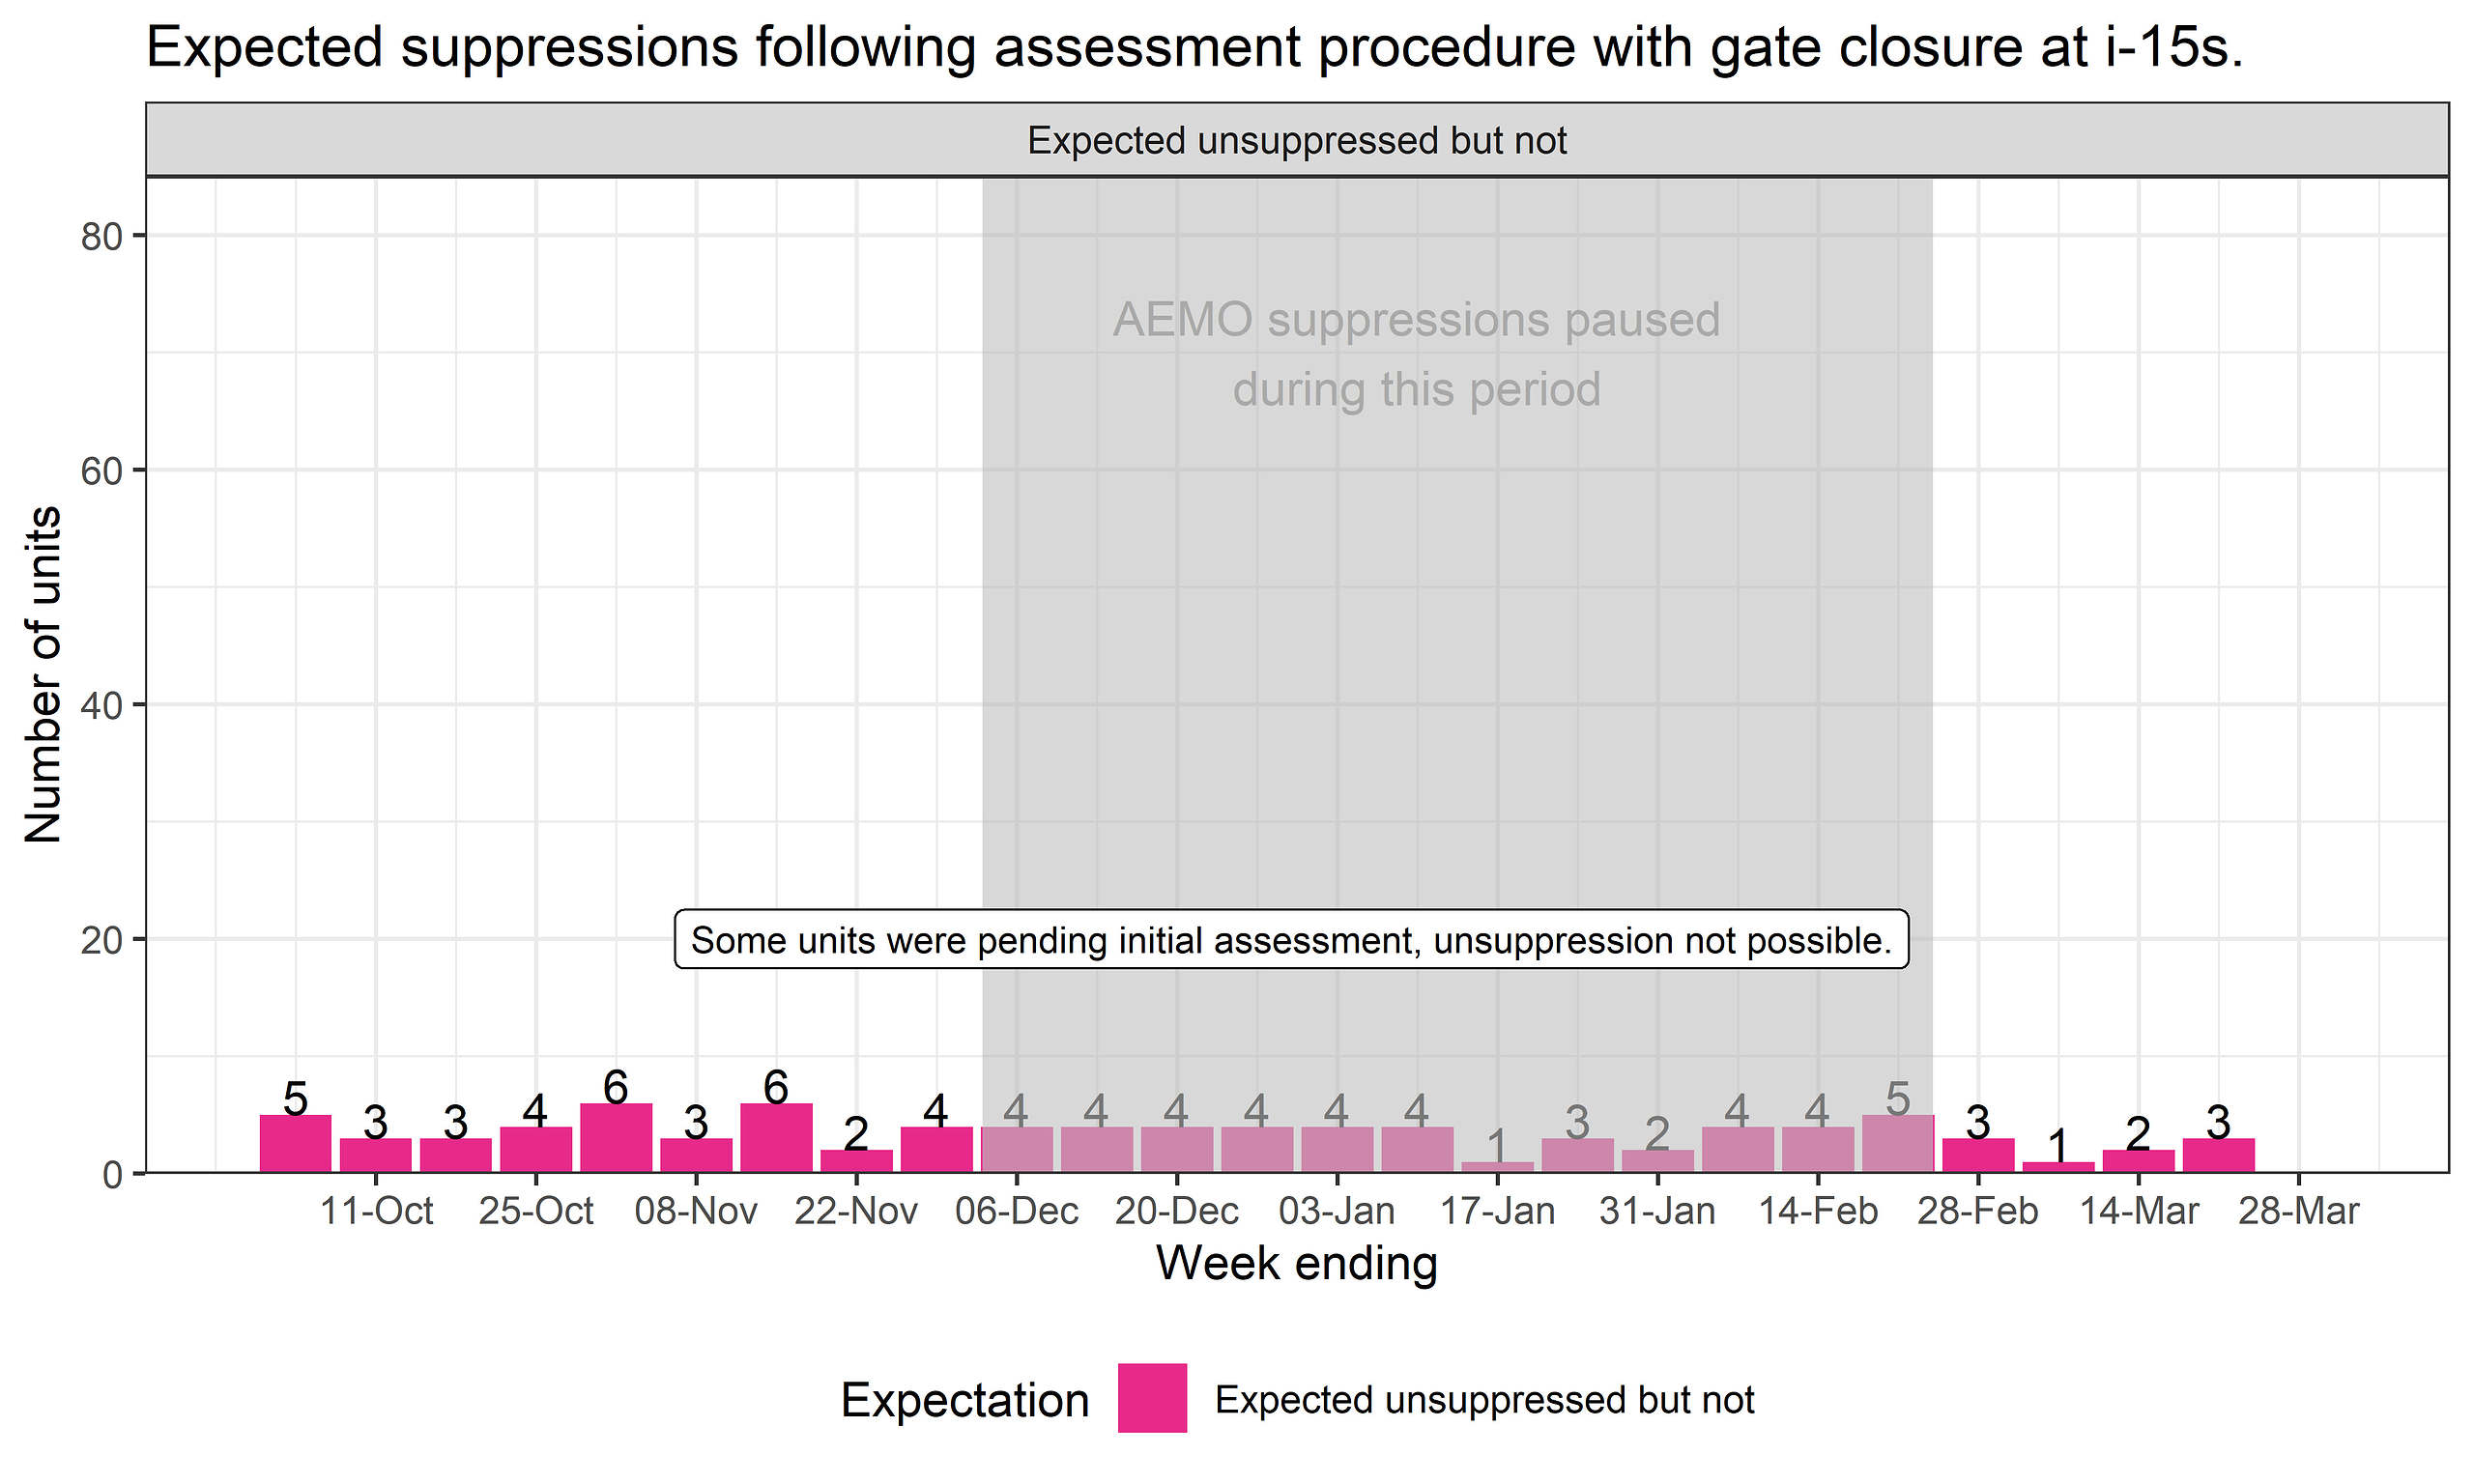
Our implementation of the AEMO performance assessment procedure was reasonably close but not perfect.
The largest discrepancy was for the week ending 28 February. We expected 12 units to be suppressed that were not.
Possibly contributors to the discrepancies include:
-
- Additional intervals excluded: We understand that us that some intervals are excluded from assessment, at AEMO’s discretion, if considered impacted by AEMO IT or submission API issues, where those issues are deemed to limit the ability for participants to submit forecasts. This may have led to some units having insufficient intervals for assessment and remaining in their current state.
- Some intervals not excluded: In accordance with the procedure, where a unit is ‘constrained’ but transmits a possible power value, the possible power value may be used as the actual avoiding exclusion of the interval from assessment. Our assessment didn’t include this step yet data we have obtained indicates this did not impact units where we saw discrepancies in the results. At least 16 units (wind farms) were transmitting good quality possible power data over the period we’ve assessed however most of our discrepancies were at solar farms.
- Some units not yet approved for ongoing assessment: We assessed all units that were issuing unsuppressed self-forecasts, although some appeared yet to pass initial assessment, meaning that even if they did exhibit good performance there were additional barriers to becoming unsuppressed (including the procedure’s reliability requirement. This led to some instances of ‘expected unsuppressed but not’.
Readers should keep in mind that:
-
- We don’t expect suppression expectations to line up during the period when suppressions were paused.
- We don’t have visibility of the actual performance assessment reports and therefore can’t verify precisely which aspects of our implementation are inconsistent with AEMO’s.
(B) Peculiarities and sensitivities
In the process of calculating performance, we noticed two peculiarities.
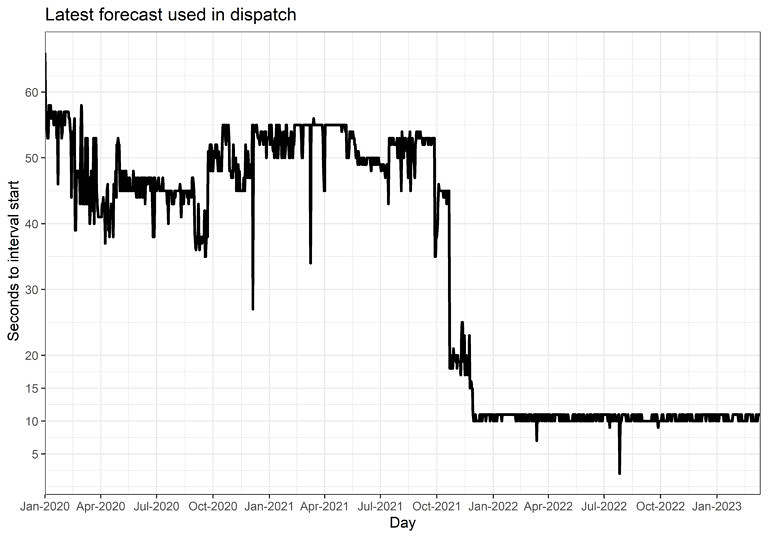
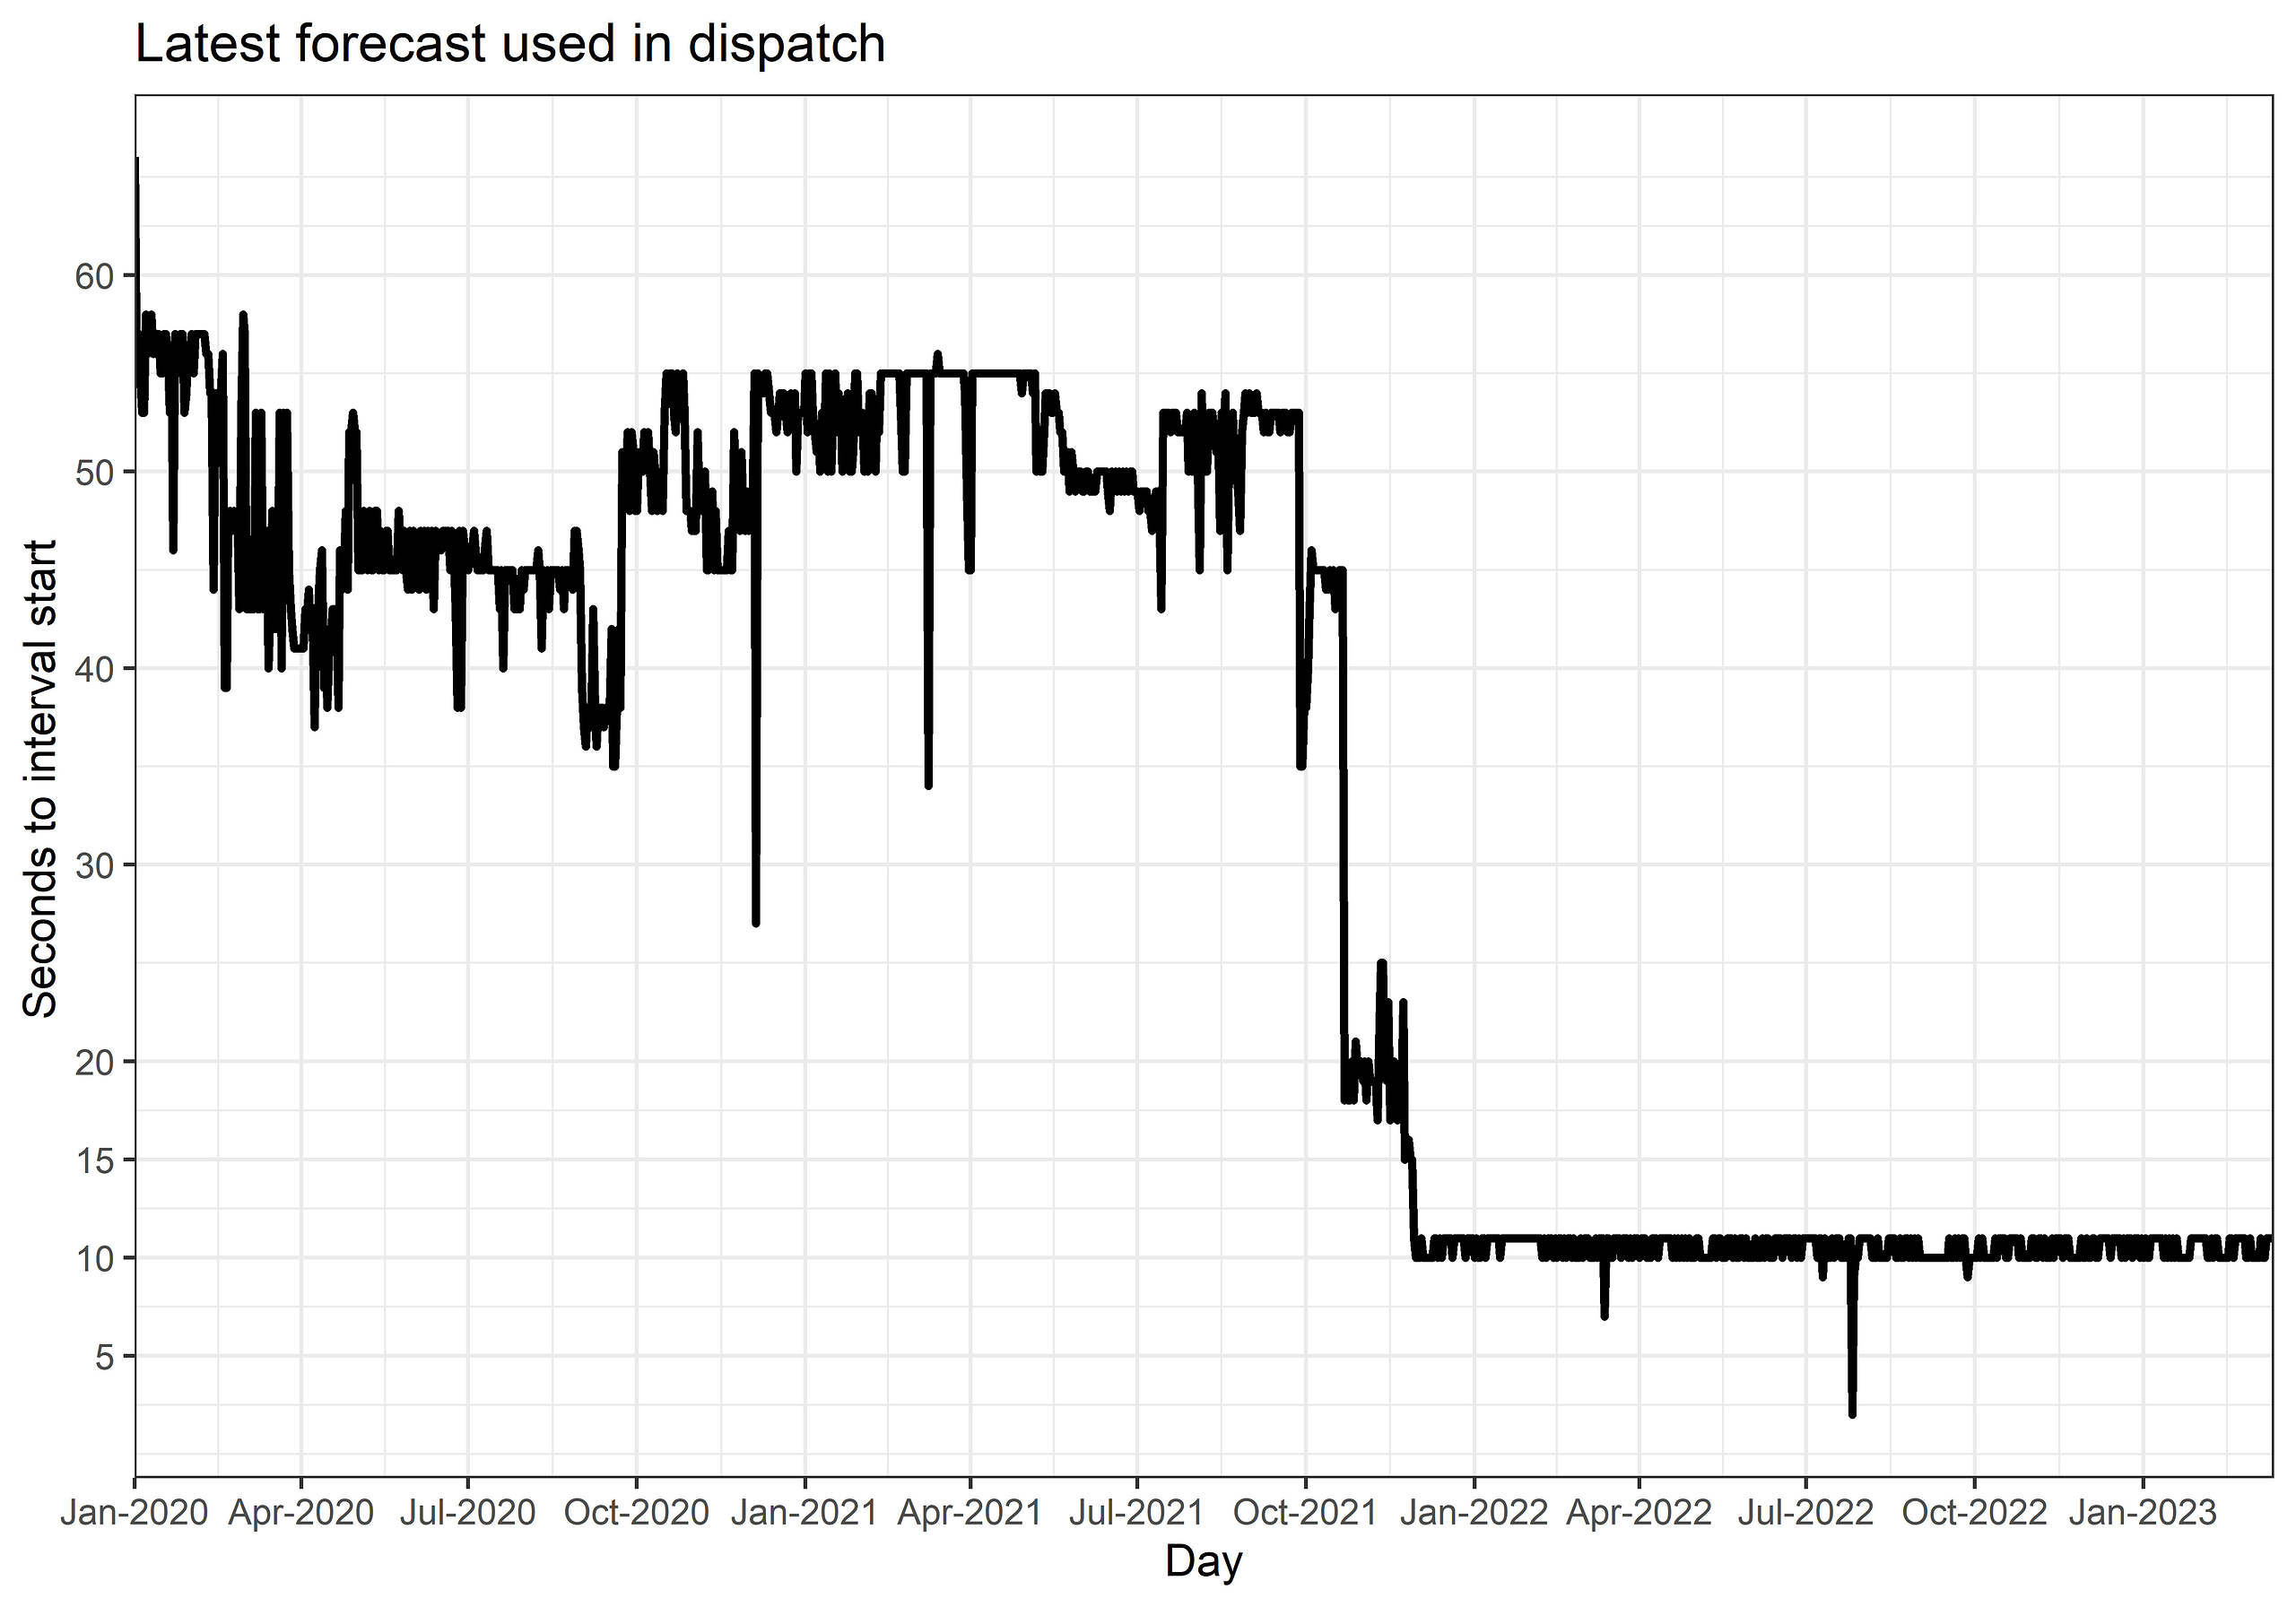
- Many self-forecasts were being submitted after i-15s, and therefore excluded from assessment, impacting either the sufficient intervals measure, or the forecast being assessed. The following chart shows how the latest forecast accepted in dispatch has been near to 10 seconds to interval start (i-10s) since December 2021. The latest accepted forecast reduced from around 50 seconds, in 2021, to 10 seconds before the start of the interval around December 2021.
- Many units end up with insufficient intervals for assessment and remain in their current state, regardless of performance. On some days, at some units, the submission of self-forecasts appeared irregular. This reduced the number or forecasts eligible for assessment.
(B1) Applying the new gate closure time of 10 seconds
The updated procedure applicable from the assessment week-ending 11 April 2023 addresses peculiarity #1. The gate closure threshold was relaxed from 15s to 10s.
To test how this would have played out over past weeks we applied it to our implementation.
The effect of increasing the gate closure threshold to i-10s lets more-recent forecasts be assessed and helps add eligible intervals when only one forecast was submitted (if submitted between i-15s and i-10s).
The following chart shows how the number of correct suppression states changed:
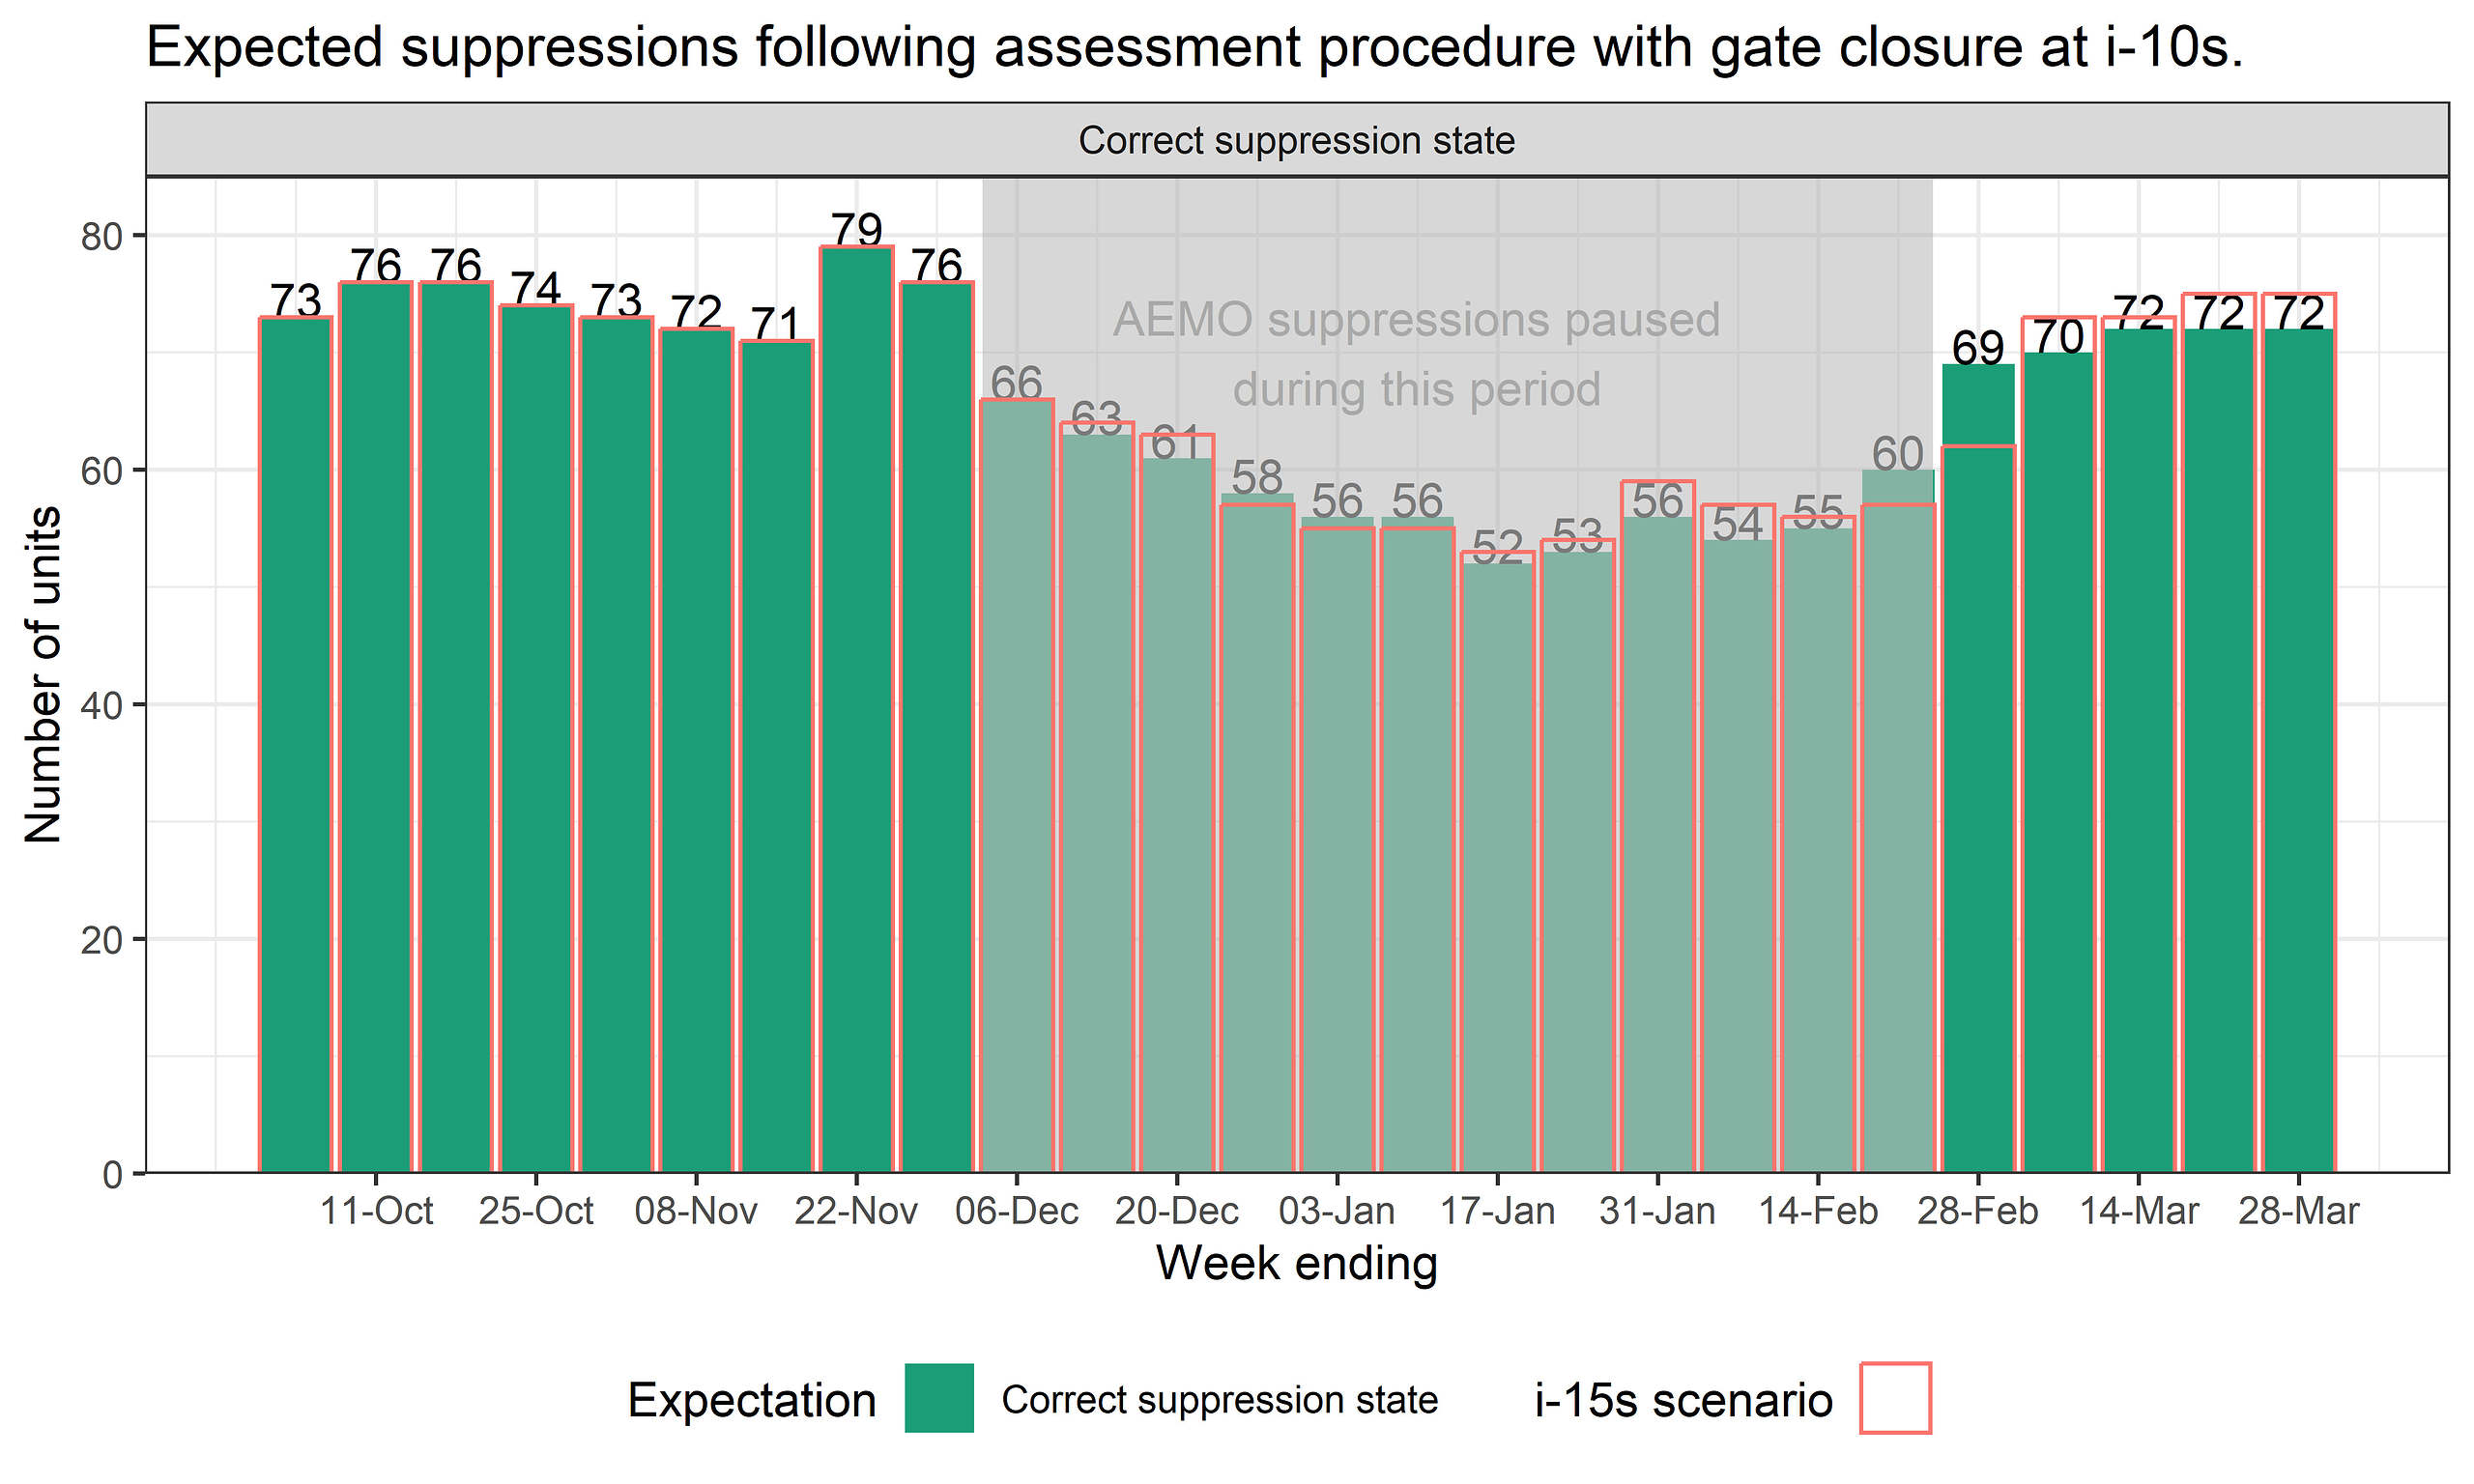
With gate closure threshold to i-10s, we find a small potential for one to two additional suppressions, as indicted in the chart below.
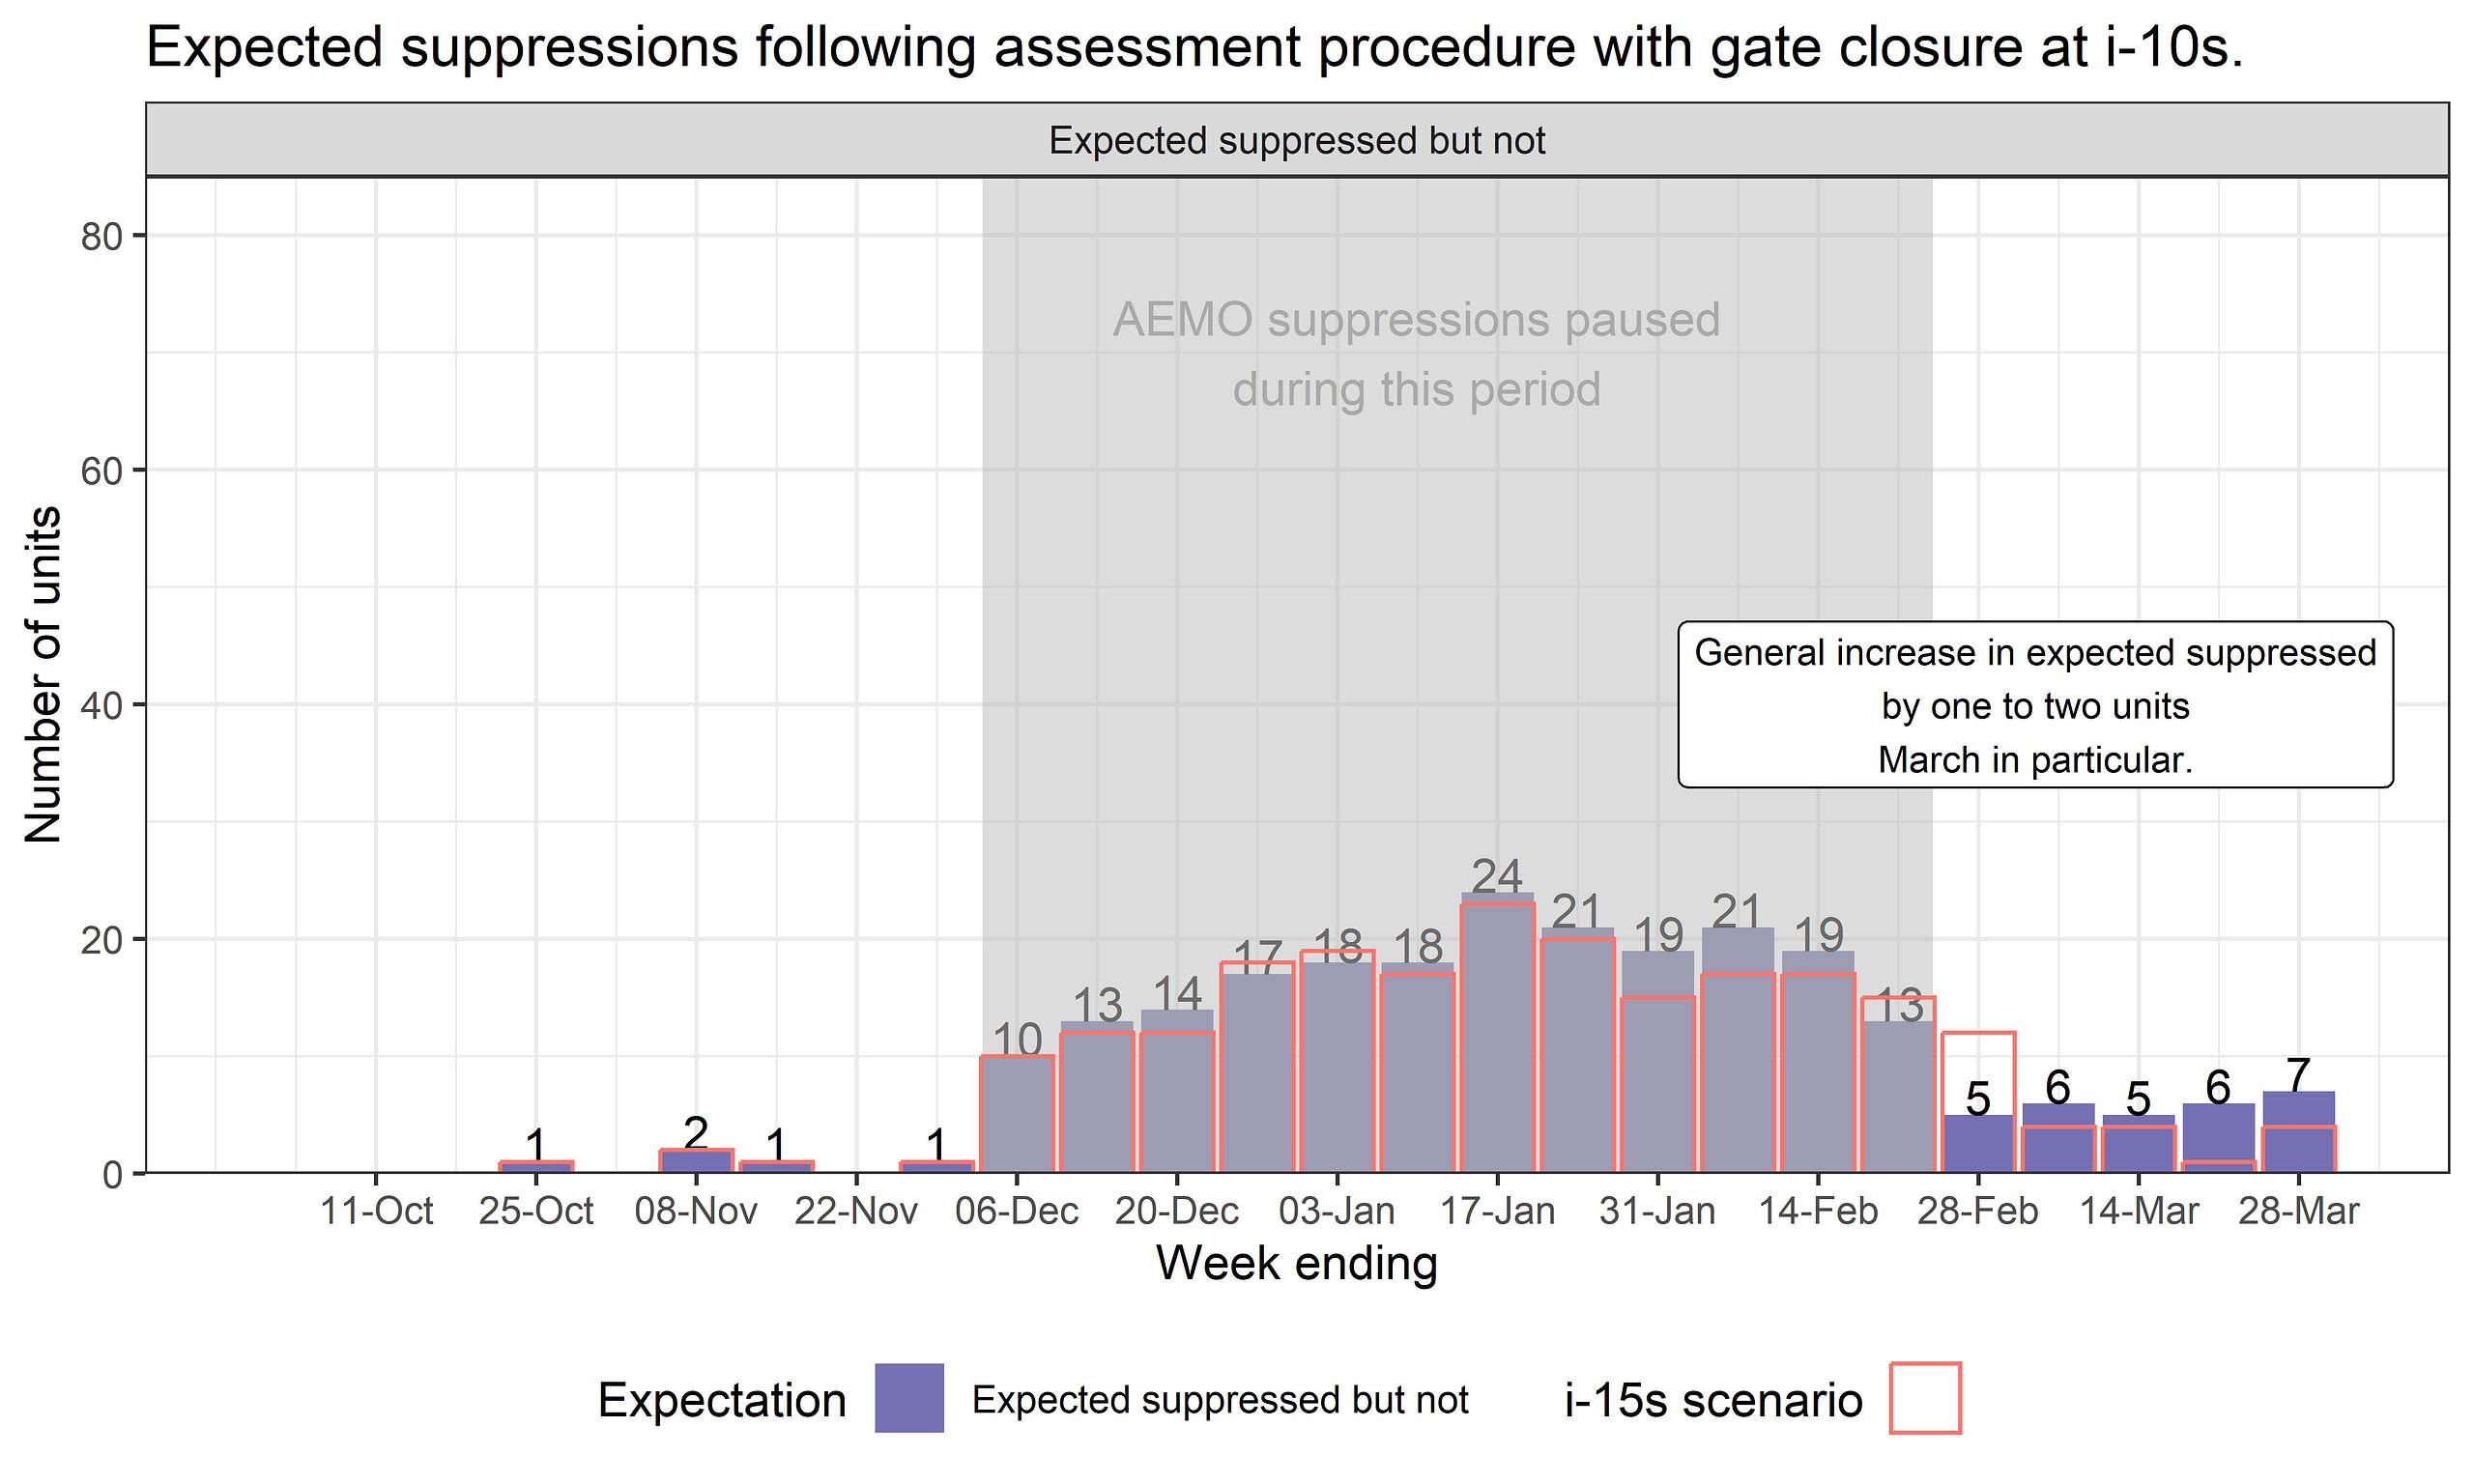
Generally, the chart has higher purple bars (than the i-15s version above) indicating additional units could fail assessment and be suppressed. This is particularly evident in the results for the weeks of March.
However, the increase is in the order of one to two units additionally suppressed. And the result is somewhat opposite to what might be expected – it is feasible that better forecasts (being more recent in time) are able to be included in the assessment with the relaxed i-10s cut-off.
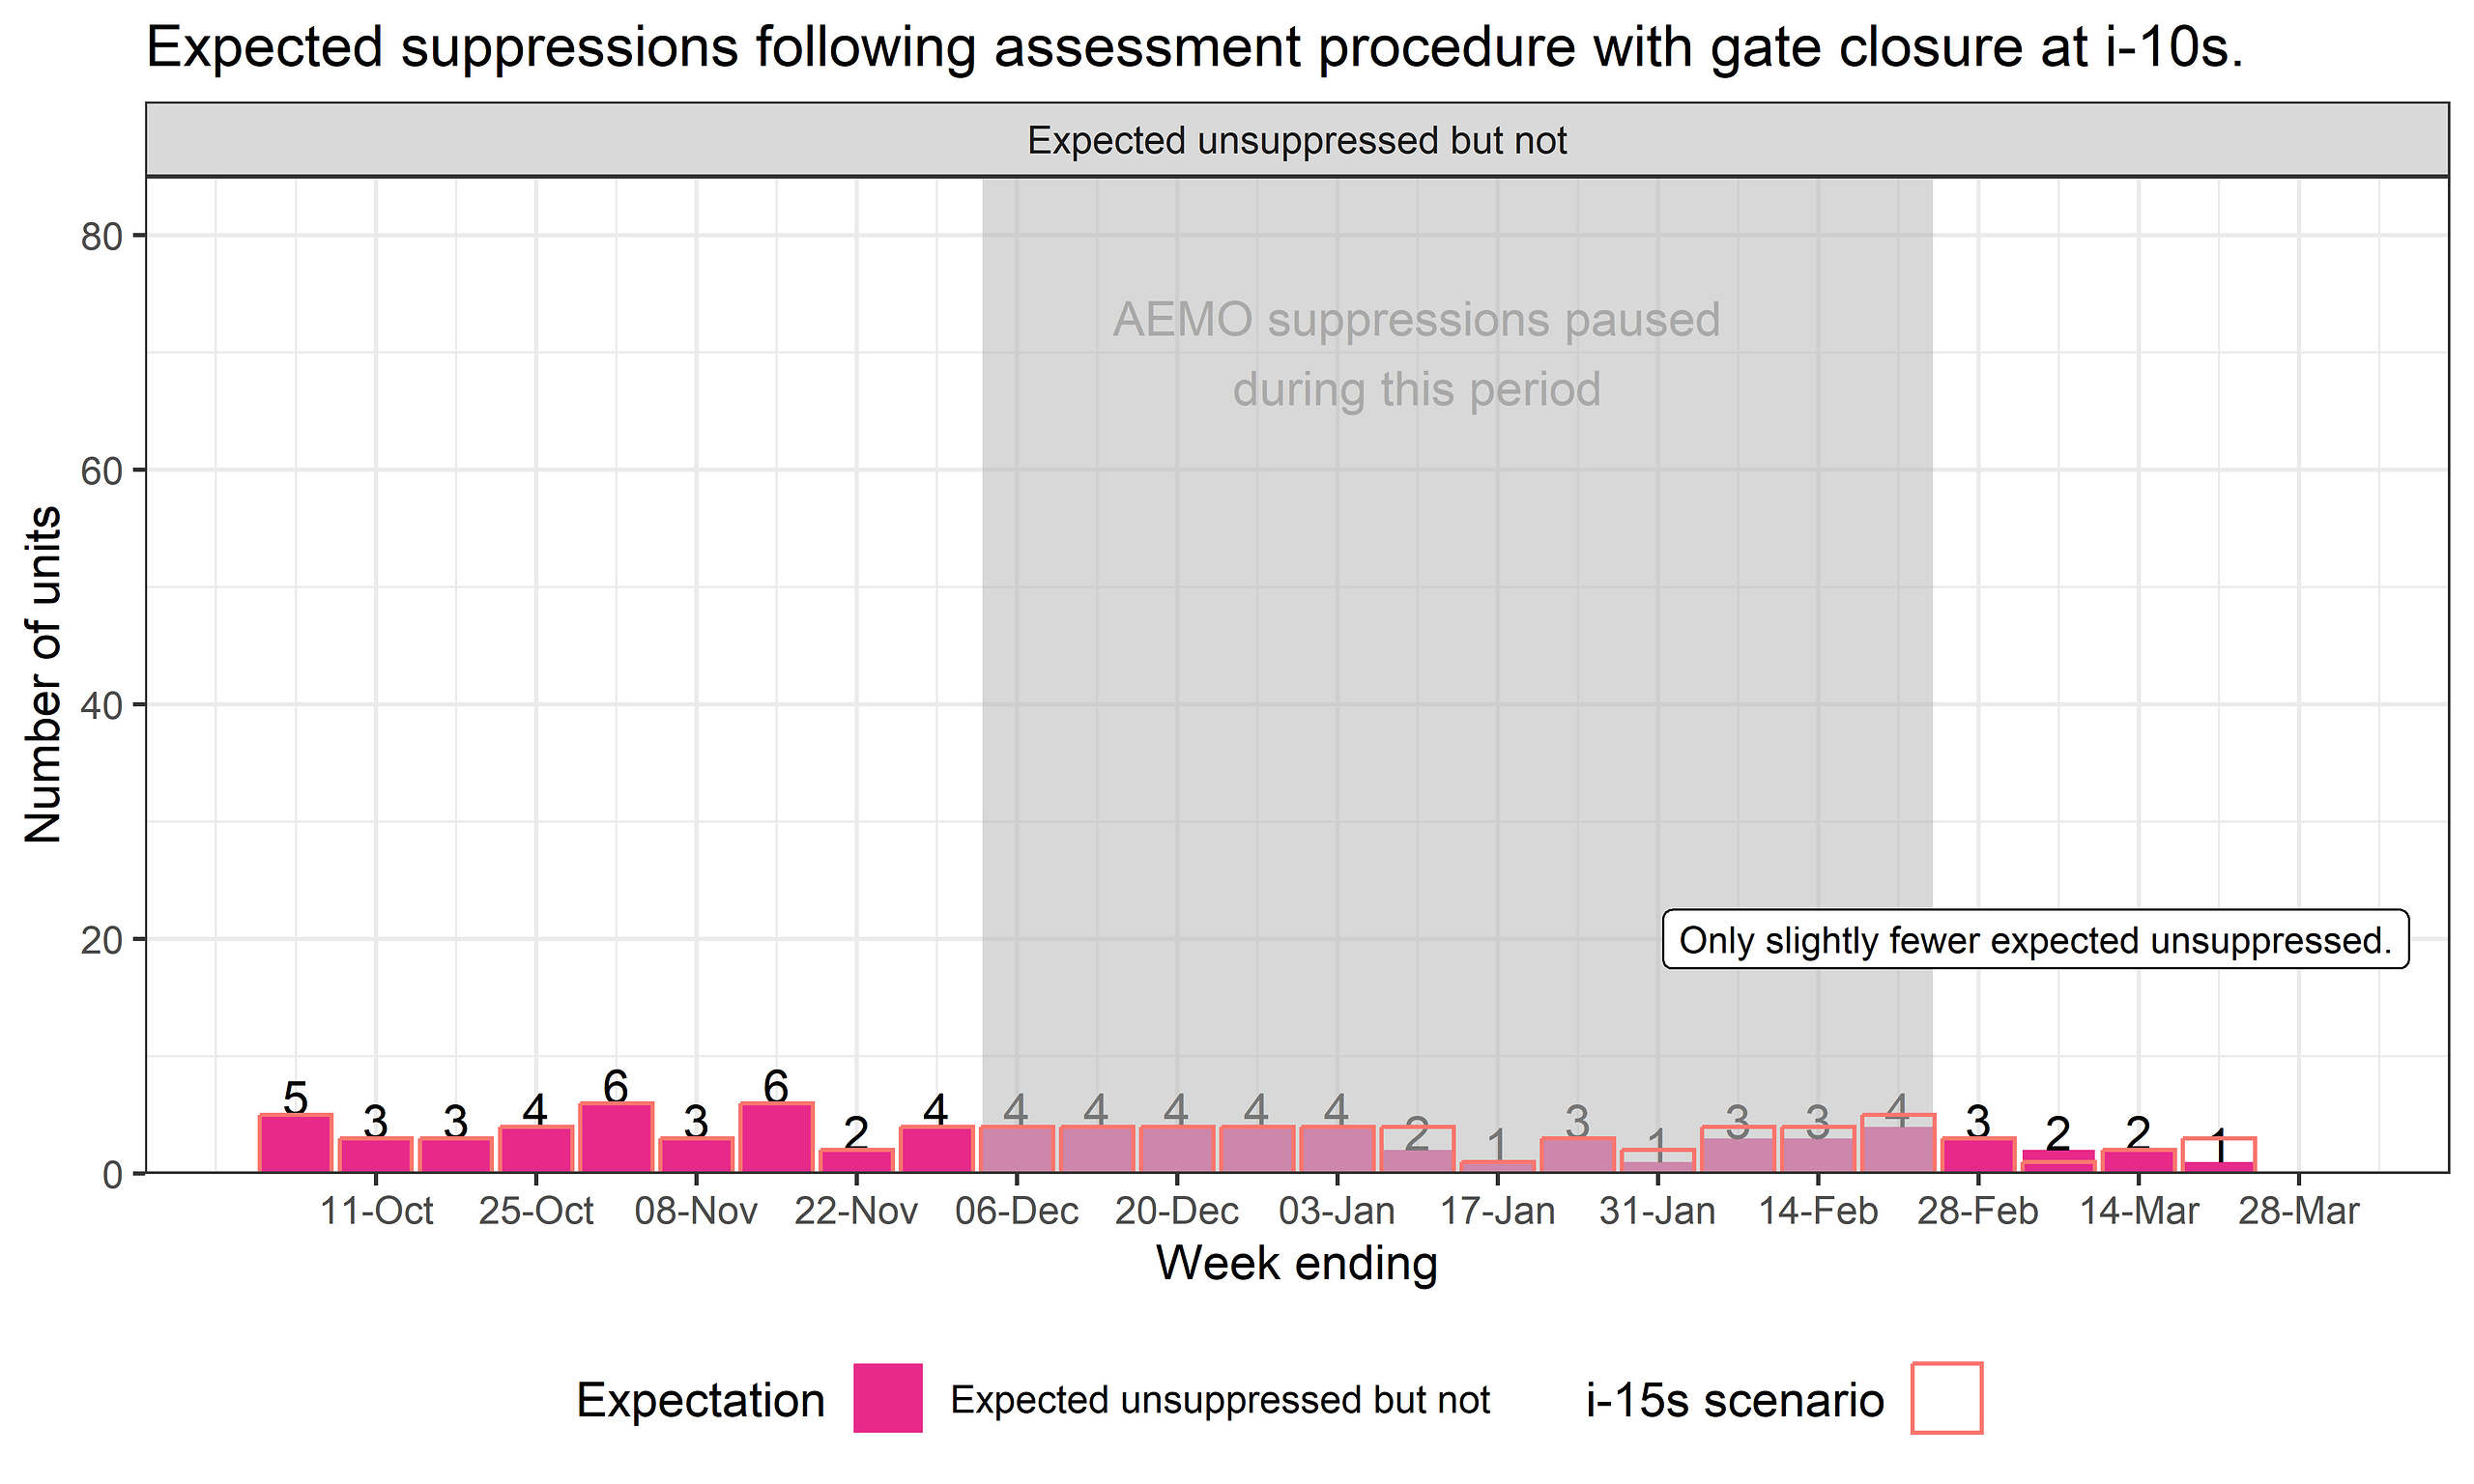
Only slight changes occurred to the number of units expected unsuppressed. This indicates that relaxing gate closure from i-15s to i-10s (although potentially including more accurate forecasts) might not be a significant driver of transitions from suppressed to unsuppressed (or vice versa). It is possible a difference of only 5 seconds doesn’t lead to significant changes in forecast inputs.
(B2) Removing the sufficient intervals requirement
Following our observation that many units end up with insufficient intervals for assessment we further adjusted the implementation to lower the sufficient intervals requirement from 60% to 0% – forcing either a pass or fail result, regardless of how many intervals were assessable.
To test sensitivity to this, we applied it to our implementation, in addition to the i-10s gate closure.
The effect of lowering the sufficient intervals requirement means that units might transition to a new suppression state instead of remaining in the current state (where the majority are unsuppressed).
The chart below summarises correct suppression states relative to the i-10s results. We find the number of correct suppression expectations differs from the i-10s scenario across most weeks.
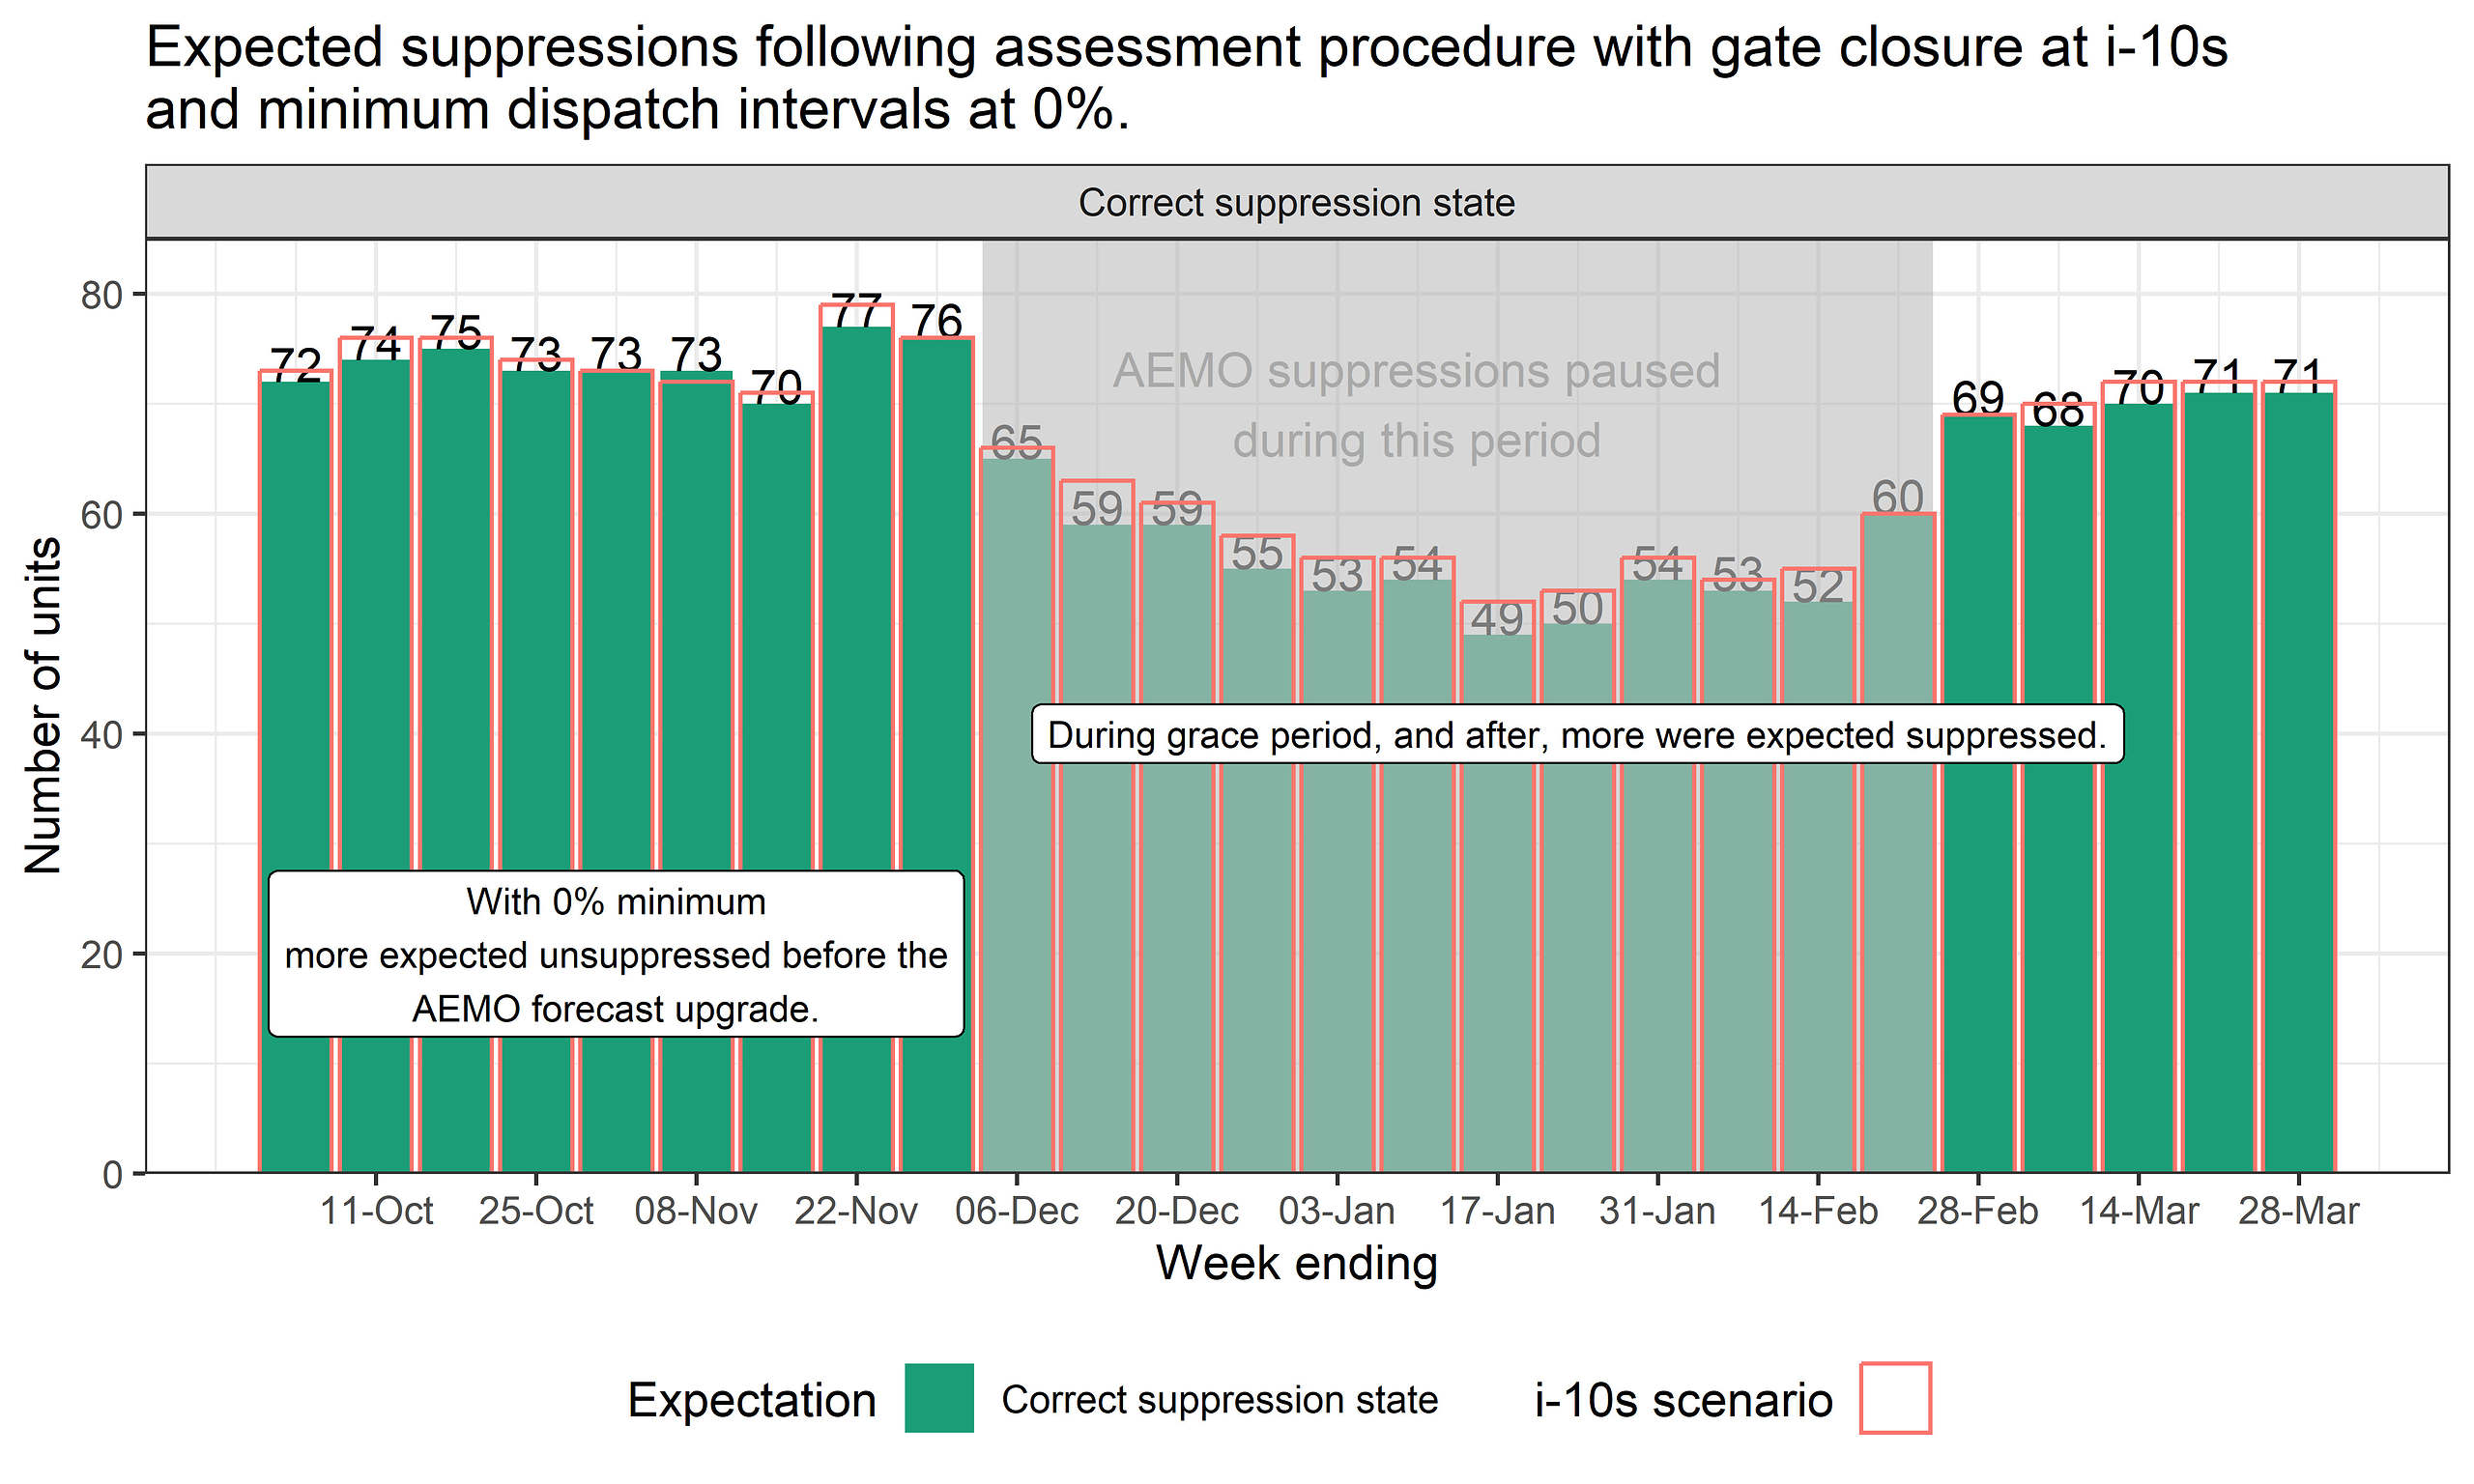
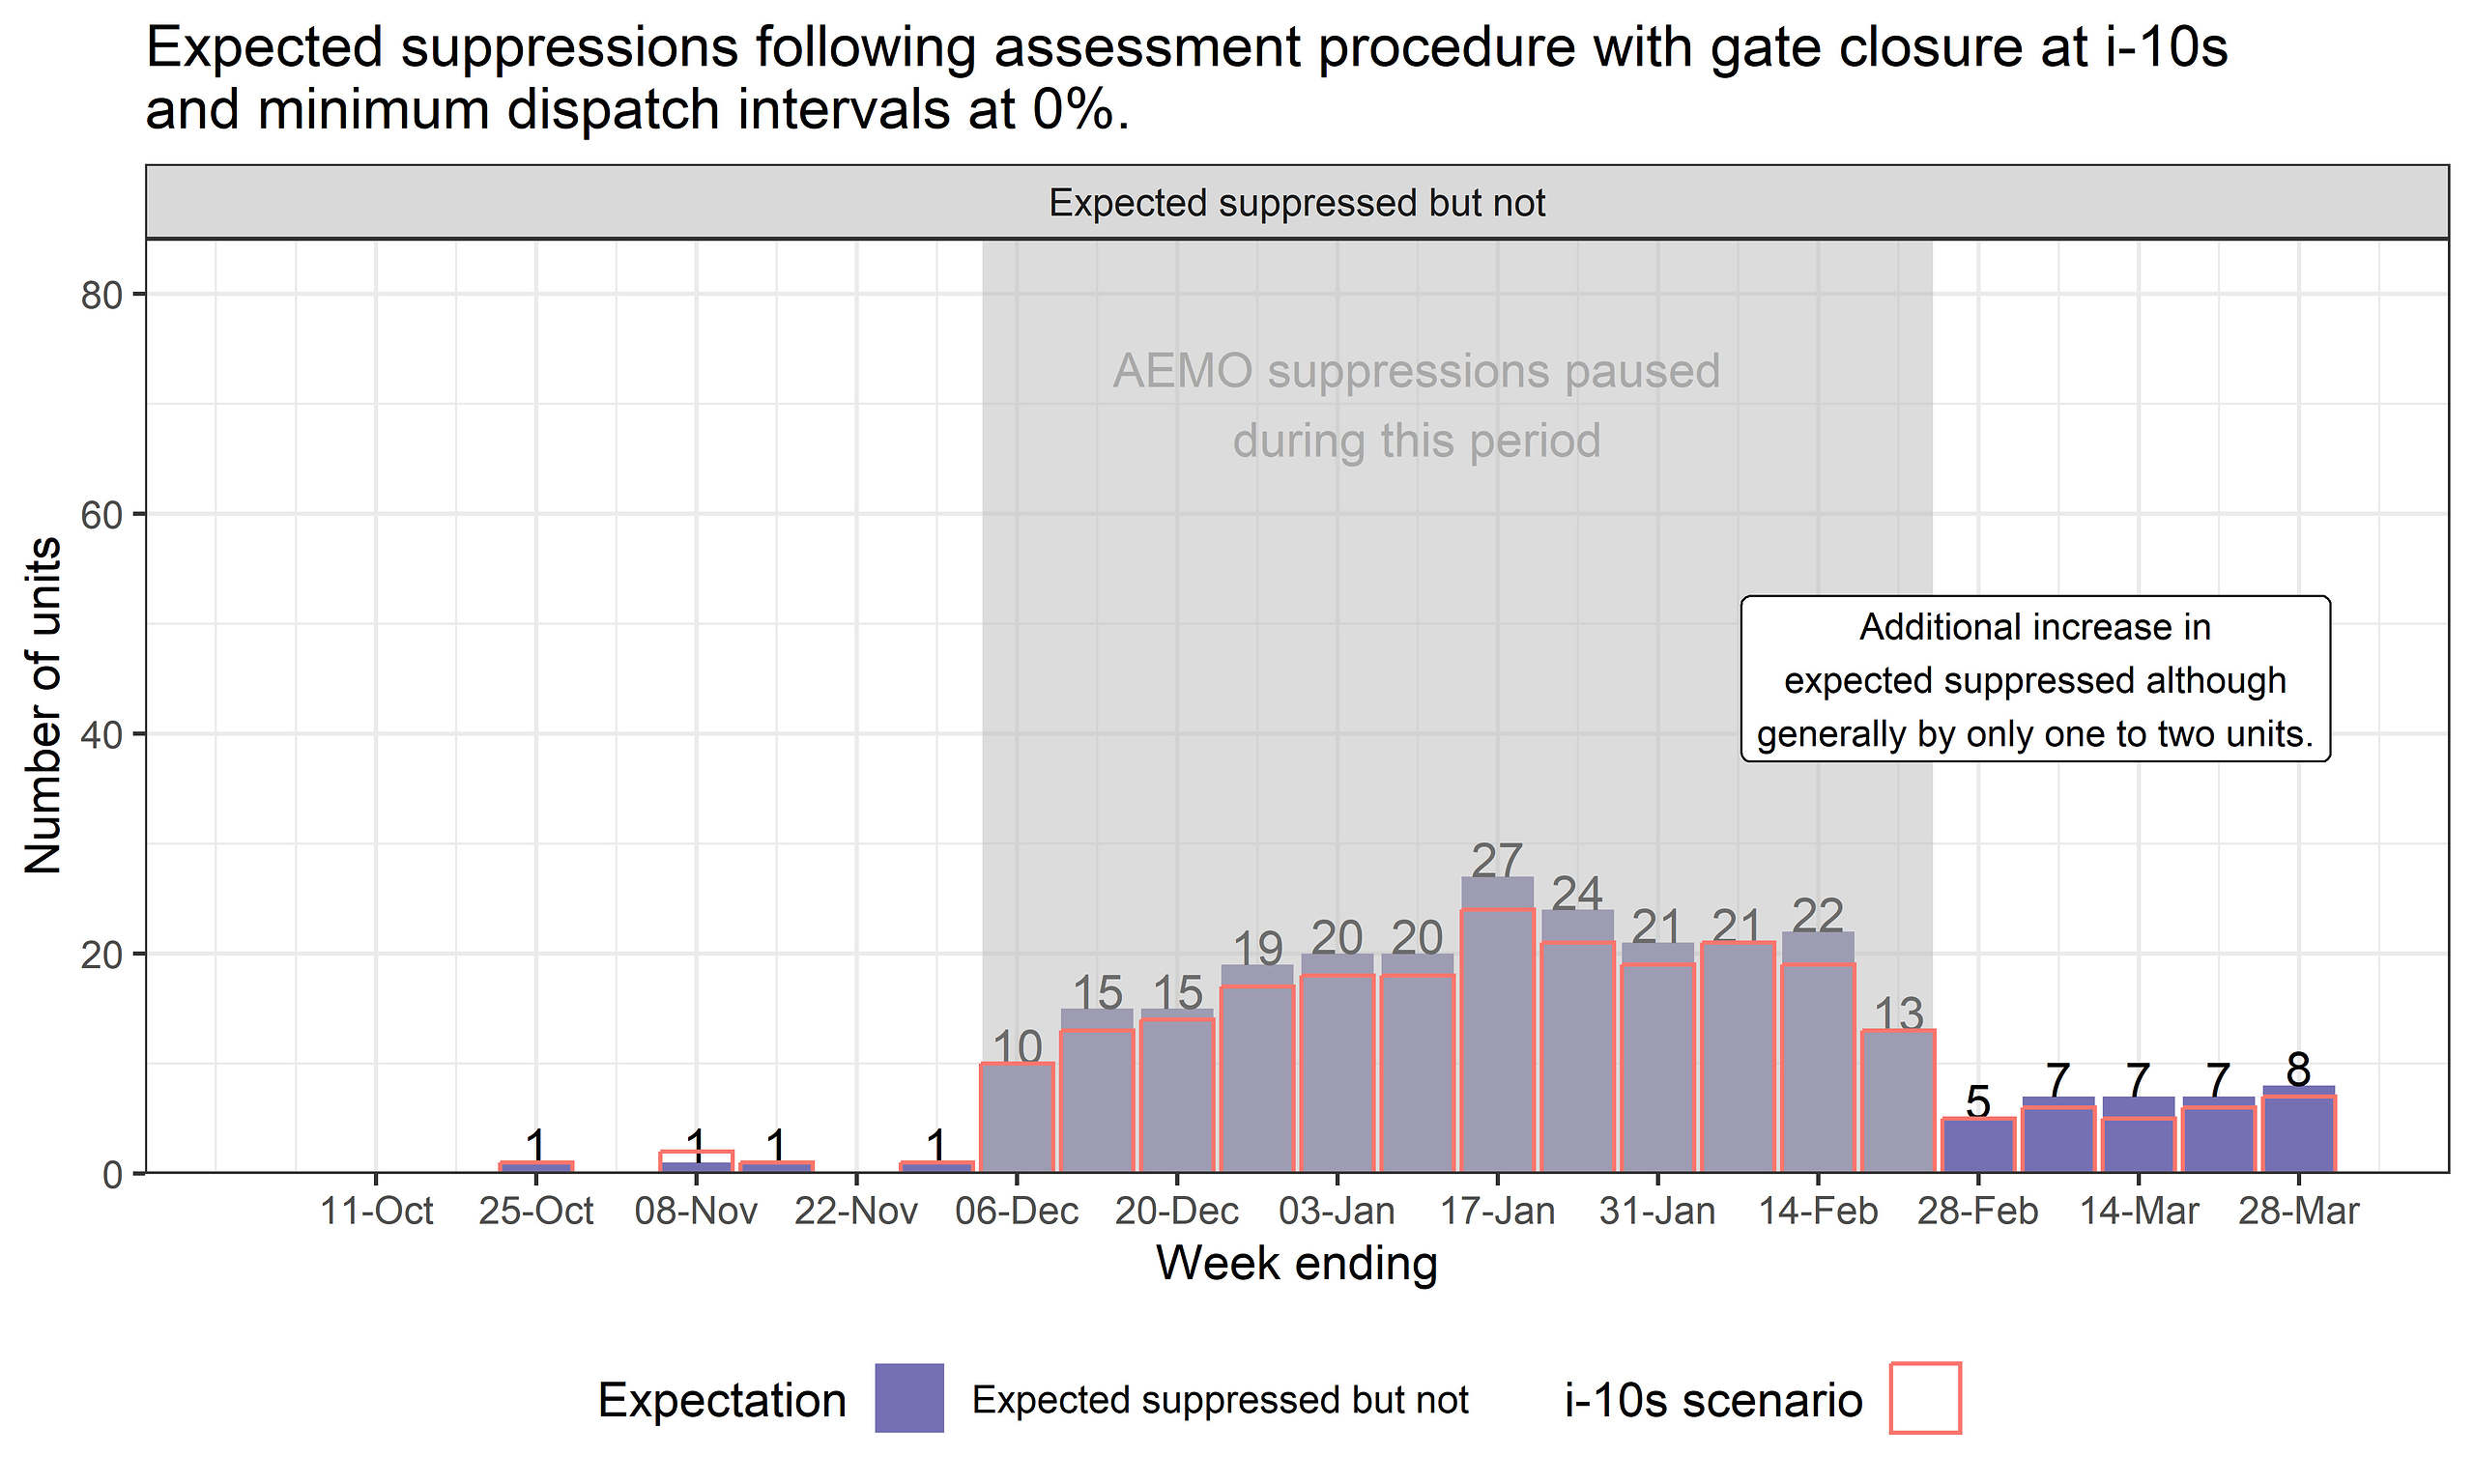
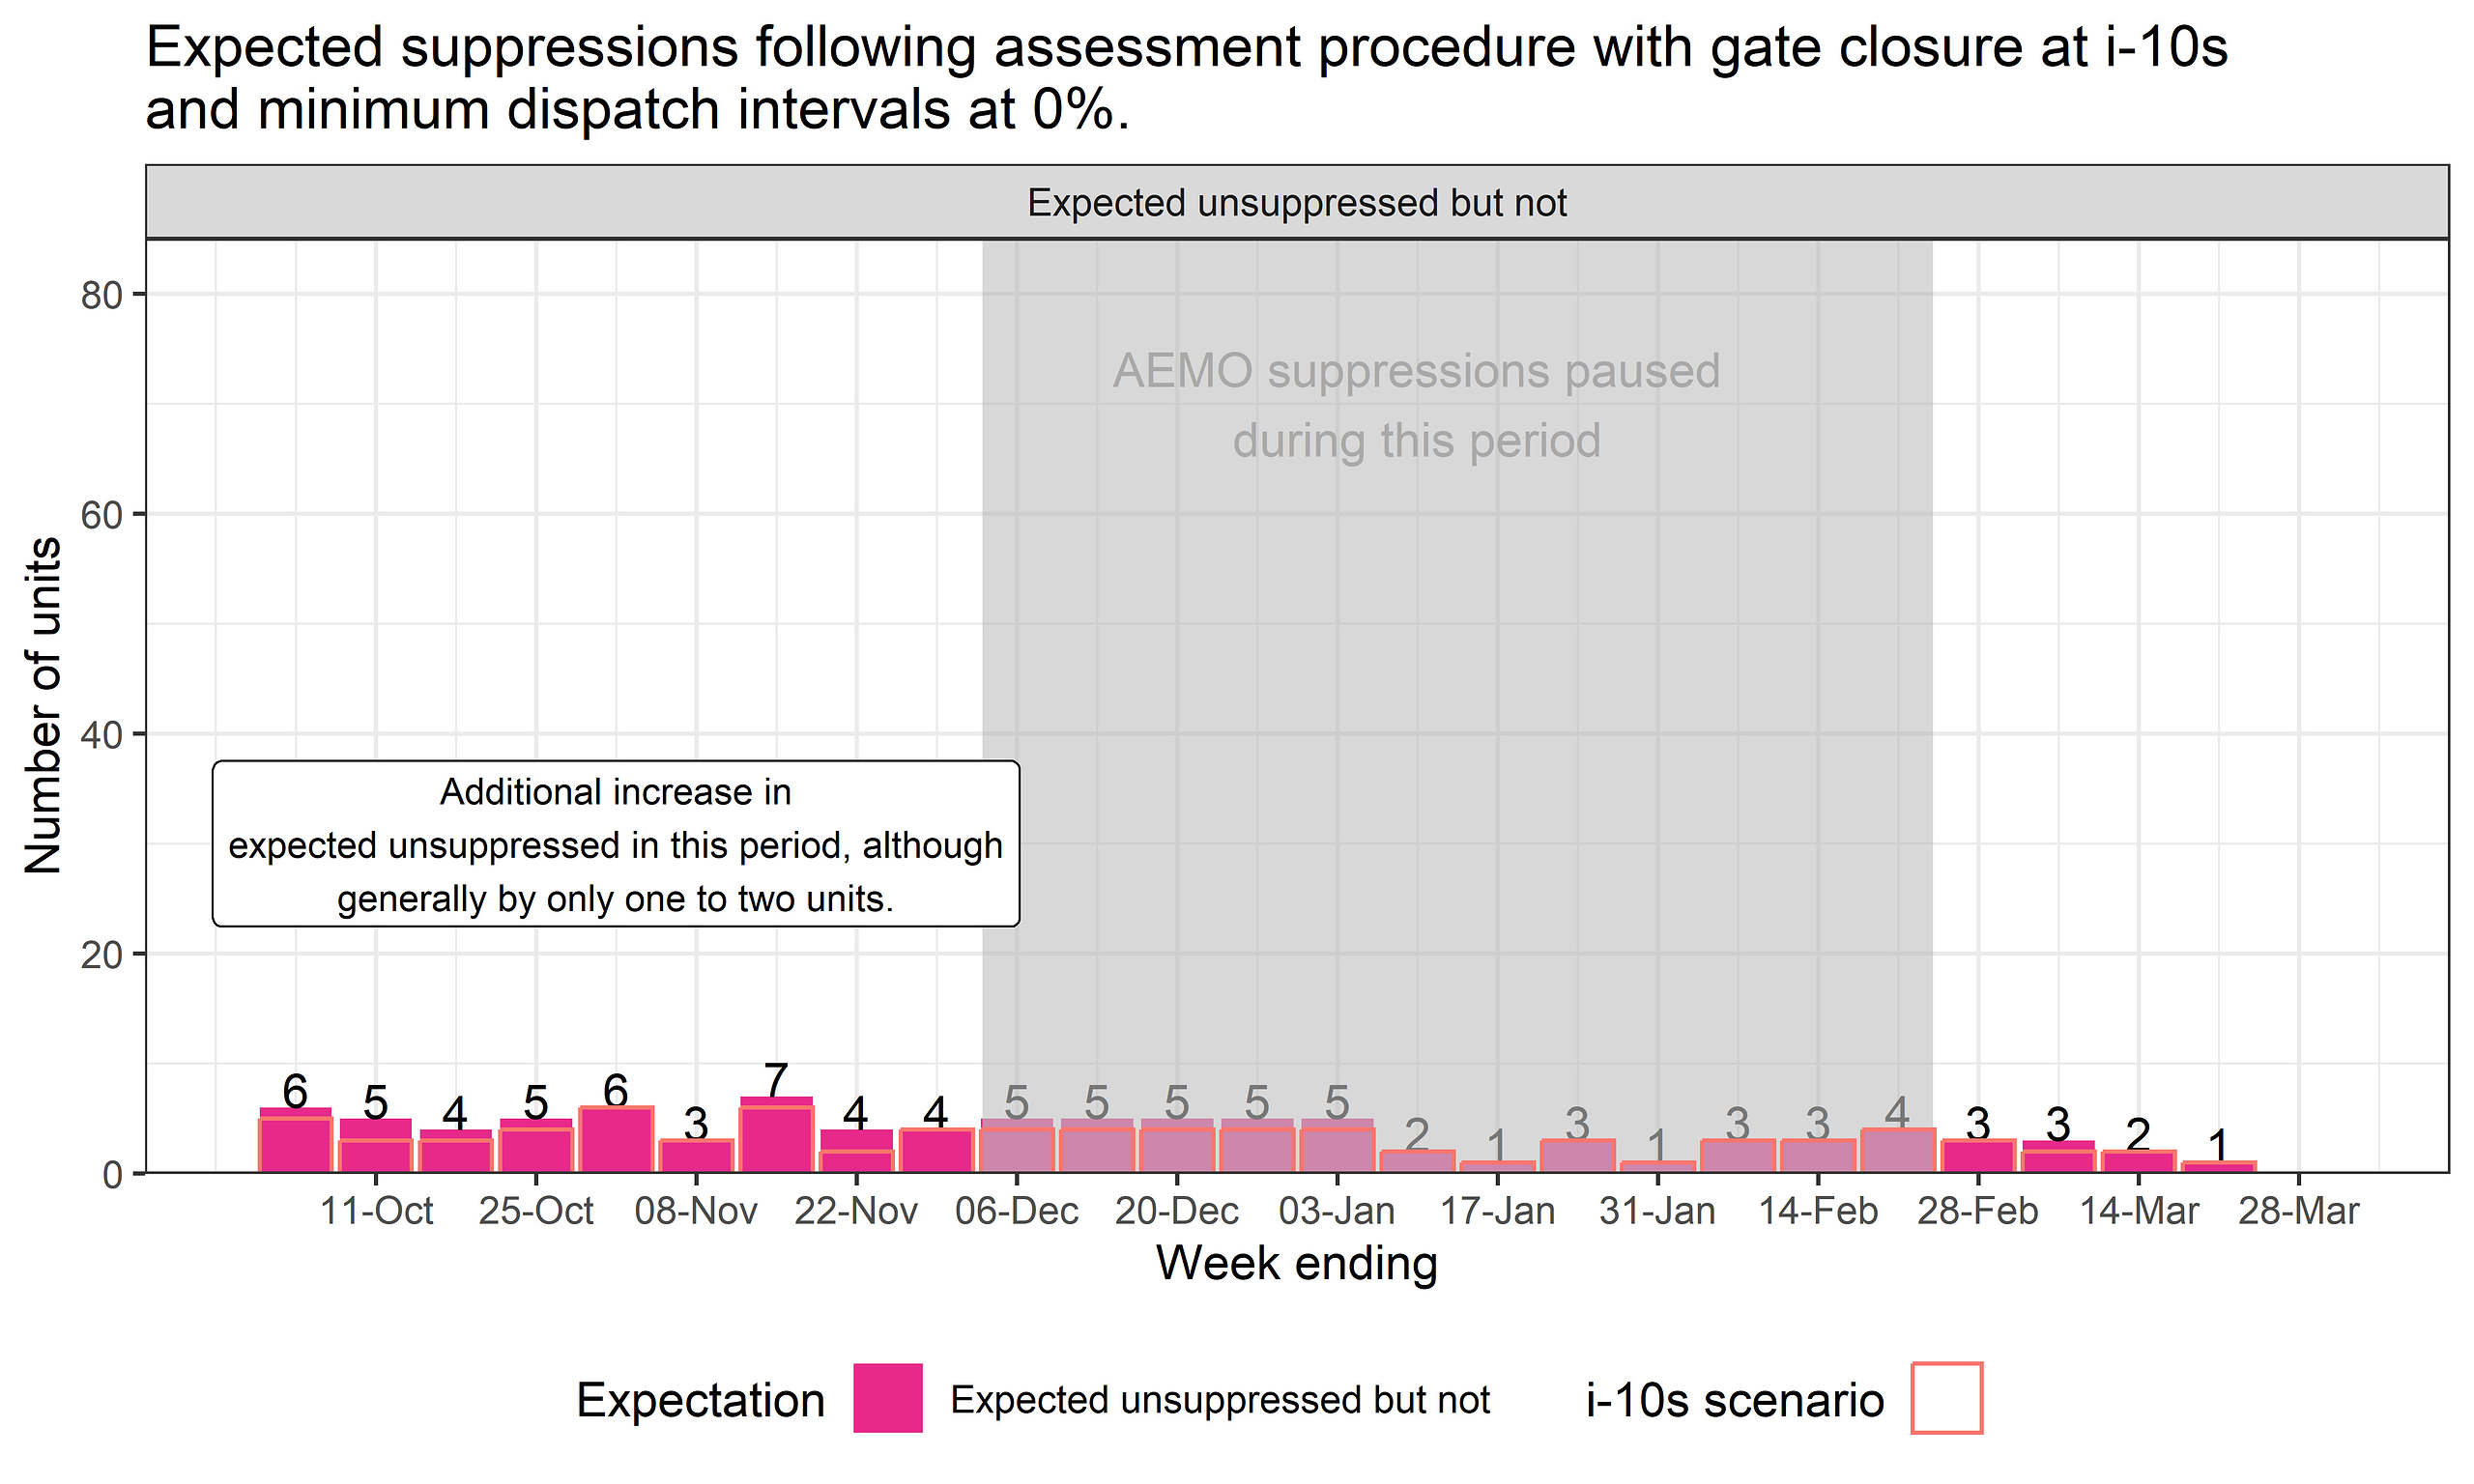
We find an additional increase of one to two units expected suppressed when applying a 0% minimum intervals threshold for assessment during and after the grace period. This is indicated by higher purple bars in the following chart, in the March weeks, relative to the i-10s results.
Prior to December 2022 (AEMO forecast upgrade), changes in expected suppressions associated with a 0% minimum intervals tended to be towards increases in unsuppressed states: More unsuppressed rather than status-not-changed. Although, again, only by one to two units.
(B3) On the percentage of intervals forecast
Previously, Some revelations in GenInsights Q4 2022 about Self-Forecasting, uncovered instances where some unit self-forecasts were not being used under Semi-Dispatch Cap conditions. Whether these instances are due to forecast self-suppression or forecast omission, an eligible self-forecast would be absent, and the intervals would be excluded from assessment, lowering the percentage of eligible intervals overall. This would have the effect of leaving only forecasts made under relatively easier* conditions being assessed, and also potentially lowering the number of intervals to below 60%.
>> * we say relatively easier because, under the Semi-Dispatch Cap, a unit’s output is restricted and therefore not a good indicator of its unconstrained availability for the next interval. Other conditions can still be difficult to forecast if resource potential is extremely variable from one interval to the next.
(C) Closing thoughts
We implemented the self-forecasting assessment procedure to see how participant self-forecasts compared to AEMO forecasts before and after the AEMO upgrade in December 2022. To support participants in managing the change in performance benchmark AEMO-suppressions were paused for three months – the “grace period”.
Our initial run applied the procedure as effective between October 2022 and March 2023. This included a gate closure threshold of i-15 seconds.
Observing the gate closure threshold of i-15 seconds was leading to forecasts being excluded from evaluation, and in conjunction with the updated procedure effective April 2023, a second run applied a gate closure of i-10 seconds.
Outcomes of the assessment process also depend on the percentage of intervals included. We conducted a third run to test sensitivity to lowering the minimum percentage of intervals from 60% to 0%, such that all units would be assessed into a pass or fail result.
(C1) Expected suppressed increased during the grace period
All runs indicated a significant increase in units expected suppressed during the grace period, owing to a decline in performance relative to the AEMO forecasts. However, uncovering to what extent this was due to the improved AEMO forecasts or changes in participant forecasts remains a task for another day.
(C2) Gate closure and the forecast assessed
Reducing the gate closure to i-10s for forecasts assessed, reflects current submission practices by participants, and the new procedure from April 2023.
Results from the change to i-10s indicated one to two additional suppressions would occur. This is somewhat opposite to what might be expected – it is feasible that better forecasts (being more recent in time) are able to be included in the assessment with the relaxed i-10s cut-off.
(C3) Sufficient intervals
The procedure requires the number of intervals assessed to be greater than 60%.
The assessment procedure results in a ‘no change’ to suppression status when insufficient intervals exist for assessment. This means that forecasts that are performing poorly, but not meeting the sufficient intervals criterion remain as unsuppressed.
Our test indicates that most suppression states would not change if the 60% threshold was lowered. This is attributed, mostly, to the good relative performance of the self-forecasts that were issued.
Nonetheless it should be acknowledged that the intervals with absent forecasts are not able to be assessed. It is not possible to know what would have been a unit’s self-forecast performance during all intervals when many are absent:
What would performances look like if units were required to reliably submit forecasts for all or most (say 95%) intervals?
Leave a comment