Dan Lee posted late this afternoon about expectations for a new all-time demand record for the QLD region on Friday 17th March 2023. Now that the sun has set and the heat is receding (somewhat) it’s useful to delve into what actually happened.
With respect to the following, useful to keep in mind these gory details about the different measures used for reporting on electricity demand (it’s not as simple as it might initially appear!)
(A) New all-time record for ‘Operational Demand’
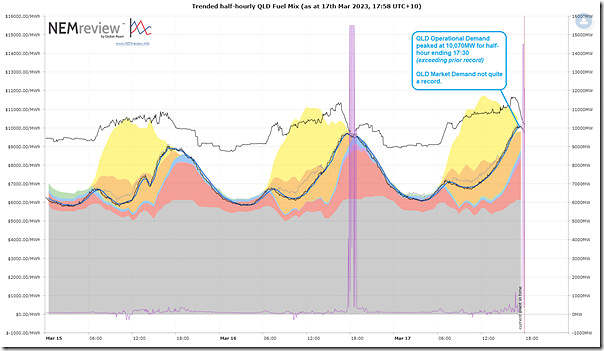
AEMO increasingly talks about ‘Operational Demand’ (which we also call ‘Grid Demand’ on occasions), because that’s a measure that most closely relates to their role of ‘keeping the lights on’ in the NEM. Using this query developed in NEMreview v7, we’ve taken a quick look and it looks like:
1) It reached 10,070MW for the half-hour period ending 17:30 NEM time;
2) And that this was 12MW higher then the prior record set in the half-hour ending 19:00 on Tuesday 8th March 2022 … so a new all-time record!
… no doubt AEMO Media people will be along soon with the official confirmation.
(B) Not quite a new all-time record for ‘Market Demand’
Another measure of demand still frequently used (and the one used from the start of the NEM) might be thought of as ‘Market Demand’ as it most closely relates to the price and dispatch outcomes seen in the NEM. For those familiar with MMS lingo, it’s ‘Total Demand’ (though ironically is increasingly not total demand).
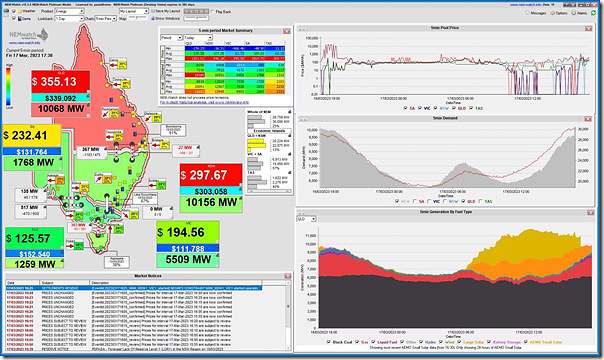
This is what’s shown in our NEMwatch software, for instance (and what Dan referred to earlier). In this respect:
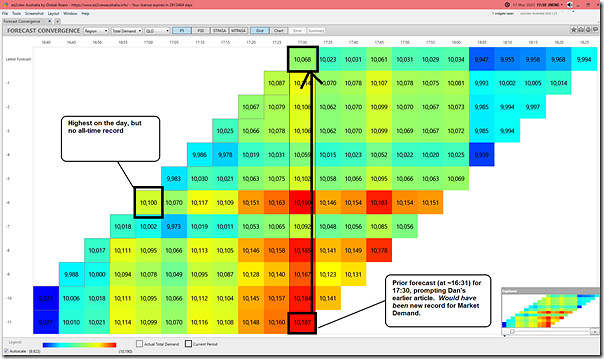
1) Dan’s article highlighted the forecast that Market Demand was forecast to reach 10,187MW at 17:30 (in AEMO’s P5 predispatch forecast)…
… which would have exceeded the peak level seen (of 10,119MW) on in the dispatch interval ending 17:30 on Tuesday 8th March 2022;
2) However that did not come to fruition, with demand dropping faster than the AEMO had expected at the time of Dan’s article. Here’s an updated view of the ‘Forecast Convergence’ widget in ez2view, revealing successive forecasts for 17:30 and the eventual end-point of 10,068MW (51MW below the prior record):
3) We see that the highest the Market Demand reached this evening was 10,100MW for the 17:00 dispatch interval (only 19MW below the all-time record).
4) For broader context of market conditions, here’s a snapshot from NEMwatch at 17:30 … with the Market demand clearly still in the ‘red zone’ compared with the historical range:
That’s all for now…


Be the first to comment on "New all-time record for Operational Demand in QLD on Friday 17th March 2023 … but not for Market Demand"