
Over the past four days, extreme humidity and high temperatures have been driving record electricity demand in the sunshine state. As we’ve reported on WattClarity, the recently set record is forecast to be broken once again later today (with an LOR2 condition currently forecast). In this article, I’m going to do a short examination of each component of the region’s generation mix over the past four days – the period spanning between Thursday January 18th to this morning January 22nd – to understand the supply-side dynamics of these extreme market conditions.
To begin, the image below is a high-level summary of the QLD dispatch price, market demand, and generation mix over the past four days.

A high-level summary of price, demand, and generation in QLD over the past four days
Source: NEMreview
This chart has been trended on a half-hourly cadence (as opposed to the 5-minute cadence of the NEM) to account for the availability of rooftop PV estimate data. In relation to this image above, I point out some key features of the chart:
- Very high demand (by any historical measure) in QLD in the early evenings. Before this, the record for market demand in QLD was 10,119MW.
- Very high late afternoon/early evening prices on Thursday, Friday, and Sunday, hugging the market cap on both Friday and Sunday.
- These high prices coincided with relatively tight margins between available generation and market demand.
- A consistently low contribution of wind generation over these days.
- Also small (but perhaps important) contributions from hydro, liquid fuel, and battery.
That’s just a high-level summary to preface the bid/offer data displayed below. Paul and the team have already delved into some of the more specific outcomes and constraints in the market. We have published further, more in-depth, coverage of market outcomes for Thursday, Friday, Sunday, and the evolving conditions for later today.
Bids/Offers per Fuel Type
This analysis has been compiled together very quickly, but to dig a bit deeper, I’ve used our bids & offers widget within ez2view to have a look into how each component of the generation mix performed.
The charts below show stacked generator bid volumes in QLD, broken down by fuel type. In each of these charts, the look-back period is 5 days from 11 am this morning. The faint dotted blue line shows the resulting QLD dispatch price (RRP) which relates to the right y-axis.
It is important to note that rebids would have played a significant role in price outcomes yesterday (and not just in QLD..) – as time permits, we hope to come back and examine how bids evolved and converged on actual outcomes.
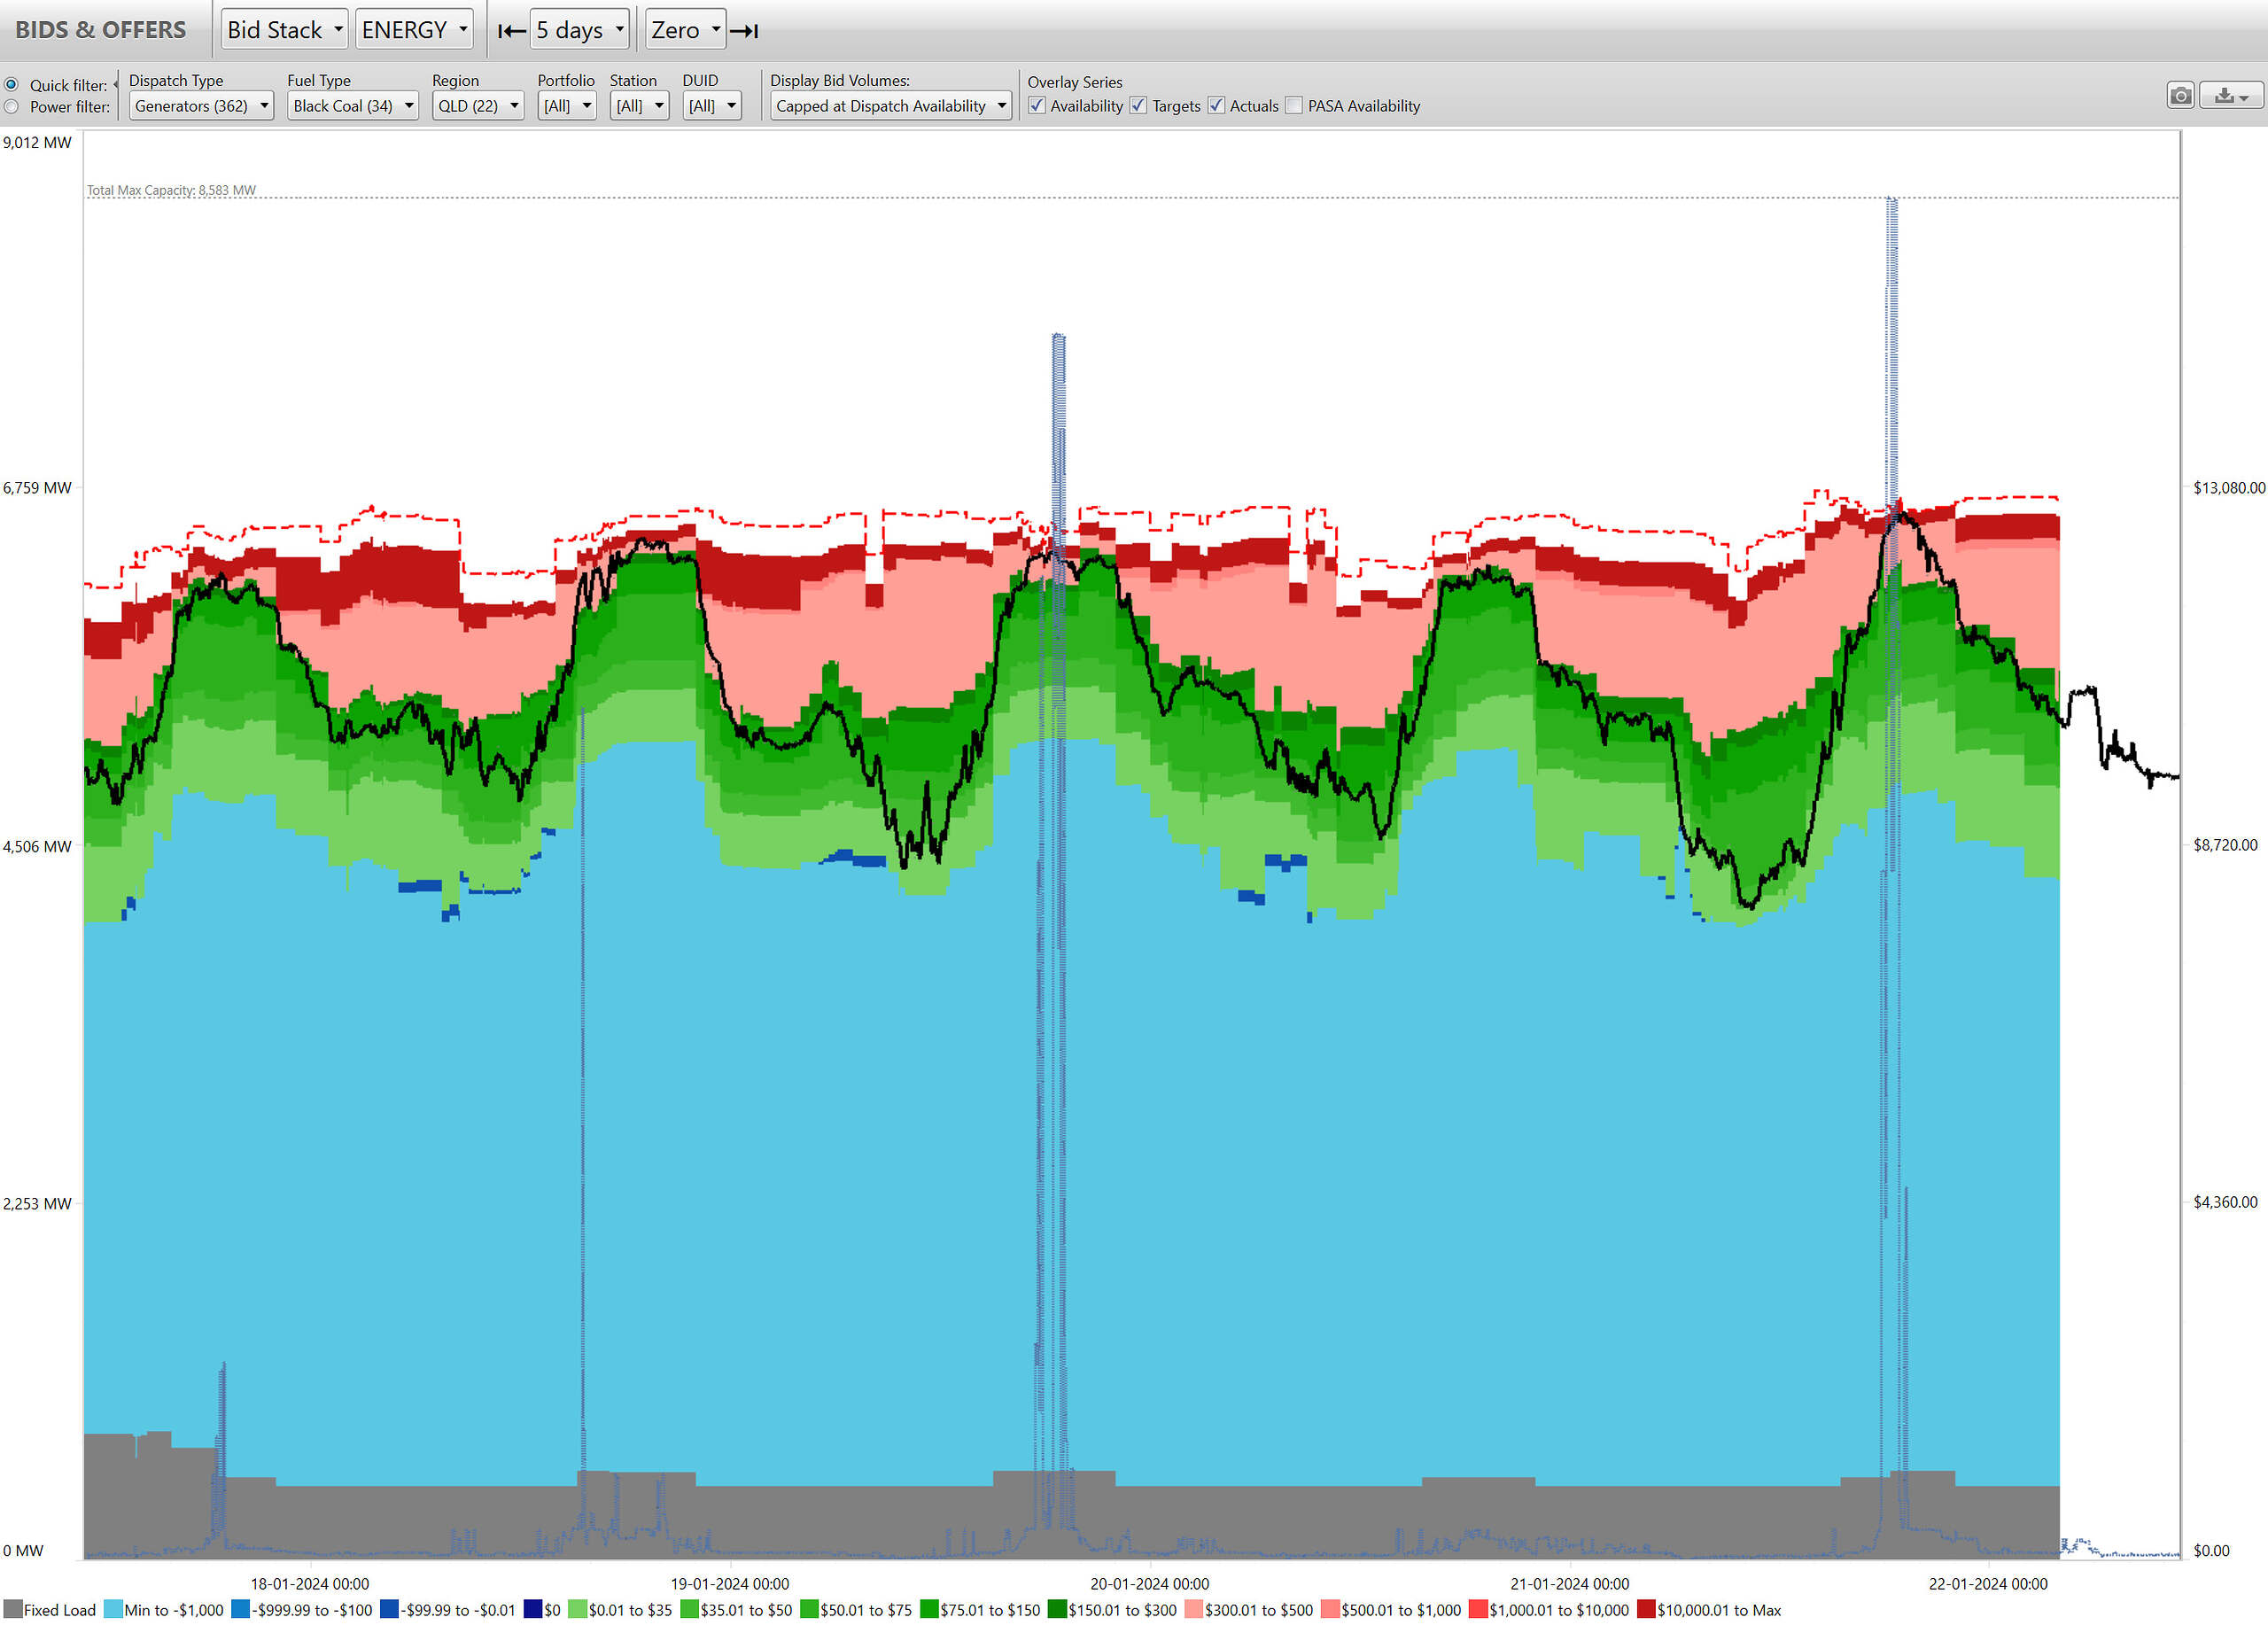
Black Coal
Let’s begin with the biggest contributor to the fuel mix over the past four days – black coal. QLD’s black coal fleet has a combined 8,583MW of maximum capacity, but I note the long-term outages at Callide C3 (466MW) and Callide C4 (420MW) and shorter-term deratings of several units, particularly at Millmerran and Tarong.
The screenshot below from ez2view shows the trended bid volumes amongst these coal units stacked by offered price, where from first glance we can see:
- Only a small fraction of volumes were offered in the higher price bands (>$10,000/Mwh) during those early evening demand peaks over the past four days.
- A small margin of remaining available generation during those periods.
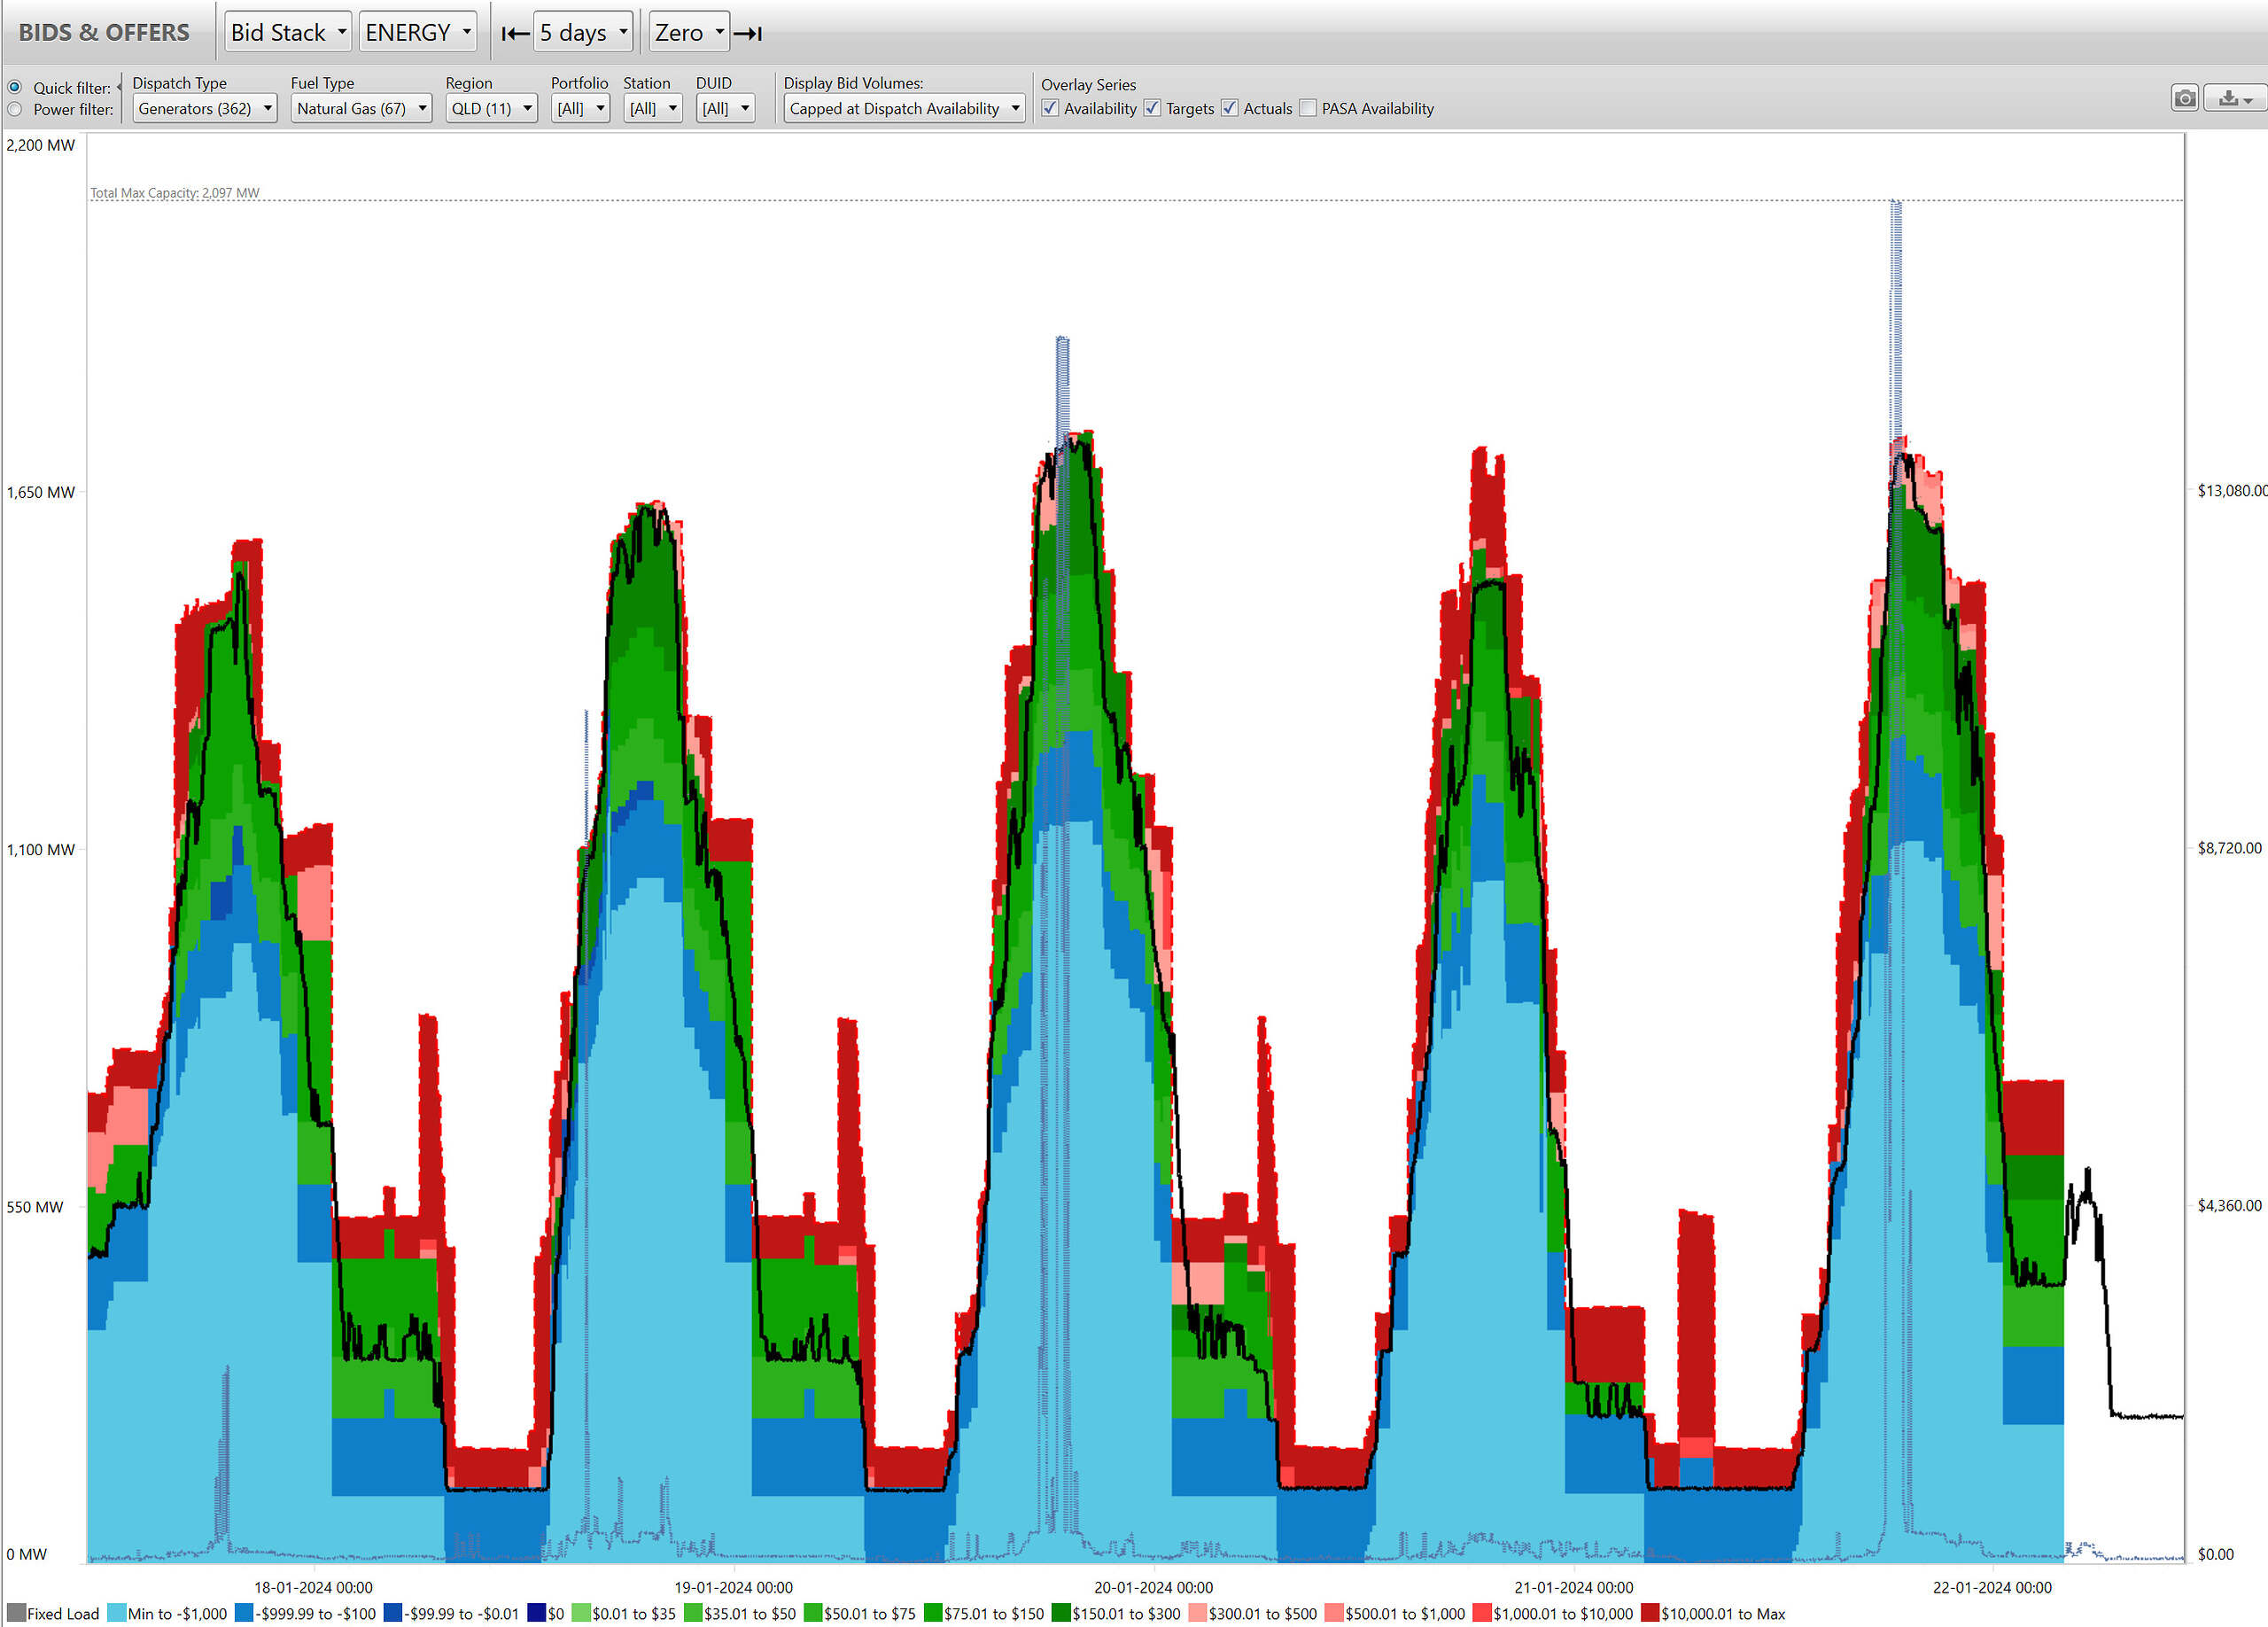
Gas
‘Gas’ has been broken up into ‘Natural Gas’ and ‘Coal Seam Methane’ here.
QLD’s 11 ‘Natural Gas’ units combine for a total of 2,097 MW of maximum capacity. With respect to the trend of bids/offers for these units, I note the following:
- From a quick look at our Generator outages widget in ez2view, I note that Yubulu2 (84MW) and CPSA (144MW) have been available significantly below maximum capacity in recent days for reasons I have not had time to investigate yet.
- Very very little available volume offered above $300 during the demand peaks on Thu 18th, Fri 19th, or Sun 21st.
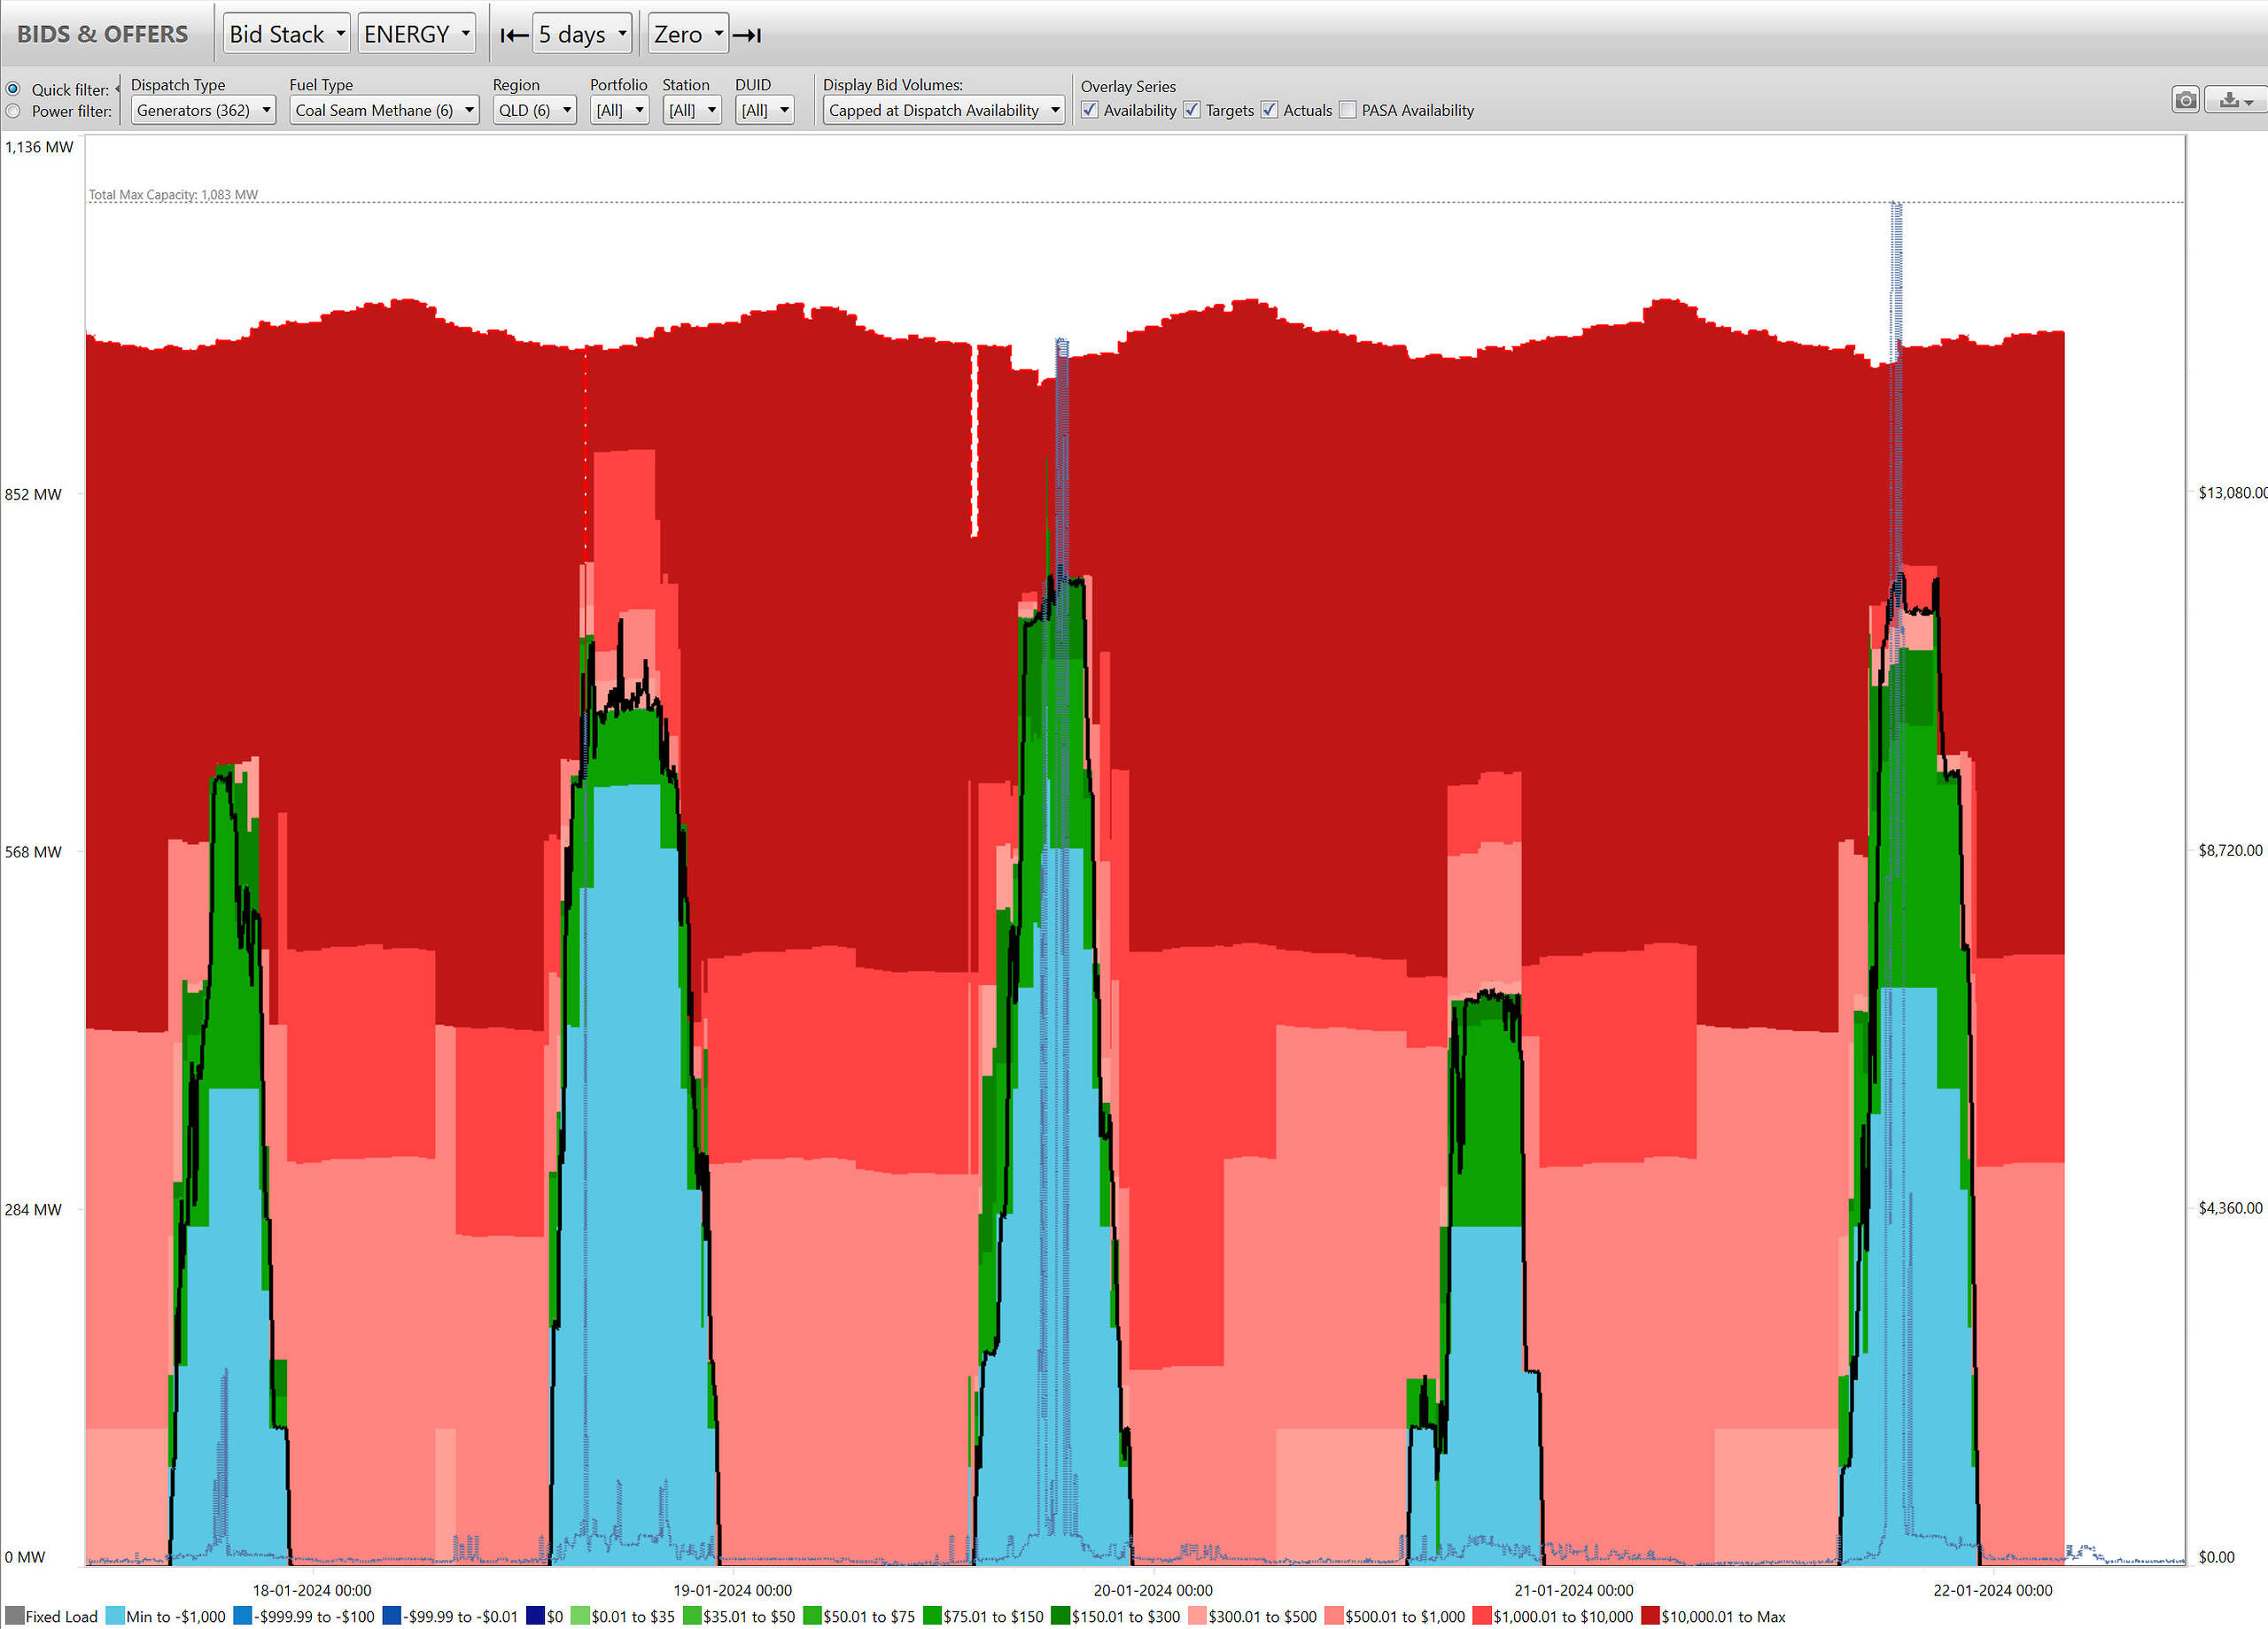
In addition to these units with the ‘Natural Gas’ fuel type, there are also the additional seven Coal Seam Methane units at Braemar with a combined maximum capacity of 1083MW. For these units, we see a larger volume of available generation undispatched in the higher price bands.
Hydro
QLD’s Hydro contingent is made up of three stations, consisting of eight scheduled units – Wivenhoe (570 MW), Kareeya (88MW), and Barron Gorge (66MW) – for a total of 724MW of maximum capacity. It is important to note that the latter is currently offline due to flooding associated with Cyclone Jasper.
From a glance at the bid stack within this fuel type, I note:
- A wide spread of offered volumes across substantially different prices.
- A very consistent 88MW (Kareeya) being offered at negative prices (and then hence being dispatched);
- Higher volumes at negative prices are being dispatched during peak times (early evening), whilst partial volumes are being dispatched near the market cap signifying that some of these volumes are near the top of the bid stack.

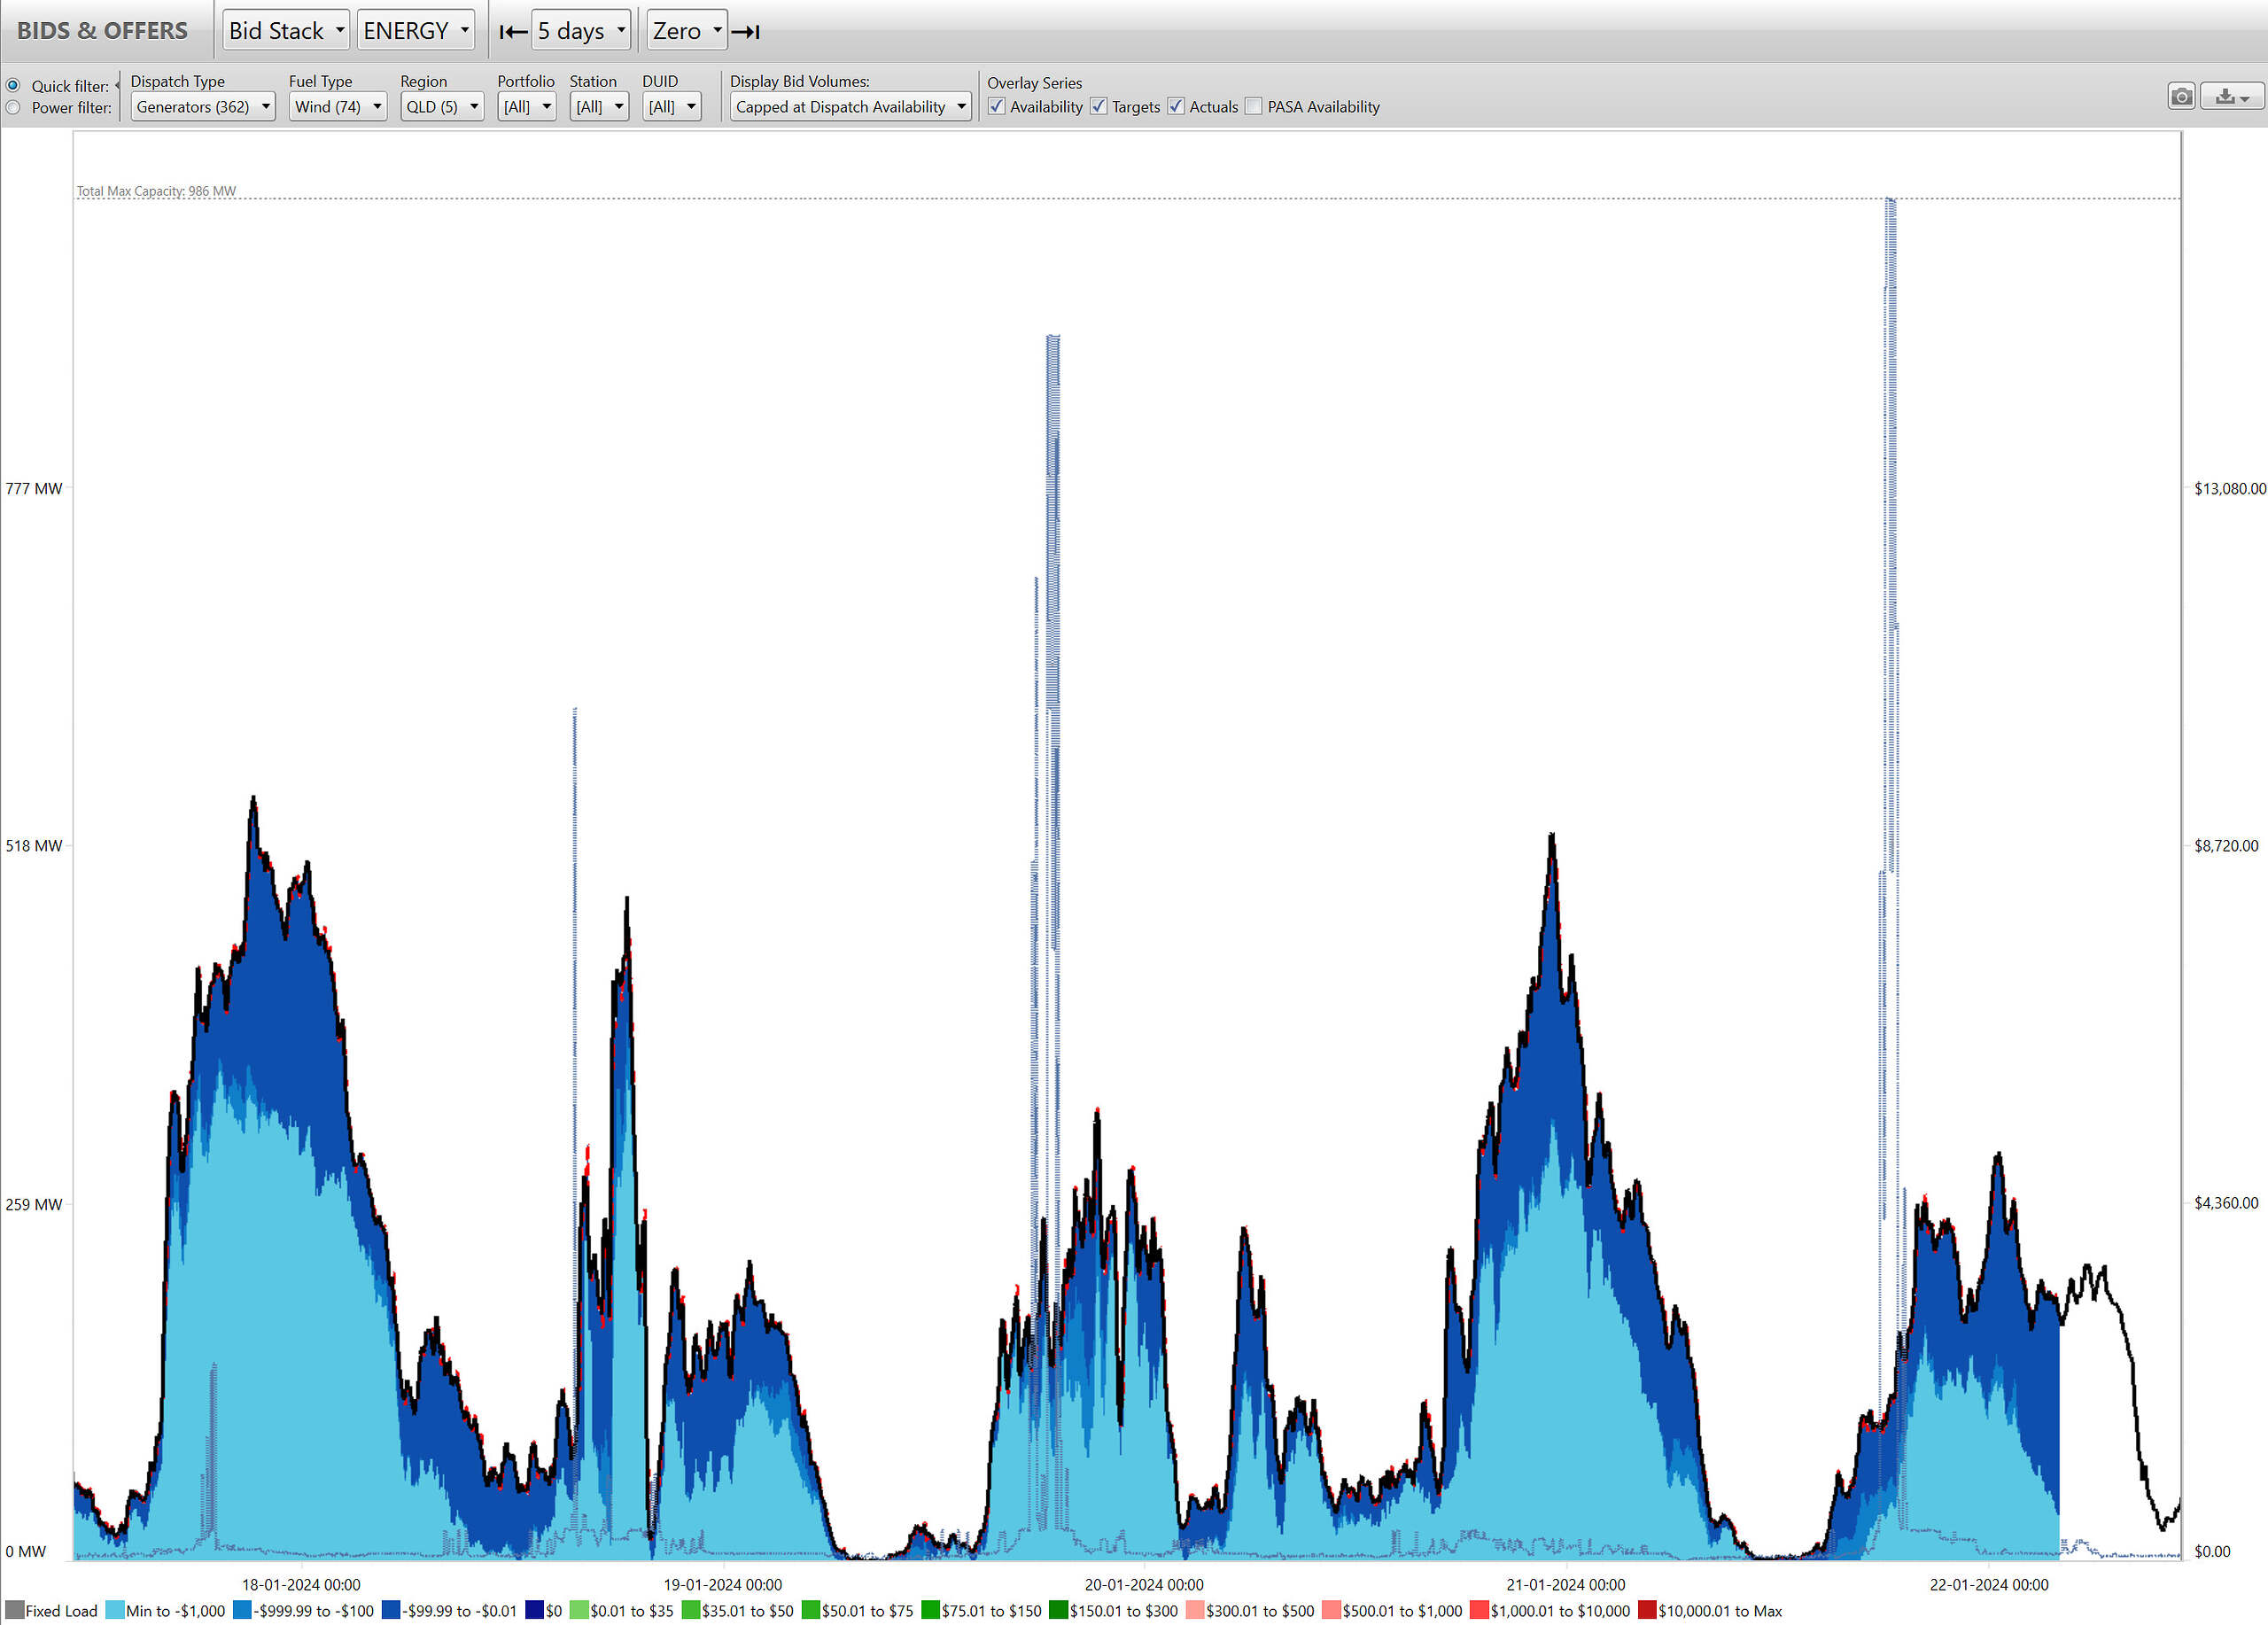
Wind
There are currently five Semi-Scheduled wind farms active in the market in Coopers Gap (440MW), Dulacca Wind Farm (173MW), Kaban Wind Farm (152MW), Kennedy Energy Park (43MW) and Mount Emerald (178MW) – which all combine for a maximum capacity of 986 MW.
From the image below I note the following:
- Virtually all of the volume from these five units has been offered between -$1,000 to $0 over the past four days; however
- Wind availability has been relatively poor, with peak generation over this period running at roughly 50% capacity factor, but particularly poor during daylight and twilight hours.
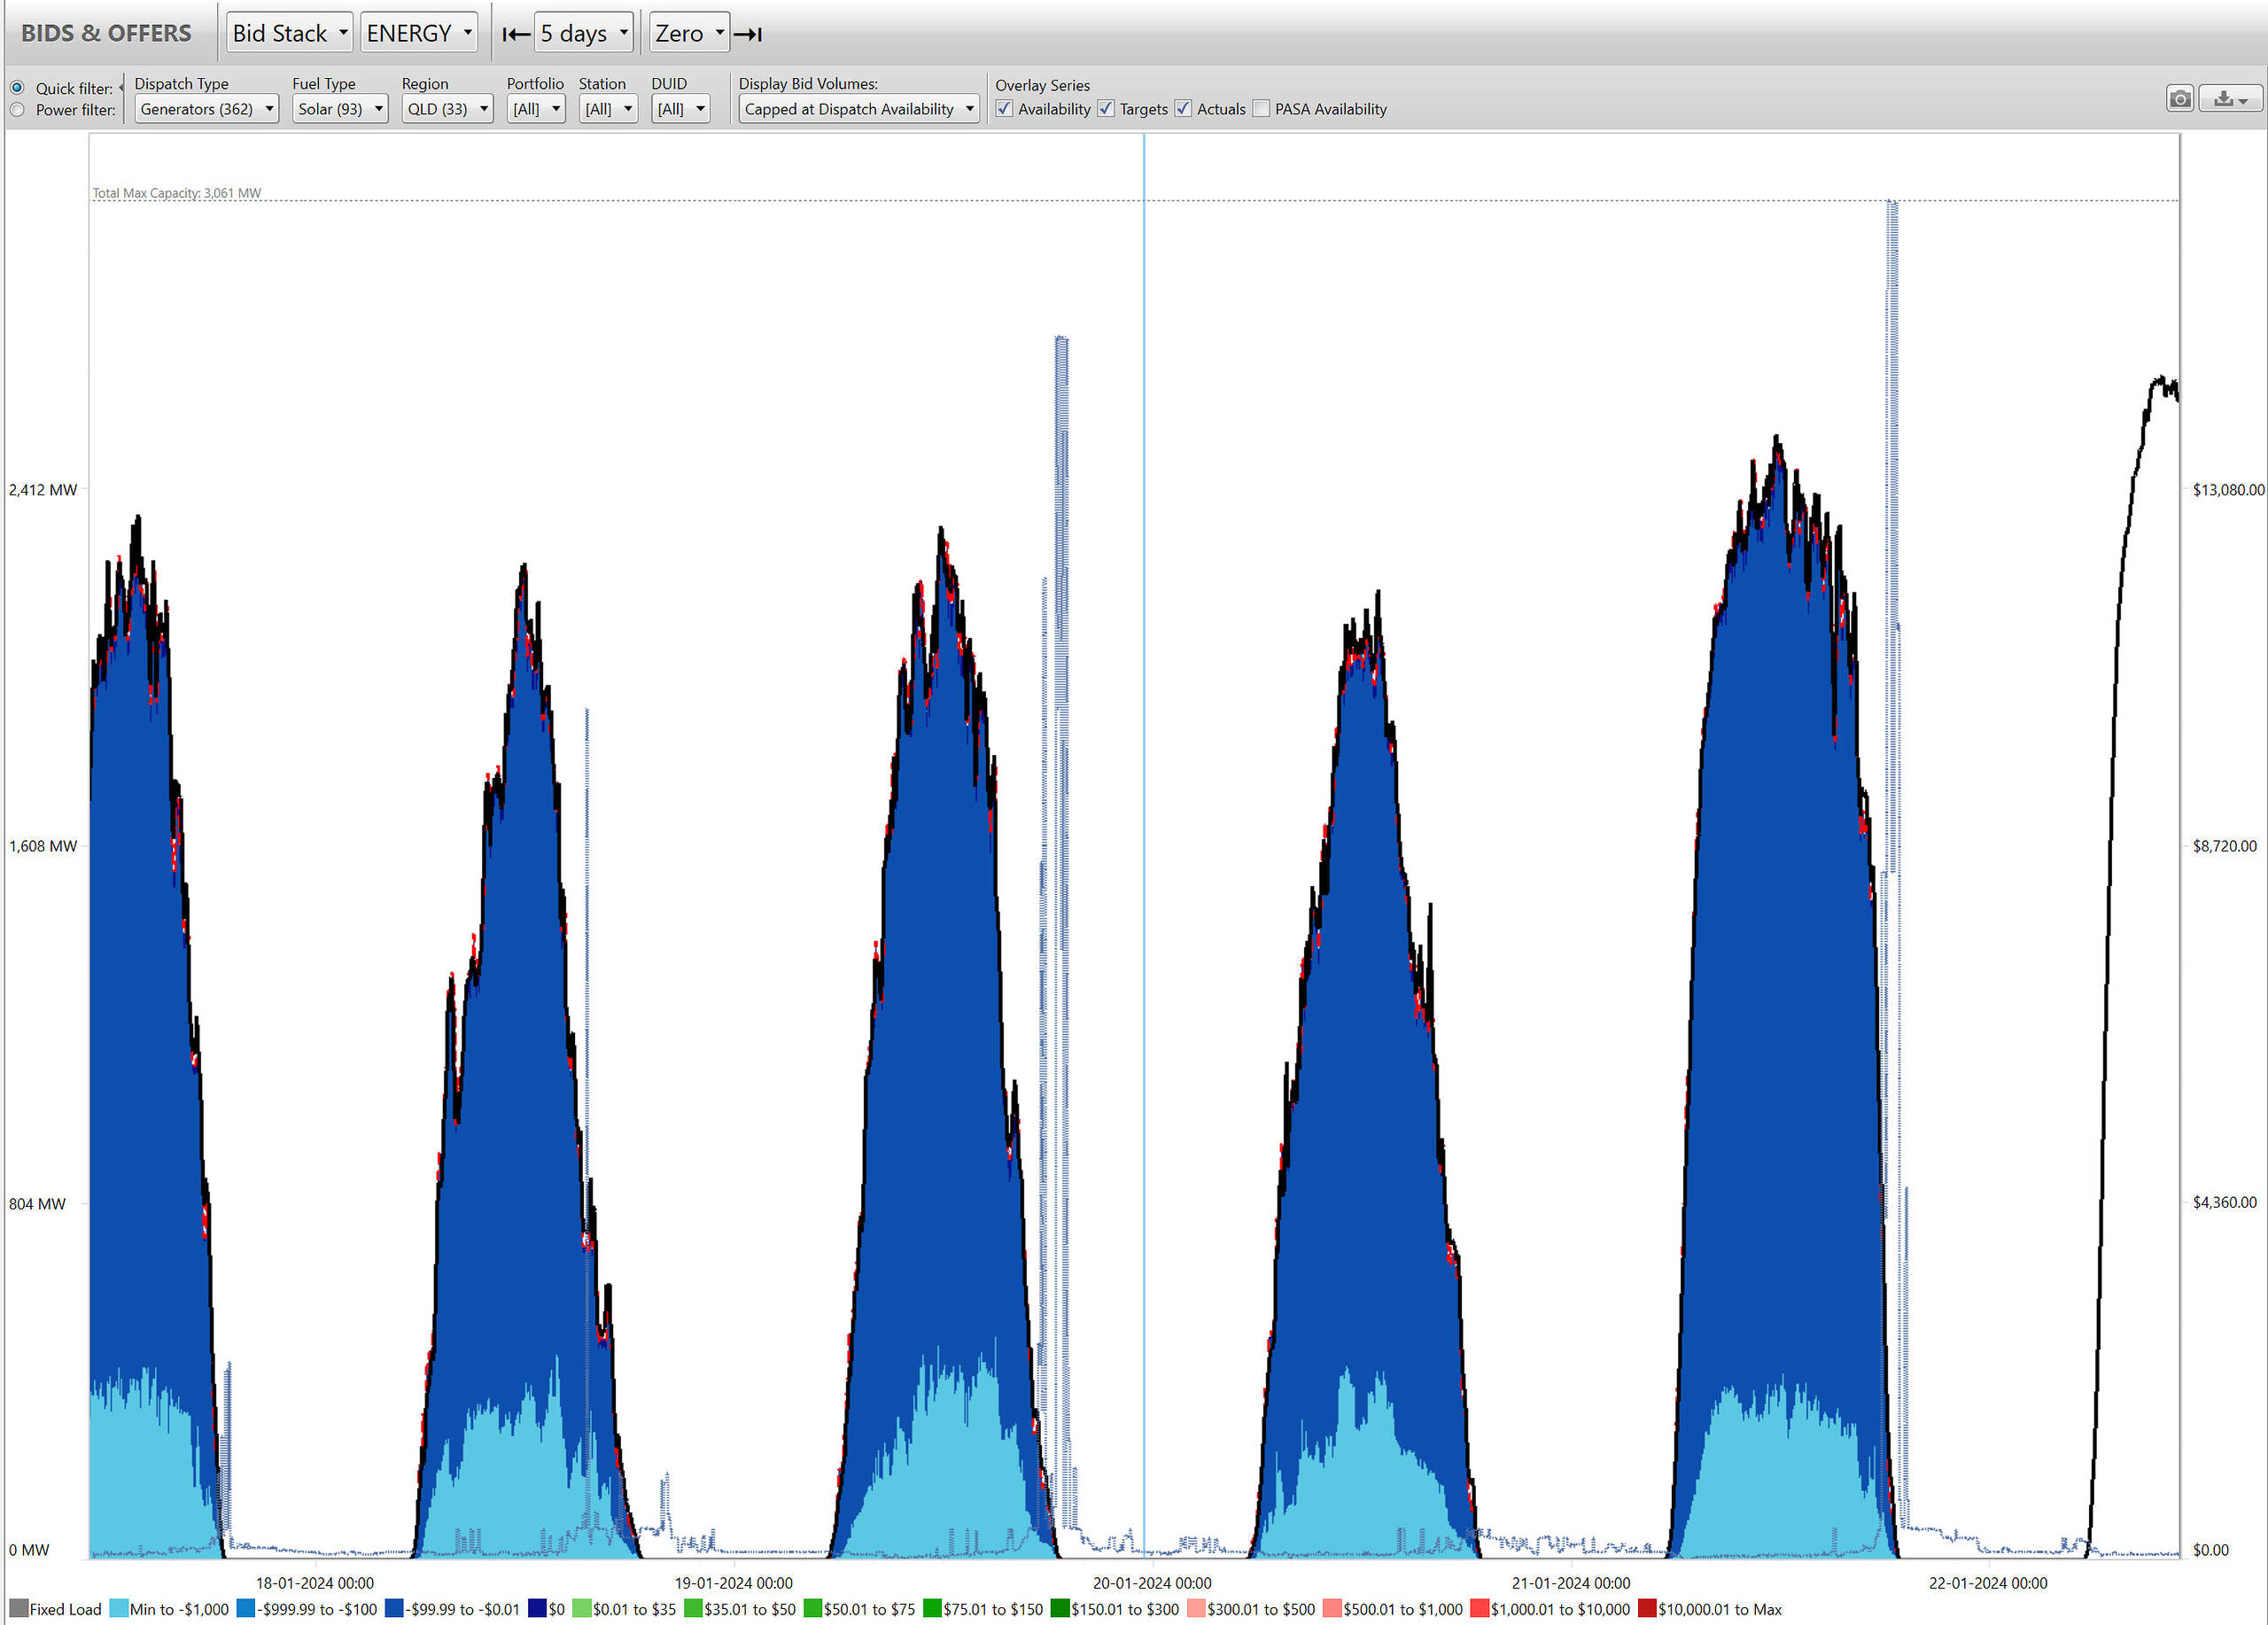
Large Solar
QLD’s Semi-Scheduled large solar fleet has a combined maximum capacity of 3,061 MW. Bid volumes here are fairly straightforward and atypical:
- These volumes almost entirely being offered at negative prices
- Typical diurnal pattern of solar availability
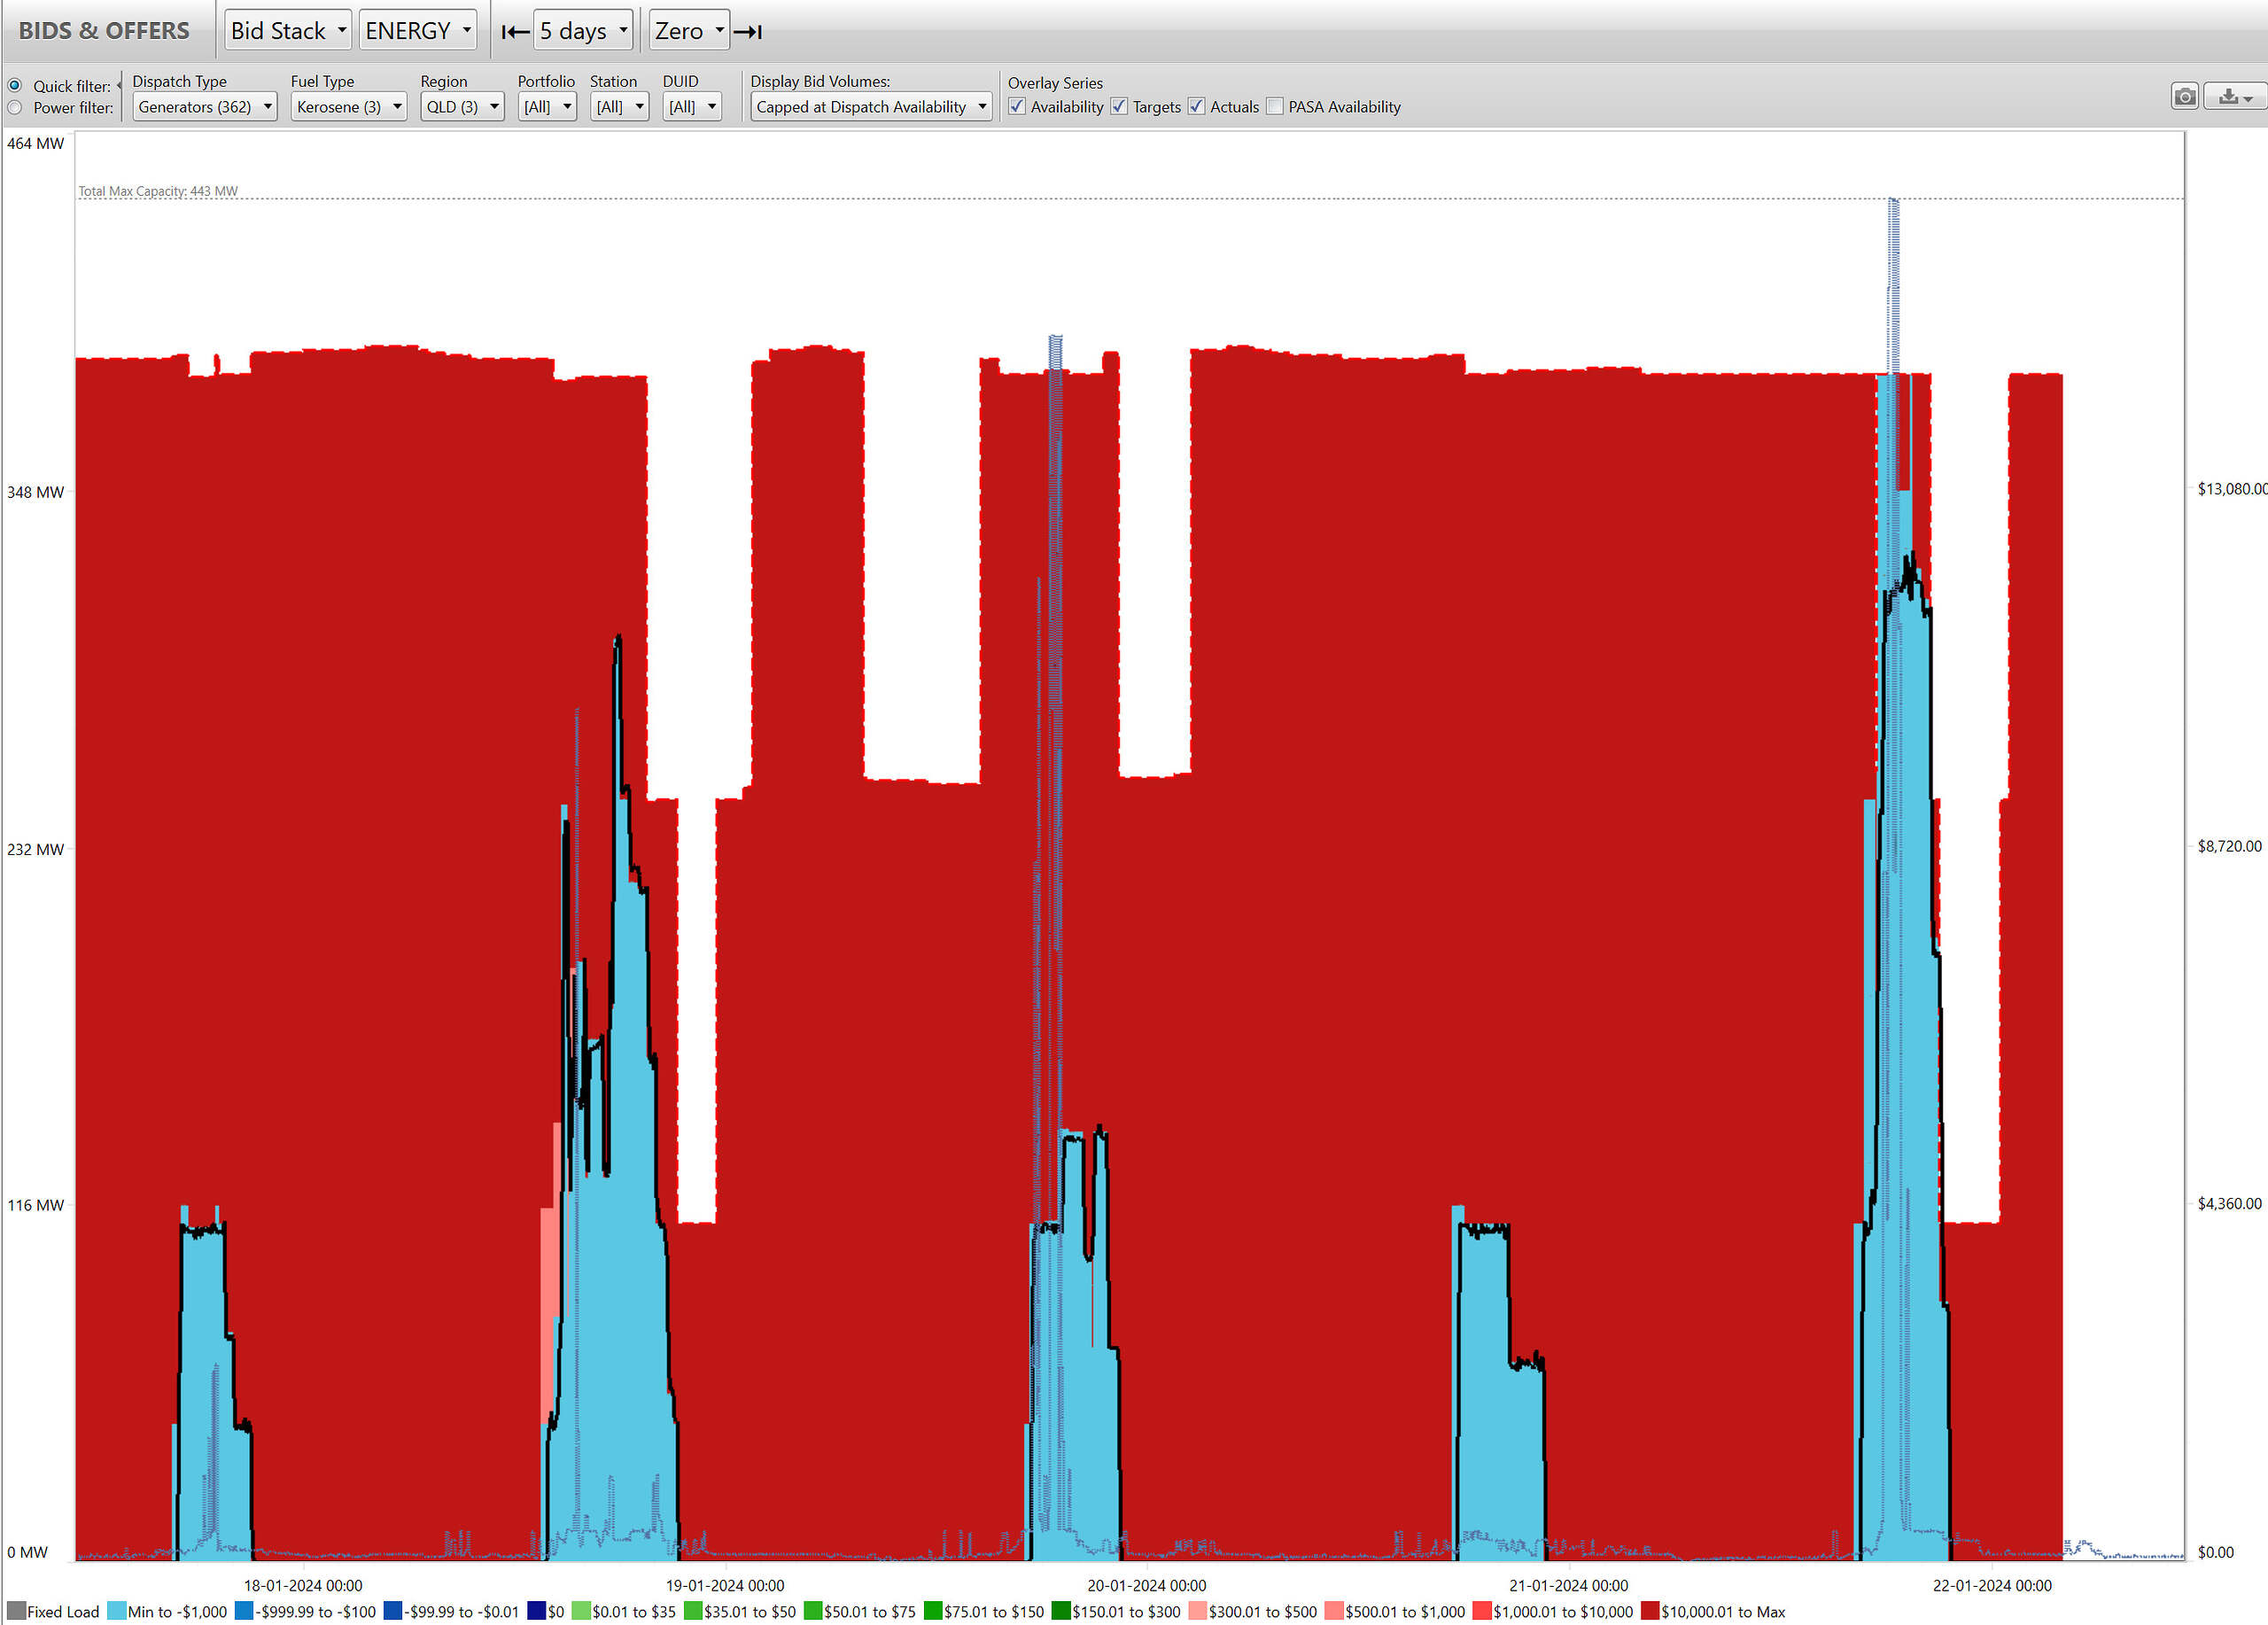
Liquid
The three kerosene units at Mount Stuart near Townsville combine for a maximum capacity of 443MW, and they have been running exclusively during early evening demand peaks.
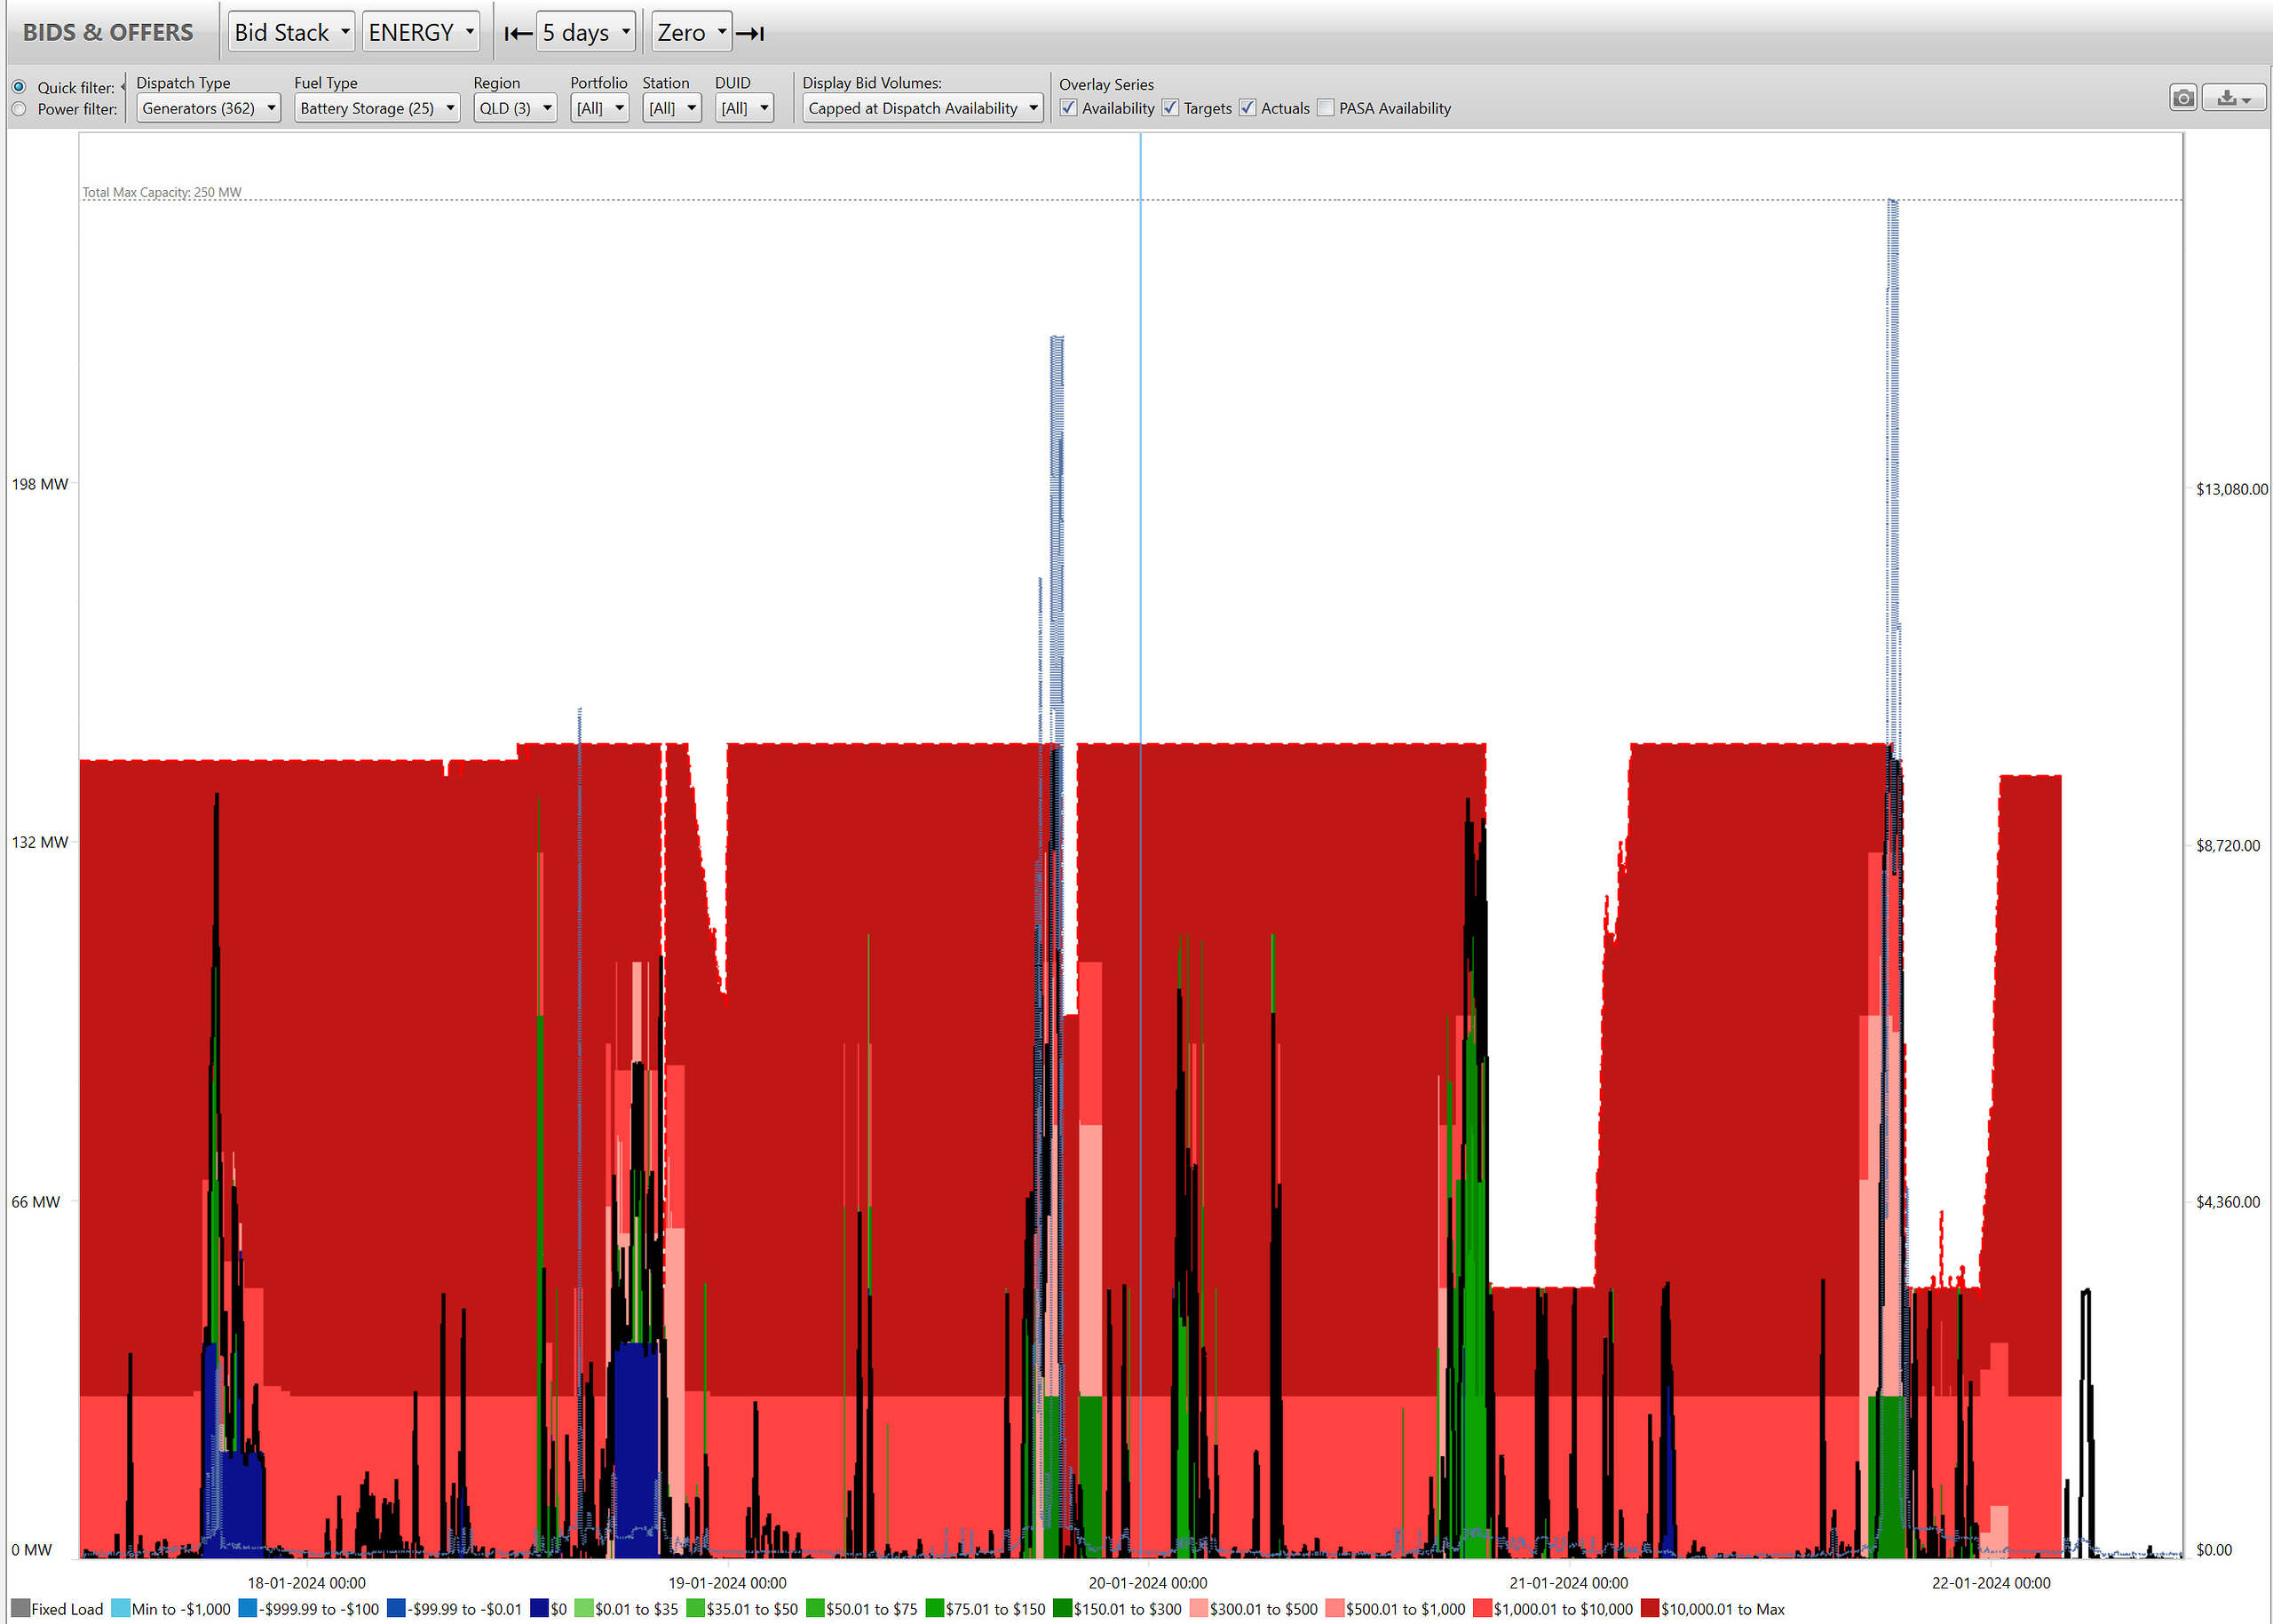
Battery (Discharge)
The Wandoan BESS (100MW), Bouldercombe BESS (50MW), with Chinchilla Battery (100MW) make up QLD’s Scheduled battery contingent – although Chinilla is yet to enter full operations.
The chart below shows the wild swings in final bid volumes that eventuated, where I note:
- Large swings in bid volumes offered (via the auto-bidders that these two units employ).
- A low state of charge (i.e. low available generation) was only seen in the early evening of Sat 20th and Sun 21st.
This analysis has been put together quickly, but hopefully, these charts provide some insight into the underlying supply-side dynamics over the past four days (and perhaps provide insight into what may eventuate this evening). Please comment below if anything appears awry, or jumps out to you.
Hi Dan, Bouldercombe is a 50MW/100MWh unit, not 150MWh.
Good spot Andrew – thanks, have corrected now.