On Thursday last week (23rd February 2023) we emailed our Annual Newsletter to our distribution list.
If you did not see this email last week, you might want to check first in your ‘Junk’ folder – but if you still can’t find it there, let us know and we’ll see if we have you in our subscription list.
In the newsletter we noted that we’d share a couple of snippets from the 198-page GenInsights Quarterly Update for Q4 2022.
This article is the first of these snippets (with a couple more planned in the coming weeks).
We’d been planning to share this earlier, but a recent AEMO announcement makes it more topical – in relation to suppression of some Semi-Scheduled participant Self-Forecasts.
(A) Some background to Semi-Scheduled and Self-Forecasts
Without trying to replicate all that’s contained in this (expanding) description of Semi-Scheduled in the WattClarity Glossary, it’s worth highlighting a couple key milestones in relation to the use of Self-Forecasts in the Semi-Scheduled category:
| Date | Milestone (re Self-Forecasting for Semi-Scheduled) |
|---|---|
|
September 2003 |
The first* wind farm (that’s visible in production data) commences operations in the NEM. * re ‘first’ we mean the first wind farm that is visible in production data (Starfish Hill Wind Farm). The earliest wind farms were (smaller and) Non-Scheduled, but others came later that were (larger and) fully Scheduled. These pre-dated the commencement of the Semi-Scheduled category (which began in 2009, as noted below). |
|
31st March 2009 |
The Semi-Scheduled category came into existence, utilising AEMO’s AWEFS forecast (which was outsourced at the time) to provide Availability forecasts for time horizons including: Time Horizon #1) In the ST PASA time horizon (out 8 days into the future); Time Horizon #2) In the P30 predispatch time horizon (out until 04:00 tomorrow or the day after); Time Horizon #3) In the P5 predispatch time horizon (out eleven dispatch intervals into the future); and Time Horizon #4) In the dispatch interval time horizon (i.e. a forecast, at the start of the dispatch interval, of what was possible for the end of the interval). A similar ASEFS system was deployed for when the first Semi-Scheduled Large Solar Farms came into existence. |
|
28th March 2018 |
Trials of Self-Forecasting were commenced with the coordination of AEMO and ARENA – with ARENA calling for expressions of interest on 28th March 2018 from various parties. That Media Release notes: ‘In partnership with the Australian Energy Market Operator (AEMO), ARENA is seeking to demonstrate wind and solar farms can provide more accurate forecasts of their output into AEMO’s central dispatch system.’ Further details, including some Knowledge Reports, are provided here on the ARENA website. In particular it’s worth highlighting ARENA’s report from January 2020 ‘Short-Term Forecasting Trial on the NEM: Progress Report (April to October 2019)’ which they said (p5/15) is … ‘to summarise insights and progress from initial reports submitted by the 11 participants of the Short-Term Forecasting (STF) trial that is taking place between March 2019 to mid 2021.’ |
|
September 2019 |
From September 2019, suitably approved Self-Forecasts were allowed to substitute* for the AEMO-developed forecasts in AWEFS and ASEFS. * It’s important for readers to note that these Self-Forecasts only provided an alternate forecast for Time Horizon #4 (i.e. within the current dispatch interval), whereas AWEFS or ASEFS continued providing inputs for the other 3 x Time Horizons. |
|
15th December 2021 |
On 15th December 2021 we released GenInsights21, which explored and discussed self-forecasting in several areas: 1) In Appendix 6 within the report, we explored in some detail; and 2) We also discussed self-forecasting (summarising from the Appendix) in Key Observation #15 (of 22) within Part 2 of the GenInsights21 report…. … we’ve subsequently chosen to publish that Key Observation in its entirety here on WattClarity. |
|
23rd Nov 2022 |
As noted in this article at the time, AEMO began to use its improved ASEFS and AWEFS forecasts.
Coincident with this: 1) the AEMO paused any new suppressions for Semi-Scheduled plant that failed the ongoing self-forecasting ongoing assessment; and 2) notice was given that this ‘Grace Period*’ would end on Tuesday 28th February 2023: (a) ~3 months after the upgrade. (b) which has almost completely elapsed now. * note that the term ‘Grace Period’ is my term, not the AEMO’s. |
|
Tue 16th Feb 2023 |
We released GenInsights Quarterly Update for Q4 2022, which looks specifically at the period covering 1st October 2022 to 31st December 2022 (so including the period since 23rd November 2022). |
|
Monday 27th Feb 2023 (today) |
In addition to publishing Key Observation #15 here, we also publish this article today. |
|
Tuesday 28th February 2023 (tomorrow) |
Tomorrow, the AEMO recommences suspension by the application of this method: |
|
~late April 2023 (envisaged) |
We envisage we will be releasing GenInsights Quarterly Update for Q1 2023, which will analyse the Q1 period (spanning ‘before’ and ‘after’ whatever changes occur tomorrow (on Tuesday 28th February 2023). We envisage that this update will explore these changes (whatever they are) in some detail. |
(B) What’s the data show, for Q4 2022?
The focus of GenInsights Quarterly Update for Q4 2022 was, as the title suggests, the period of Q4 2022. Appendix 3 provided 64 pages of focused analysis on Large Solar and Wind (registered VRE).
For the variety of metrics presented in the report, the context of the most recent quarter was presented via:
1) Stats within the quarter (often on a daily basis);
2) But also comparing this quarter with the broader pattern (often on a monthly basis).
In this article we’ll share some of the insights published in the Q4 Update – with a specific focus in this article on Large Solar (though similar analysis is also presented for Wind in the report).
(B1) Longer term trend (Large Solar)
Let’s start with a longer-term trend of a measure that’s like ‘monthly market share’.
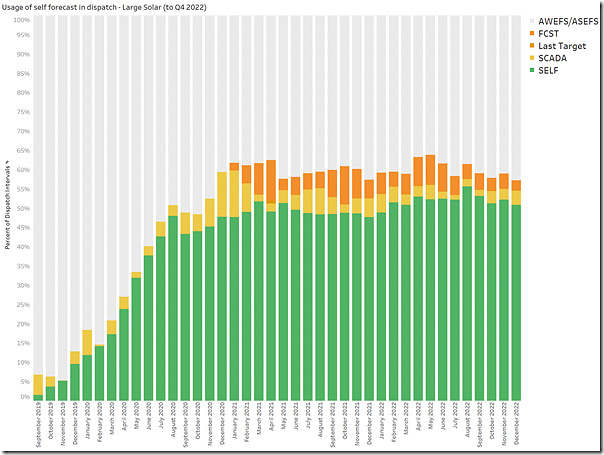
The following chart was provided in in the Q4 Update. It trends (for each month from September 2019 to December 2022) the relative proportion of dispatch interval in each month of which Large Solar Availability forecasts are supplied from 4 different sources – with the two major supplies being the Self-Forecast (from the generator) and ASEFS (from AEMO):
In this article we’ll compare-and-contrast the big two (the self-forecast in green, and ASEFS in grey):
1) Since the advent of self-forecasting in the second half of 2019, the ‘share of market’ supplied by self forecasting:
(a) grew to around ~50% within ~11 months;
(b) but has been relatively steady since this time.
2) With respect to the above:
(a) keep in mind that this looks at the source of the Availability:
i. for the present dispatch interval individually for all 110,000 dispatch intervals in a year, broken down by month (we’ll see more below how its possible for an individual solar farm to alternate between various sources).
ii. for each individual Large Solar DUID that’s Semi-Scheduled.
(b) keep in mind that this is a relative share,
(c) hence ‘under the covers’ there’s also the growth in the number of Large Solar units that have been operational since the middle of 2020 (i.e. when we first reached ~50%);
(d) but the headline really is that the aggregate supply from the various self-forecast suppliers has just kept pace with growth in capacity (in relative terms), which some might view as ‘running to stand still’.
(B2) Within Q4 2022
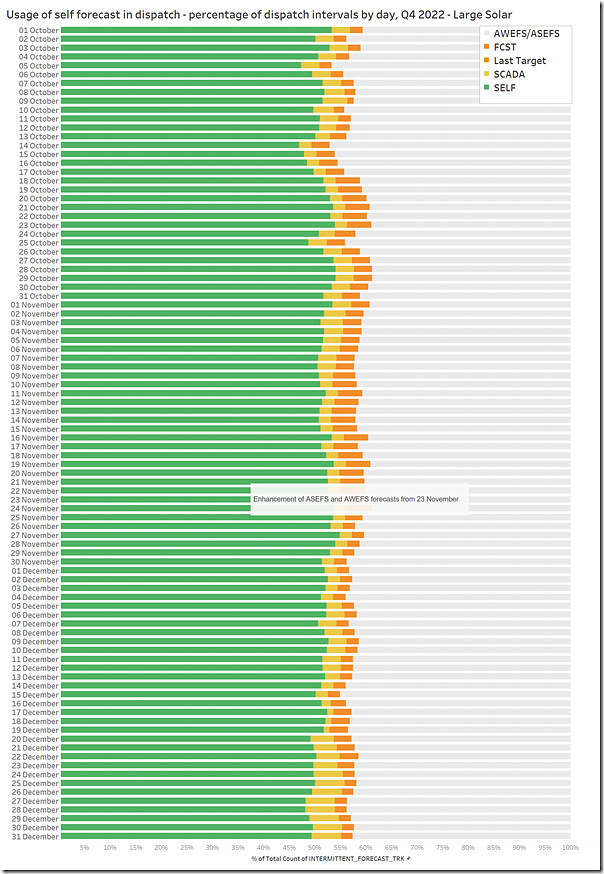
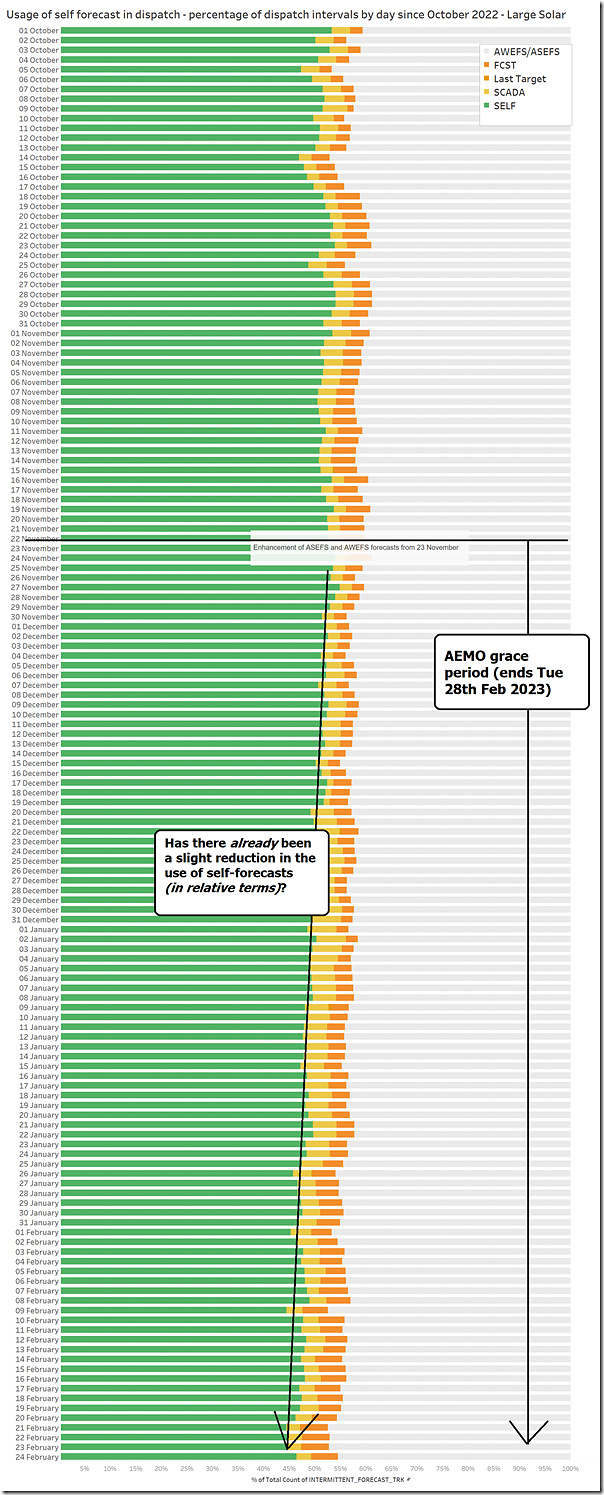
We use the same method in Appendix 3 to present daily statistics for the percentage of DI-DUID availability measures supplied from each source, with self-forecast (green) and ASEFS (grey) being the two dominant ones:
The date the AEMO released its improved ASEFS forecasts (23rd November) is shown on the chart – but it’s important to understand that there’s no significant change seen after this time (at least to date) because the AEMO chose to implement a ‘grace period’ before suspending non-performing self-forecasts.
This grace period ends tomorrow, Tuesday 28th February 2023 … so we would expect to see some change in the chart evident on this date in Appendix 3 for GenInsights Quarterly Update for Q1 2023. More on this below.
(B3) Viewed time sequentially through Q4
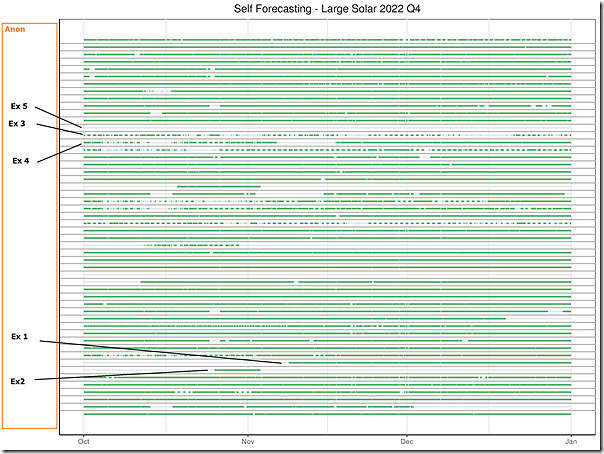
Within the Q4 Update we also present via Gantt Chart for the quarter by dispatch interval, where (in green) we highlight the points in times where each Solar Farm used its self-forecast:
Note that:
1) The particular solar farms shown are anonymised, because the point of this article is not to ‘name and shame’ but rather:
(a) to highlight the broader picture…
(b) and to pose some questions.
2) The list is not all solar farms:
(a) We’re only looking at Solar Farms that have been accepted by AEMO to supply self-forecasts in the first place (which, as indicated above, is a significant but not comprehensive list of all the solar farms in the NEM)
(b) Note that being accepted to supply a self-forecast is not the end of the process, as Solar Farms self-forecasts might be ‘suppressed’ as discussed by AEMO here. It might have been that there are solar farms accepted for use of self-forecast that (for whatever reason) were unable to use self-forecasts in Q4 2022.
3) In the chart above I’ve specifically highlighted a couple different patterns of operation:
Example SF1 = appears to be one accepted for use in the early part of Q4 and then using self-forecasts fairly consistently since that time.
Example SF2 = appears to be one accepted later in October who used self-forecast consistently for a week or so before ceasing use for some reason
Example SF3 = appears to be one accepted prior to Q4 but only using self-forecasts sporadically through the quarter (i.e. on a fair number of days self forecasts are used, but not for whole days).
Example SF4 = appears to begin with a pattern like SF3 but then becomes much more consistent in its use from mid-November onwards.
Example SF5 = appears to be a unit accepted by AEMO to supply self-forecasts, but which does not use them at all (or at least does not have them accepted) during Q4. There are several reasons that we’re aware of (and perhaps others we are not aware of) why this might have happened, but that’s irrelevant for this article.
(B4) What’s the purpose of the self-forecasting regime?
In the broader Australian society at present there’s a growing debate about the purpose of superannuation. If we can establish a clear answer to that, so the theory goes, determining some implementation policies should be a whole lot easier.
—
In the energy sector there are a number of similarly styled debates (albeit about much more nerdy and arcane topics).
One question that perhaps should be attracting more attention is the question ‘what’s the purpose of the self-forecasting regime?’… though perhaps it’s not attracting as much attention as it should, given how critical wind and solar will be on this ongoing energy transition:
1) The authors thought that this was case when compiling GenInsights21 in making that question the focus of Observation #15/22 within Part 2 of that widely read report:
… in the interests in promoting that conversation, we’ve shared the full text of that Key Observation here in this article on WattClarity today.
2) Given that there’s likely to be some extent of suppression of self-forecasts beginning tomorrow (we expect there will be some, but don’t have a sense of the scale of the change), it might be that this spurs along that much needed conversation?
(B5) Self-forecasts not being used under Semi-Dispatch Cap?
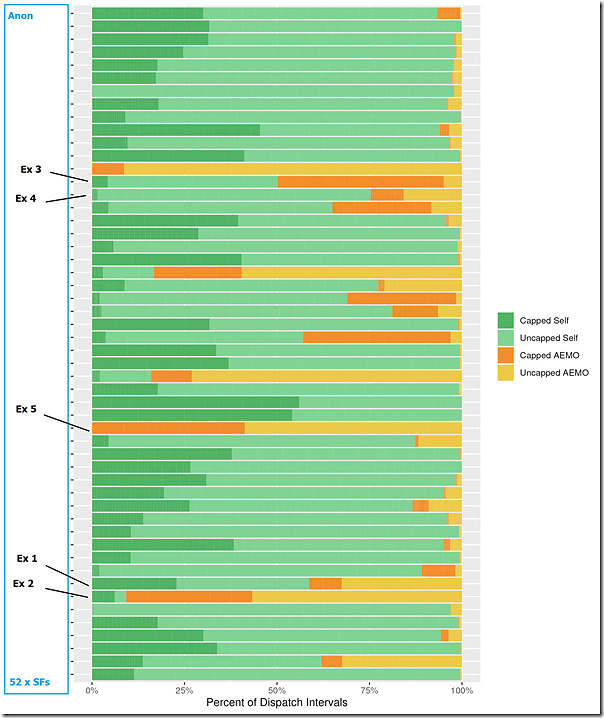
To feed into that conversation, here’s another chart from the Q4 Update that shows the same list of solar farms, also anonymised with 5 solar farms (mostly the same) highlighted as examples:
In this case we’ve aggregated every dispatch interval through Q4 2022 for each of the 52 x Solar Farms in the list with each of the four buckets below:
| State of Semi-Dispatch Cap (SDC) |
Using Self-Forecast | Not using Self-Forecast and Reverting to ASEFS |
|---|---|---|
|
Not under SDC |
Readers should keep in mind that these are (to some extent) the ‘easy’ dispatch intervals in which to provide a forecast for a solar farm, as we could just assume it was similar to 5 minutes ago:
1) plus a bit during the morning, with the sun rising; 2) minus a bit during the afternoon, with the sun setting. … in other words, a slight variation on persistence. In our view, it was not these dispatch intervals AEMO had in mind when embarking down the path of the initial ARENA-facilitated trials that led to the commencement of application of self-forecasts in the dispatch process. |
|
|
Whilst under SDC |
Operating under Semi-Dispatch Cap (SDC) is a much more complex problem given that the unit is being artificially limited due to any of a number of reasons, but primarily either:
1) Network congestion (i.e. constraints); or 2) Economic curtailment (i.e. low prices). In this case, we can’t use persistence to estimate what might be possible (with no constraints or higher prices) and so it is these intervals that would benefit from any improvements in self-forecasting methodology developed by the generator in conjunction with a technology provider. Unfortunately it appears that (in some cases above) this is when self-forecasts are being switched off and the generator defaults back to ASEFS. |
|
To some people (including me) the whole point of having a self-forecasting regime is to provide the ability for the operators of the individual solar farm to submit their own self-forecast* during these ‘difficult’ times, given that it should be able to be more accurate than what the AEMO is able to do.
* to ensure any reader is not aware, the self-forecast is of an (unconstrained) ‘availability forecast’ of what the plant would have been capable of producing in the absence of the SDC-flagged obligation to reduce output to some Target point below that level.
After all:
1) The operator should know more about their plant than the AEMO;
2) The operator has a financial incentive* to ensure that their availability is the maximum theoretically capable, given the condition of their plant and the solar (or wind) resource at that location.
* such that:
(a) their output is maximised in subsequent dispatch intervals, when the SDC is lifted, and
(b) so that its (constrained) Target is as high as possible even under SDC.
But it appears that there may be other motivations at work that are working in conflict with what I’d think the purpose of self-forecasting is.
—
Let’s look particularly at the examples highlighted above:
Example 1) was the case where self-forecasts appear to be used consistently from early in Q4 after they had initially been accepted by AEMO…
… we see above that these self-forecasts have been used during many SDC events, which (we would think) is aligned with the fundamental purpose of self-forecasts. Appears to be a good result!
Example 2) was the case where self-forecasts were used for a period and then stopped…
… we see above that these there are a number of times when ASEFS was used during SDC periods, but this is understandable if the self-forecast is consistently off.
Example 3) was the case that appears to be consistent stop-start-stop-start cycling use self-forecast through the quarter…
… we see above that this DUID appears to have primarily used ASEFS (not the self-forecast) during SDC periods. To me this does not seem aligned with what I see as the primary purpose of self-forecasting.
Example 4) was the case that appears to be stop-start-stop-start cycling use of self-forecast up until mid November, but more consistent thereafter…
… given the distinct change in pattern half-way through the quarter it’s not clear what might be discerned in the bar chart above. Remembering my own caveat that it’s impossible to know motive, we might speculate that:
(a) Perhaps there have not been so many SDC events in the second half of the quarter (this is something factual that we could check, but have not had time to do so)? OR
(b) Perhaps the change in behaviour was prompted by the AEMO’s upgrade of ASEFS mid Q4, and the notice (issued at the time) of what would happen come 28th February 2023?
Example 5) was a different solar farm that did not use self-forecasts through the quarter (there are two cases of this in the 52 units listed)…
… in which case it’s natural that any dispatch intervals encountering SDC would (also) be dealt with via ASEFS forecasts.
As readers can see, there’s quite a degree of variation between the different approaches Solar Farms appear to adopt in relation to the use of their self-forecasts.
(B5) A different motivation?
It seems quite likely (as it’s even been heavily referenced in marketing material) that some others see a different purpose for self-forecasting :
1) Specifically, there are those who seem to have come to see the purpose of self-forecasting as a means to minimise Causer Pays liability for Regulation FCAS;
2) Even if this means that the forecasts supplied are not on all occasions ‘the most accurate’ forecasts that they might be able to objectively provide.
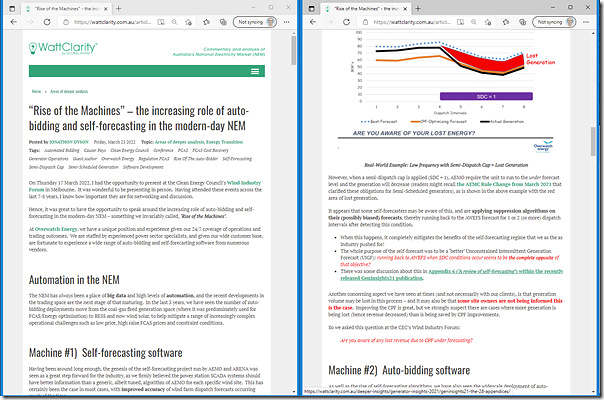
This possible motivation was flagged in the WattClarity article ‘The Rise of the Machines’ on 25th March 2022 by guest author on WattClarity (and collaborative author in GenInsights), Jonathon Dyson.
It may be that some of the results presented in the Q4 Update (with excerpts shown above) can be understood in this light.
(C) What will happen tomorrow?
We don’t know what will happen tomorrow … but we’ll be watching with keen interest!
For the GenInsights Quarterly Update for Q1 2023 we’ll be updating this chart, which only extends at this point to Friday 24th February 2023:
It’s a long chart, but (like we try to do with all images here) click on the image and it will open in a new window at larger resolution.
To me it appears that there already has been a trend towards reduction in the use of self forecasts (in relative terms, remembering again that the number of units is increasing). There will be a number of people (including us) watch what happens tomorrow, with respect to the potential for a step change reduction.


Leave a comment