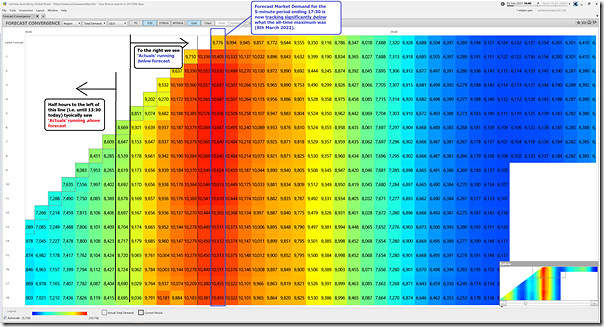
The clouds and rain that are causing the unforecast drop in aggregate solar capability at Large Solar farms across QLD, and presumably with rooftop PV as well (though I have not checked), appear to be having a beneficial effect as well on the supply-demand balance.
Here’s another snapshot from the ‘Forecast Convergence’ widget – but this time:
1) Tabular, not Chart form
2) Looking at Market Demand (not Solar UIGF); and
3) Looking out over a longer time range (i.e. P30 being half-hourly, whereas the solar chart was just P5 being the next 55 minutes)
Here it is (remember to click on image to open larger view):
Per the annotations (and remembering to of ‘looking up a vertical’ to review that other dimension of time) we see:
1) Up until 13:30 today we see the actual Market Demand outcomes were typically ahead of (i.e. above) escalating forecasts;
2) But that flipped from 14:30, perhaps due to storm development, and we see that actual levels of Market Demand came in lower than forecast.
3) For the single half hour period (i.e. the 5 minutes ending 14:00) the AEMO’s immediately preceding forecasts were on the money.
Illustrates the challenges of being in the AEMO Operations Room, and particularly the short-term forecasters!
—
As a result of which, the forecast new ‘all time maximum’ (which would beat the prior record up at 10,119MW back on 8th March 2022) appears to have evaporated…


Leave a comment