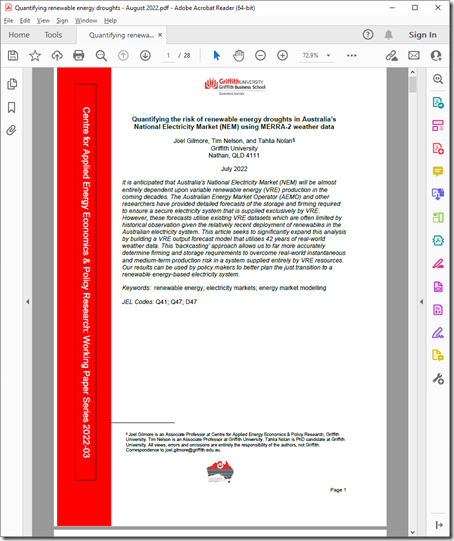
Those clients of ours who purchased GenInsights21 when it was released (about 11 months ago now) will recall that, in Appendix 27 we included a study of Wind Diversity (and the phenomenon known as ‘dunkelflaute’), given that it is such an important determinant of the costs and challenges of the energy transition.
This was one of the components we spoke about in this (recorded) briefing for the Smart Energy Council audience on 5th April 2022.
So readers here will understand our interest in the article from Giles Parkinson on RenewEconomy earlier this week titled ‘A 42-year study shows wind and solar droughts in 100% renewable grid not as bad as thought’.
Leaving aside the first question that popped into my head (being ‘as bad as who thought?’) in clicking through on the article, I was very interested to learn more of the details – so asked the authors if I could have a read of the paper, and they sent it to me.
But now the report is generally available on the Griffith University website here, I thought it might be of value to publicise this to our WattClarity readers:
We’ll be reviewing with interest and might (time permitting, etc) post a follow-on article with thoughts…


Interesting work… we have also published work on this that might be of interest.
Boston, A., & Bongers, G. (2021). MEGS: Modelling Energy and Grid Services to Explore Decarbonisation of Power Systems at Lowest Total System Cost. Energy Strategy Reviews, 38. https://doi.org/10.1016/j.esr.2021.100709
A pity the Griffith report talks about “average”, electricity is all about the instantaneous. Average wind and solar will not give a stable electricity grid.
It is interesting comparing the 2 papers: Boston & Bongers 2022 and Gilmore 2022.
I have used both MERRA and NCEP RR2 in hindcast studies. Recently I tend to use the ERA5 data, it is finer resolution and contains a 100m wind for wind studies, a height more consistent with modern turbines.
There are a few comparisons papers of MERRA, RR2 and ERA5: https://asr.copernicus.org/articles/17/63/2020/
However both these papers seem to produce reasonable calibrations against recent measurements.
For storage, I prefer the Bucket Model approach taken by Boston.
This clearly show the curtailment issue in Spring/Early Summer and blackouts in Winter with their scenario of using 10 x Snowy 2.0 schemes storage.
Boston do not address Ramping which may be a problem with to many 2GW/350GWh Snowy2’s.
The shorter period of modelling by Boston may not be representative. The 42 years of Gilmore is much preferred.
The 15-year used by Boston doesn’t show if how unusual Winter 2010 Dunkelflaute was.
Interesting both papers note that 17 May 2010 was a bad day. Boston shows this continued for the whole winter and the storage never recovered.
Boston model assumes perfect transmission. Tasmania was not included in Gilmore’s work, it’s pumped hydro will be critical storage.
Boston discussion for the use of offshore wind farms with their time-shift of wind generation and increase CF was very useful.
We need more of these long term studies done to ensure the reliability of the NEM.
Looking at the curtailment are we reaching peak Solar?? I think storage has become the main issue.
I am certain clever people in AEMO are looking at all these issues.
Dave Duncalf