Earlier today Daniel Lee noted how prices were elevated through the morning in the QLD region.
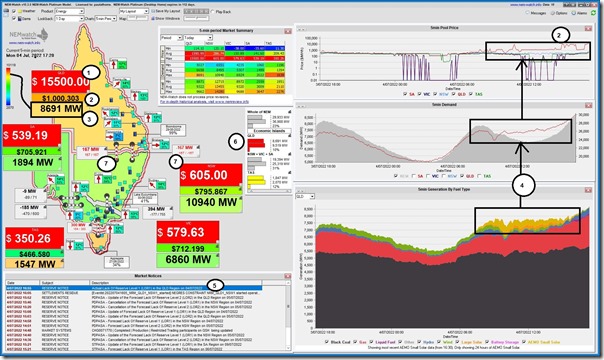
That pattern continued through the afternoon and now into the evening, with this NEMwatch snapshot at 17:20 highlighting a number of things as noted:
With reference to the numbering.
1) The spot price is up at the Market Price Cap … which was raised to $15,500/MWh from 1st July … only a couple days ago;
2) The volatility through the day has driven the Cumulative Price up above $1,000,000
(a) so well on the way to the Cumulative Price Threshold (CPT) … which has also increased from 1st July 2022.
(b) keep in mind this helpful Dashboard you can use to keep an eye on this.
3) The QLD ‘Market Demand’ is well out of the ‘green zone’ on a historical range.
4) There was not much solar production at any time through the day:
(a) As Dan noted earlier;
(b) … meaning definitely not much of a ‘duck’s back’ in the trend of ‘Market Demand’ apart from a dip prior to 10:00
(c) this coincided with a peak in aggregate solar production (from rooftop PV and Large Scale) across QLD just above 800MW what lasted for 30 minutes … very low, compared with a much larger solar capacity in QLD…
(i) Aggregate Maximum Capacity of Large Solar at 2,789MW compared with peak output today of 261MW … i.e. a peak instantaneous capacity factor of a measly 9.3%
(ii) The APVI (under ‘Postcode’) seems to suggest 7,842MW of aggregate installed capacity rooftop PV (to 1st April 2022) right across QLD, so comparing against AEMO estimated* peak output today of 744MW (in the half-hour to 10AM) so equating to a peak instantaneous capacity factor of under 9% across the QLD Region…
… appreciating that many more MW will have been installed in April, May and June 2022; but
… some of this total will be outside of the QLD region (e.g. Mt Isa) and also some of the older systems probably are no longer working.
… and (*) keeping in mind earlier comments about the opacity of rooftop PV.
(d) apart from that 30-minute burst, the ‘next highest’ was even lower … below 700MW and quite choppy.
5) AEMO’s published Market Notice 99908 noting an ‘Actual LOR1’ for this evening
6) Which translates into an IRPM for the QLD-only ‘Economic Island’ of only 9.53% at that time.
7) This tightness is partly attributable to the constrained flows:
(a) constrained imports (from NSW) over QNI:
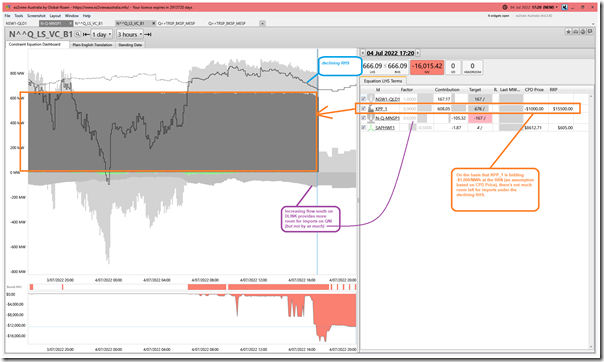
(i) in large part because of the ‘N^^Q_LS_VC_B1’ constraint equation which we’ve seen before
… here’s some earlier tagged articles,
… and here’s a snapshot from the ‘Constraint Dashboard’ widget in ez2view v9.4.2.62 that shows how imports are squeezed between heavy output from Kogan Creek and a declining RHS:
(ii) but note that the ‘Q>>TRSP_BKSP_MESP’ constraint equation that is also affecting QNI that’s part of the ‘Q-TRSP_832’ constraint set:
… related to outage on the 832 H18 Tarong to H2 South Pine 275 kV feeder; and
… that’s scheduled to run through until 25th August 2022.
(iii) AEMO data nominates this other constraint (i.e. the new one) as the one that’s setting the Export Limit (i.e. flow north) but I wonder if that’s actually the case … as Marcelle noted before, there are some traps that we’ve come across in some of this constraint data.
(b) constraints making Directlink flow south.
We’re out of Q2 but the challenges remain… (though at least in QLD we’re not flooding for the 4th time in recent history, unlike some in NSW!)


Leave a comment