A little earlier today I tabulated these 7 instances where either (or both) happened:
1) Where AEMO declared an ‘Actual LOR2’ … which in many cases seemed to be related to…
2) A yo-yo in Available Generation for the QLD region.
Leaving aside Instance #1 for now, because it happened prior to Administered Pricing, I’ll start by looking at Instance 2 to see if I can find some of the factors in this yo-yo
(A) Overview of the yo-yo (Instance #2)
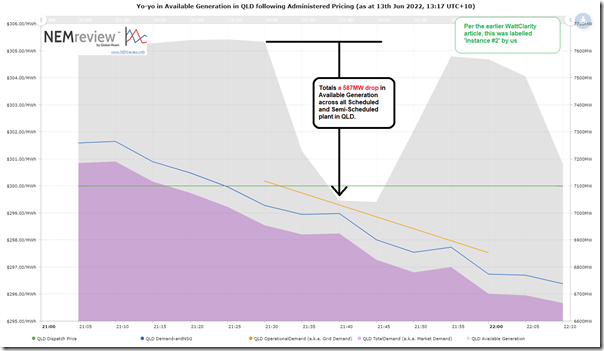
Let’s start with this overview:
Clients with their own licence to NEMreview v7 can open their own copy of this trend query here.
As noted on the image, from 21:30 to 21:40 we see a collective 587MW drop in Available Generation over two dispatch intervals, followed by an almost equal rise from 21:45 to 21:55.
(B) Reviewing bids
With reference to the ‘Bids & Offers’ widget in ez2view I’ve time-travelled back to around that time and had a bit of a look and would like to highlight two particular images from around that time:
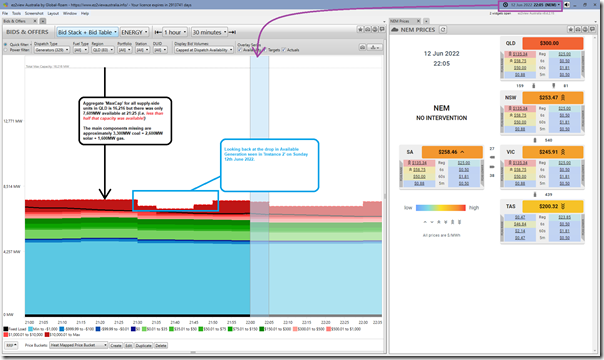
I’ve started here to put the 587MW drop in Available Generation into context.
As noted in the image:
1) There’s a massive amount of capacity missing (i.e. 8,607MW) even before the 587MW drop being explored here;
2) That’s more than half of the installed capacity in the QLD region!
i.e. 16,216MW aggregate MaxCap less 7,609MW Available at the time.
3) Of this capacity, the big chunks unavailable at this time include:
(a) 3,300MW of coal unavailable … as Allan explored here over time and with this ez2view snapshot communicating what was out;
(b) 2,600MW of solar unavailable … because it’s night time;
(c) 1,600MW of gas unavailable … also discussed here.
With that context in mind, let’s have a closer look at three assets in particular:
(B1) BRAEMAR7 comes offline for low pipeline pressure
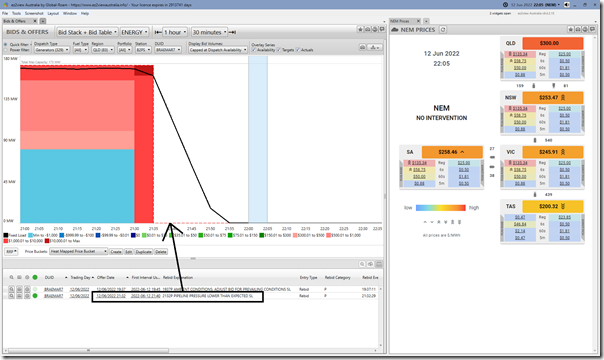
In this snapshot here we see the Braemar 7 unit (i.e the only unit in Braemar B station that was running earlier) come offline with ‘Pipeline pressure lower than expected’ as the rebid reason:
That represented 171MW of the 587MW aggregate drop in Available Generation.
(B2) The Wivenhoe units
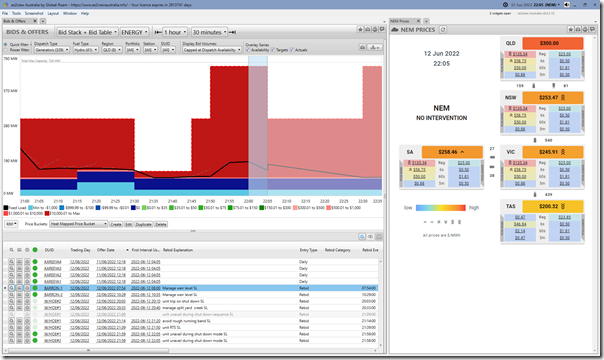
And here’s an aggregate view of bids in that same window from all of the QLD hydro plant:
We can see the net effect of W/HOE#2 (285MW AvailGen) coming off at 21:35.
Both units at Wivenhoe were made available by 21:55 … though one does wonder how much water they actually had in storage given rebid reasons about ‘manage split year creek’ and ‘manage weir level’ seen earlier in the time window.
(B3) Mt Stuart
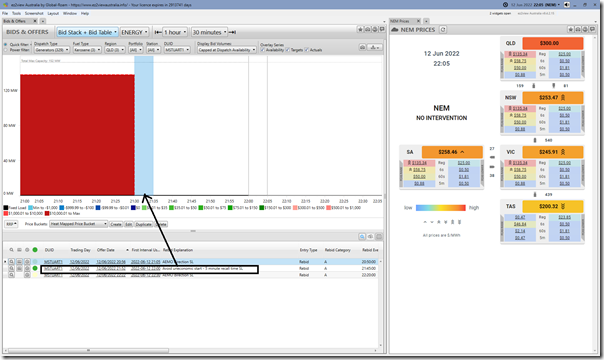
Working through the numbers, 285+177 = 462MW which is still 125MW below the 587MW aggregate drop.
We need to look at MSTUART3 (below) to see the 138MW drop in Available Generation at 21:35 for reasons of ‘avoid uneconomic start’ … which was similar to what we saw on Friday evening last week as well:
With prices capped at $300/MWh for at least a week … and probably much, much longer … I can’t see how any plant with a SRMC above that level can run economically (and that includes Wandoan and Wivenhoe in terms of ‘buy low and sell high’ as well)!
Clearly there is going to be a massive call on the compensation processes AEMC speaks about here.


Leave a comment