In my article on Sunday I noted that it was ‘Blowing a gale across SE Australia … but July has not (yet?) hit a new peak instantaneous wind output record’ – and this generated some interest internally, and also externally as well (including on RenewEconomy here).
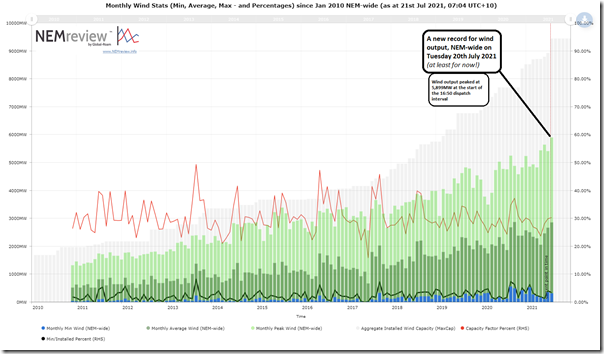
One of our team members let me know that we’d exceeded the prior record yesterday afternoon, so I thought I would update the same longer term trend here:
Here’s your copy of that query again, for those who have licensed access to NEMreview v7.
(A) Some stats, about the new record NEM-wide wind production
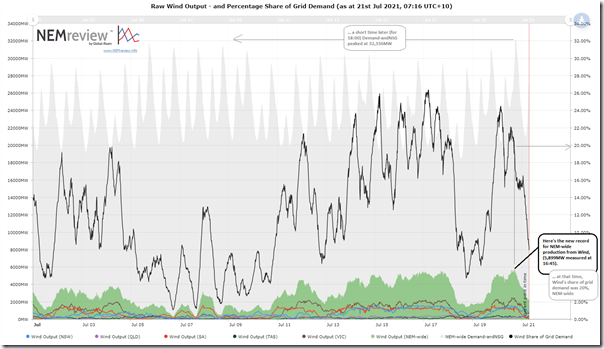
Looking in more detail just at the month of July 2021 (thus far on Wednesday morning) we see that the wind production peaked at 5,899MW metered at 16:45 on Tuesday 20th July 2021 (i.e. InitialMW for the start of the 16:50 dispatch interval). That’s considerably higher than the prior record (5,642MW) set in May 2021.
Again, those who have have licensed access to NEMreview v7 can access their own copy of this query here.
On this chart I have also included other data points:
1) NEM-wide‘Demand and Non-Scheduled Generation’ … as a data set with 5-minute cadence that closely matches what AEMO publishes on a 30-minute basis later for Operational Demand. We see that the peak yesterday afternoon occurred a little over an hour before this ‘Grid Demand’ measure exceeded 32,000MW for the evening (not a record, but does not happen all that often, these days).
2) With this Demand data point I have also added in a ‘Percentage share of supply from wind’ … which we can see:
(a) Exceeds 26% NEM-wide at some points during the month of July;
(b) Was roughly 20% at the time when the absolute value hit its new peak; but
(c) Also has been well below 2% at other times.
3) I’ve also added on regional contributions from wind generation.
(a) Yesterday at the time of peak NEM-wide contribution, we see:
i. VIC contribution clearly the largest
ii. SA and NSW contribution trending (roughly) together
iii. TAS and QLD contribution being the smallest (roughly) together
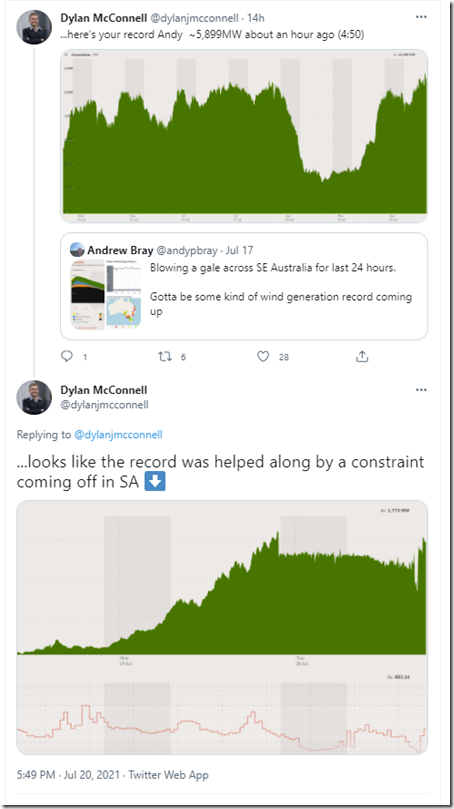
(b) With the South Australian trend, it’s quite easy to see long stretches of time when the output is sitting flat (e.g. around 1,300MW – though exact point does vary depending on other factors). On that note, I also saw Dylan McConnell on Twitter make the point that the ‘System Strength’ constraint unbound in time to let South Australia
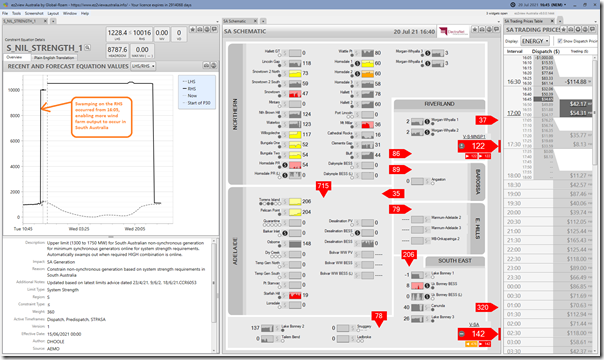
Using ez2view under ‘Time Travel’ to investigate, it appears that the swamping term on the RHS of the ‘S_NIL_STRENGTH_1’ Constraint Equation was triggered from the 16:05 dispatch interval.
Here’s a snapshot for the 16:45 interval – with output values in the SA Schematic being ‘end of interval’ values in Time Travel, so corresponding to the new record for NEM-wide wind generation:
Interestingly, the two x rebids shown for Hornsdale 1 WF and Hornsdale 2 WF had rebid reasons ‘Reduced Plant Availability’, and so would have been one factor contributing to why output dropped from this peak point.
(B) About percentages
I was interested to look at ‘share of total production’ in the chart above … complete with the highs and the lows over the period.
New AEMO CEO, Daniel Westerman, did cause a bit of a stir last week in mentioning the 100% figure in his ‘view from the Control Room’ talk at CEDA. Response to the talk seemed to have been understandable mixed (given that we still have those at both extremes of the Emotion-o-meter very vocal about this energy transition).
Given that the trajectory seems pretty clear (i.e. we’re going to see increased percentages of instantaneous renewable penetration) and that there are genuine questions some are asking (of what happens as this increases, and about the timeframe (including Matthew Warren here)) we’re going to invest some more time in compiling GenInsights21 to include a focused appendix on ‘100% Renewables’.
Development is continuing to progress, though it’s being juggled with our more immediate priorities (such as the sheer mountain of work that Five Minute Settlement represents).


So how much will we need to flatten out the bumps and fill in the slumps?
https://www.energetics.com.au/insights/knowledge-centres/large-scale-storage-tracker
This is something we’re 90% complete in directly exploring for an Appendix in GenInsights21, as noted here:
https://wattclarity.com.au/articles/2021/04/announcing-development-of-geninsights21-preorder-open/
… hint = it’s a lot!