Our 15th Case Study in the series was published just over 2 weeks ago, and was a long one that dealt with 5 separate extreme events* on Wednesday 7th November 2018.
* in terms of ‘extreme events’, we’re specifically looking at Dispatch Intervals where there has been:
Scenario 1) more commonly ‘large’ collective under-performance across all Semi-Scheduled units (being measured as Aggregate Raw Off-Target > +300MW); or also
Scenario 2) much less frequently ‘large’ collective over-performance across all Semi-Scheduled units (being measured as Aggregate Raw Off-Target <-300MW).
In the two weeks that followed, we turned out minds back to more recent events (including a couple bouts of minimum demand) and also into the future (with the release of the ESOO 2020, a Notice of Inertia Shortfall, and also the ESB’s Discussion Paper on NEM 2.0). All pieces of the same puzzle, relating to this energy transition.
—
Returning to the past, but into 2019, we publish this 16th Case Study today. It’s a simpler one, looking at just a single dispatch interval in a summer’s afternoon (15:40 on Mon 4th Feb 2019) where the collective under-performance was +308MW.
(A) Background context
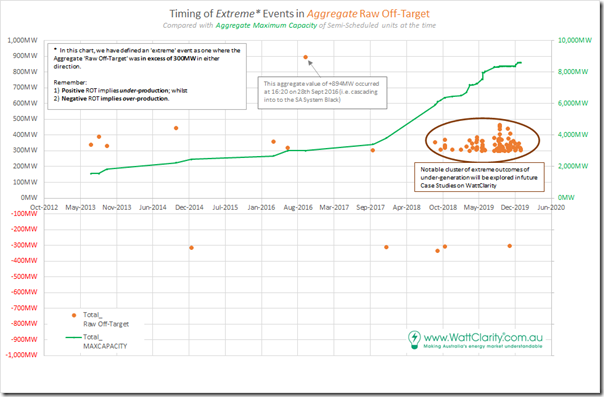
Remember that we identified a total of 98 discrete instances where aggregate Raw Off-Target across all Semi-Scheduled units was either:
(a) above +300MW (representing collective under-performance) or, much less commonly,
(b) under –300MW (representing collective over-performance relative to AEMO’s expectations, seen in the Dispatch Target).
There was a smattering of only 10 cases through 2013, 2014, 2015, 2016, 2017 and through until August 2018. However thereafter (to the end of 2019) there was a sharp escalation of extreme incidents – as seen in the following chart:
Note also that we have not yet looked into 2020 data, which will be the focus of the GSD2020 (so we can’t comment on whether the trend from 2019 has continued to grow).
We’re doing this given a push from the AER Issues Paper, but moreso inspired by the deliberations by the (now defunct) COAG Energy Council and (extended?) ESB relating to ‘NEM 2.0’. Note that these case studies deal with imbalance in the Dispatch Interval timeframe, but readers should understand that there are other challenges that ‘NEM 2.0’ also needs to resolve, including:
Other Challenge #1) Within the dispatch interval timeframe, energy-related services focused on frequency maintenance and response to contingencies;
Other Challenge #2) Relating to ‘firmness’ of supply in the broader forecast horizon; and
Other Challenge #3) Others that we bundled into a ‘keeping the lights on’ services in our discussions in the Generator Report Card 2018 (for instance, in relation to System Strength).
In preparing these focused Case Studies, we’re seeking to understand why and what the implications are of this escalation.
(B) Summary results for Monday 4th February 2019
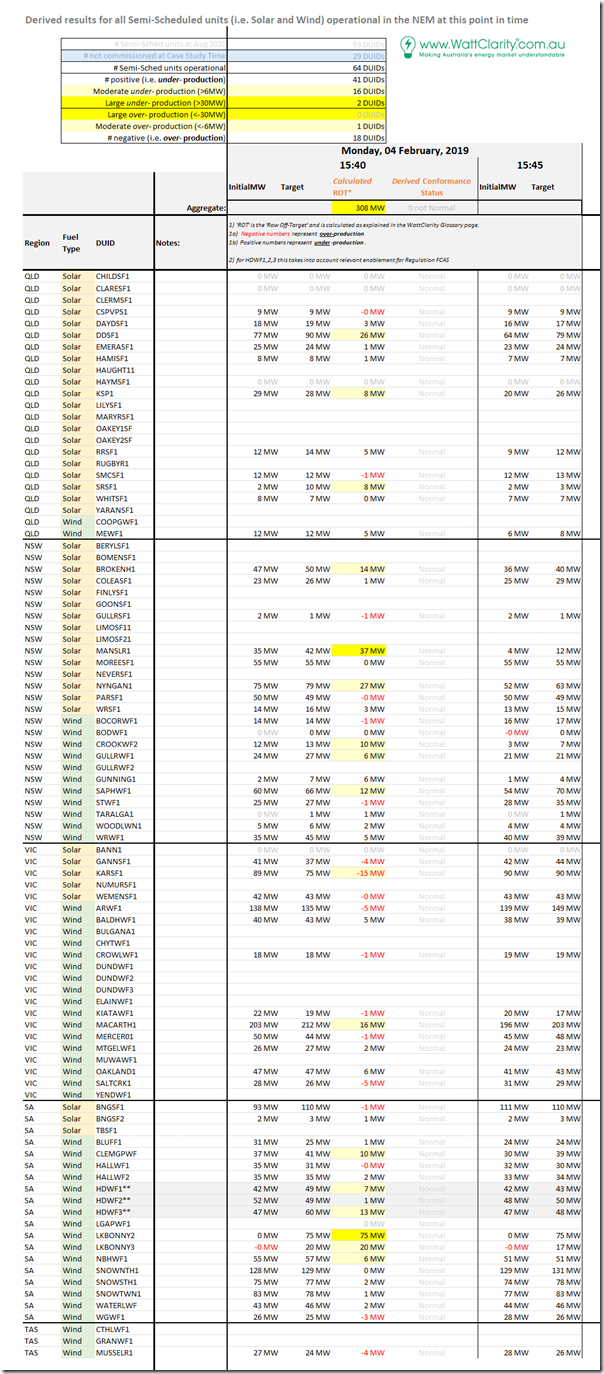
Here’s the same tabular framework of results for individual Raw Off-Target performance of all 64 x Semi-Scheduled units that were operational at the time (2 more than the 62 present on 19th December 2018, under 7 weeks beforehand):
In summary from this table, we can see the following:
1) Of the 64 DUIDs registered at the time, there are more than double the number under-performing (41DUIDs) as there are over-performing (18 DUIDs).
2) Of the units highlighted as having Raw Off-Target greater than 6MW (a threshold that is one of the inputs in determining Conformance Status for a unit), we see the split is even more unbalanced:
(a) 16 DUIDs flagged as under-performing by at least 6MW (with 2 of these under-performing by more than 30MW); whilst
(b) Only 1 DUID flagged as over-performing by at least 6MW.
… which, needless to say, is a very skewed ratio (and not the first time we have seen it, either).
This is one more example we see where the commonly touted belief that I might paraphrase as ‘the unders and overs will average out’ just does not hold true, at least in many of these extreme events.
(C) Results for individual DUIDs
Once again we use the ‘Unit Dashboard’ widget in ez2view (and the ‘Time Travel’ powerful rewind functionality) to review what some of the core stats were for this point in time for each of the units flagged as having significant Raw Off-Target:
(C1) Two DUIDs showing large under-performance
We’ll start with the three DUIDs that show Raw Off-Target of greater than 30MW, a quite significant deviation for an individual unit:
(C1a) Manildra Solar Farm (+37MW under-performance) in NSW Region
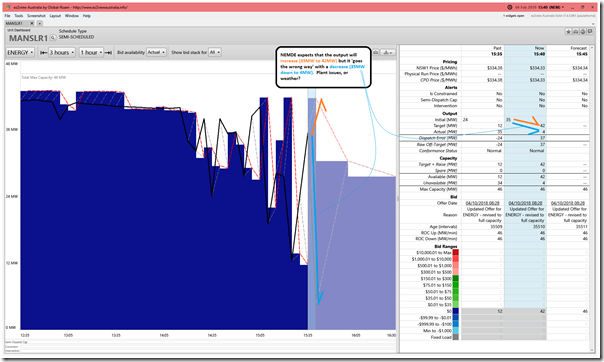
Here’s what MANSLR1 looked like:
In this case, NEMDE is blindsided to the aggregate under-performance amount of +37MW as:
i. It expected the unit to increase output from 35MW to 42MW; but instead
ii. The unit actually decreased output (from 35MW) down to 4MW.
It’s not clear, on cursory examination, whether this was due to some plant-related problem – or whether it was weather (i.e. cloud cover) related. Note this one down as another case of a unit that’s ‘gone the wrong way’.
(C1b) Lake Bonney 2 Wind Farm (+75MW under-performance) in SA Region
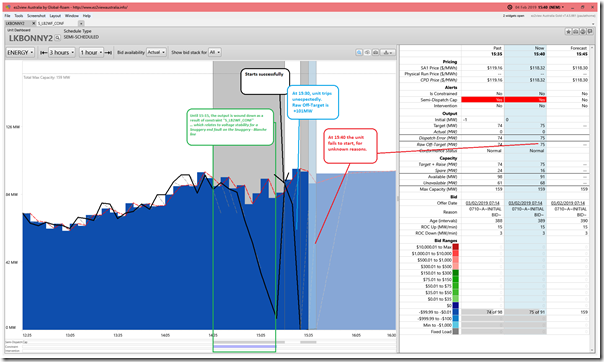
Here’s what LKBONNY2 looked like:
As per the annotations, the unit’s output had been ‘constrained down’ to 15:15 as a result of the ‘S_LB2WF_CONF’ constraint equation – which is ‘System Normal’ constraint that always is there to ‘maintain voltage stability for a Snuggery end fault on the Snuggery – Blanche line’.
After that point the unit returns to full output successfully at 15:15, but then trips unexpectedly at 15:30 and subsequently fails to start at 15:35 and 15:40.
(C2) Fourteen other units showing moderate under-performance
As noted in the table above, there were fourteen other units with moderate under-performance (greater than 6MW but under 30MW) – compared to only one unit that was below –6MW. Rather than walk through all of them in turn, I’ve just highlighted the three (next) largest – top to bottom in the table:
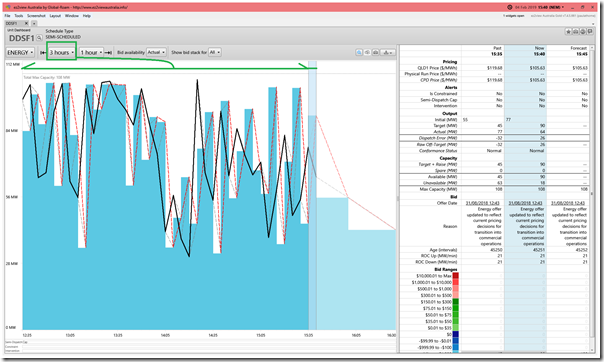
(C2a) Darling Downs Solar Farm (+26MW under-performance) in QLD Region
Here’s what DDSF1 looked like:
I had noted back at the time that the flooding event in northern Queensland had cut the output of many of the solar farms in northern Queensland.
Whilst DDSF1 was over 500km south of the major rain location, I wonder whether the weather pattern was the cause of the ‘up and down like a yo-yo’ pattern seen over the 3 hours to this point in time.
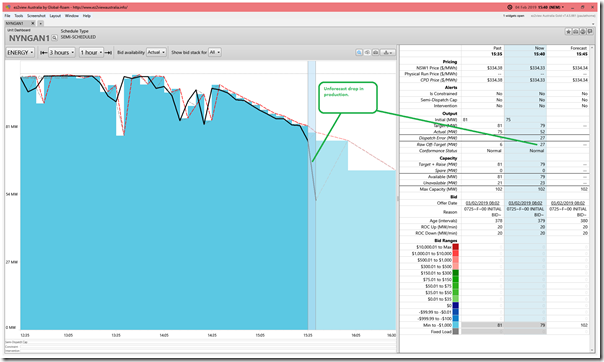
(C2b) Nyngan Solar Farm (+27MW under-performance) in NSW Region
Here’s what NYNGAN1 looked like:
In this case, of the hour beforehand the plant had been steadily dropping in output with the passing sun in the sky. The larger drop in output at 15:40 was unexpected (cloud cover?)
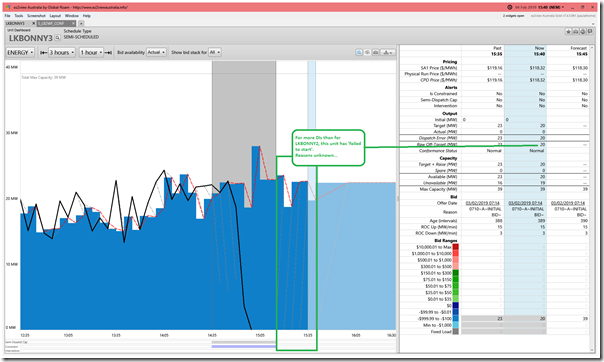
(C2c) Lake Bonney 3 Wind Farm (+20MW under-performance) in NSW Region
Here’s what LKBONNY3 looked like:
Curious that a similar sort of dynamic seemed to occur at Lake Bonney 3 (i.e. also ‘fail to start’ after being constrained down), though not as large as Lake Bonney 2.
I’ll leave this article here…


Leave a comment